Volume 3, Issue 10 (September 2012), PP. 83-101
A Freeway Travel Time Reliability Study
Virginia P. Sisiopiku
1, Md Saidul Islam
21University of Alabama at Birmingham, Associate Professor, 1075 13th St S., Birmingham, AL 35294 2
University of Alabama at Birmingham, Research Assistant, 1075 13th St S., Birmingham, AL 35294
Abstract—The objective of this study was to identify measures appropriate to estimate travel time reliability and apply them to study the reliability of travel time under varying freeway operating conditions. More specifically, a case study was undertaken to study travel time reliability along the I-65 corridor in the State of Alabama. The objectives of this study were to: a) Calculate reliability metrics using travel time data collected from INRIX for a study corridor, b) Investigate effects of traffic incidents on travel time reliability, and c) Validate the planning time index (PTI) model proposed by SHRP2 L03 project using field data from the study corridor. The findings from the study are expected to advance the understanding of travel time variability under incident and non-incident conditions and assist authorities and transportation agencies in their efforts to improve the planning, design, and operation of transportation facilities.
Keywords—Travel time reliability, freeway, non-incident, incident, planning time index, Birmingham, Alabama
I.
INTRODUCTION
A. Study Background
Performance of the transportation sector is popularly regarded as one of the key indicators of a nation’s economic development. Transportation professionals strive to ensure that the movement of people and goods on the nation’s highway is at its maximum efficiency. While attention has focused on maximizing throughput and reducing travel time and delay, travel time reliability has not been considered until recently. Travel time reliability is indicative of the probability of making trips on time [1] and indicates the degree of consistency of a particular mode, corridor, or route over a time period.
Understanding travel time reliability and ensuring that travel time is as reliable as possible is critical towards achieving effective transportation operations and providing quality service when transporting people and goods. Reliable travel time is related to the on-time arrival of shipments for freight operations and the traveller’s route choice preference and satisfaction.
Many factors affect the reliability of travel time in a transportation system (e.g., presence of bottlenecks, incidents, work zones, special events etc.). Traditional methods of assessing operational conditions of transportation facilities, such as the widely accepted Highway Capacity Manual (HCM)-based Level of Service (LOS) methodology, fall short of including travel time reliability as part of their procedures. Further study of travel time reliability is important in order to develop reliability measures that can provide additional information for traffic engineers, transportation managers and road users on the quality of network operating conditions.
B. Study Objective
This work was undertaken to study travel time reliability on the basis of a literature review and synthesis and a case study. The case study used data collected from INRIX along the I-65 corridor in Birmingham, Alabama to:
a) Calculate reliability metrics including standard deviation, % variability, buffer time, buffer time index, travel time index and planning time index using travel time data
b) Investigate the effect of traffic incidents on travel time reliability, and
c) Compare the planning time index values obtained from field data to those calculated using a model proposed by the Strategic Highway Research Program 2 (SHRP2) L03 project [3].
II.
LITERATURE REVIEW
A. Travel Time Reliability Measuring Techniques
Many reliability indices have been proposed in recently-completed travel time reliability research and used to quantify travel time reliability. The most commonly used travel time reliability measures are the 95% (or 90%) percentile travel times, the buffer index, and the planning time index [5].
1) 95th or 90th percentile travel times: This is the easiest method of measuring the travel time reliability of a road network. The first and second worst travel times over a month mark the 95th or 90th percentile travel time respectively. These worst situations are caused normally from non-recurring congestions, i.e. traffic crashes, inclement weather, construction work and special events. This measure is reported in minutes (min) and is used to determine reliability indices such as the buffer index.
2) Buffer time and buffer time index (BTI): Buffer time represents the extra time that a traveller must have in order to arrive to his/her destination on time. The buffer time and the buffer time index (BTI) are defined as follows:
A BTI of 30% means that if a trip requires, 20 minutes to complete (on average) then the traveller should have 6 minutes extra to ensure on time arrival.
3) Planning time index (PTI): This indicates the total time a traveller needs to consider to ensure on time arrival. To find out the total time one must multiply PTI with the free flow travel time. While the buffer time represents the additional time for on-time arrival, the planning time index shows the total required time and represents the 95% percentile travel time.
B. Earlier Studies on Travel Time Reliability
As the realization of the importance of travel time reliability has increased in the recent past, so has the interest in related research aiming at quantifying and analysing travel time reliability. One of the biggest hurdles of conducting research in this area of study is the lack of detailed historical data. The next paragraphs summarize some recent notable studies in this field.
A 1998 study by Cambridge Systematics Inc. defined reliability as a measure of variability over time while Lomax et al [8] defined reliability as the measure of the amount of congestion users of the transportation system experienced at a given time. In a 2008 study performed by Lyman and Bertini [9] travel time reliability was defined as the consistency or dependability of a particular trip’s travel time measured from day to day and/or across different times of the day.
Susilawati et al [10] conducted a study to measure travel time reliability for ten corridors in the Adelaide metropolitan area. They used eight years of consecutive travel time data to calculate the BTI and the PTI to assess the traffic performance on Adelaide road networks. Due to the lack of detailed data they calculated BTI and PTI indices for the entire study period, rather than by the time of day or month. The study reported that the BTI and PTI underestimated the travel time reliability with significant differences between the mean travel time and the 95th percentile travel time. For this reason they conducted travel time distribution and variability analyses to further study travel time reliability and estimate basic statistical parameters such as mean, variance, standard deviation, kurtosis, and skewness. After conducting the Kolmogorov-Smirnov and Chi Square tests of goodness-of-fit, they found that the travel time did not follow normal distribution, but rather followed log normal distribution.
Hojati et al [6] undertook a study to determine the major causes of travel time unreliability, or travel time variability (TTV). They, at first, attempted to define travel time reliability and considered the definitions already suggested by other researchers in this area of travel time reliability. Then they selected a section along the Pacific Motorway (M1), a major freeway in Brisbane, to obtain travel time reliability measures such as percent variation, buffer time index, misery index etc. The study results suggested that the various travel time reliability measures considered followed a similar trend with increasing traffic volume. The study concluded that traffic volume could be considered as an effective factor in modelling travel time reliability. It should be noted that the study only considered the effect of traffic demand on travel time reliability, and suggested further research to account for the effect of other factors on travel time reliability.
Another study by Bertini et al [2] developed improved travel time reliability measures for real-time and archived intelligent transportation systems (ITS) data applications. They explored ways in which travel time reliability can be measured over a segment, a corridor and an entire urban area using real time and archived data. They also investigated travel time reliability between 2004 and 2006 using different reliability measures along the I-5 freeway in Portland, Oregon. Data were obtained from the Portland Oregon Regional Transportation Archive Listing (PORTAL) which had archived data from more than 500 freeway sensors since 2004. From their analysis they established some trends indicating increasing travel times and worsening reliability during peak AM and PM times.
Chen et al [4] conducted another study on a section of I-5 North in Los Angeles County, CA along a 20 mile four-lane segment. Using data from the Freeway Performance Measurement project (PeMS) they calculated travel times from measured speed. PeMS maintains real-time 30-sec loop detector data for almost all freeways of California on behalf of Caltrans. For measuring travel time reliability they calculated mean, median, 10th and 90th percentile travel time and plotted those values to study travel time trends during peak times. This study also attempted to find out the extra traveller cost for travel time uncertainty. They used the 90th percentile travel time for quantifying extra travel cost. They also quantified the effects of incidents on travel time and reported that the value of standard deviation and median are increased when incidents are present.
Tu et al [11] also studied the effects of traffic accidents on travel time reliability. As traffic accidents cause a sudden decrease of roadway capacity, it is expected that they also contribute to less travel time reliability. For the study purpose some hypotheses were stated and tested. These include: a) Traffic accidents lead to higher probability of traffic breakdown, b) Traffic accidents result in higher travel time variability, and c) Traffic accidents contribute to less reliable travel times. To justify those hypotheses, extensive traffic accident and traffic flow data were collected on a motorway in the city of Rotterdam, Netherland. From the analysis, some important information surfaced regarding impacts of traffic accidents on travel time reliability. It was found that traffic accident presence increased the 90th percentile travel time by an average of 75% whereas the variability of travel time increase by four times compared to non-incident conditions. The study also revealed that both critical transition inflow and critical capacity inflow were lowered in the travel time reliability model by the presence of traffic accidents. Also, the expectation that both the probability of traffic breakdown in freeway corridors and travel time unreliability would be increased by traffic accidents was substantiated by the study.
In 2009 Cambridge Systematics, Inc. undertook a project known as SHRP 2 Project L03 to develop predictive relationships between various types of highway improvements (such as capacity improvement) and travel time reliability [3]. Sources of traffic data used in the study were the traffic management centres (TMCs) of four US cities, e.g. Atlanta, Houston, Seattle, and Jacksonville. Traffic.com provided the incident and event data from their Traveller Information Management System (TIMS) and weather data were obtained from the National Climatic Data Centre (NCDC) of the National Oceanic and Atmospheric Administration (NOAA). Satellite imagery (lane configurations) and the 2007 Highway Performance Monitoring data were the sources for geometric data for this project. The study had four distinct analytical steps: 1) Exploratory analysis used to understand the concept of reliability and various related parameters; 2) Before and after case studies; 3) Cross-sectional statistical modelling; and 4) Congestion-by-source analysis. The exploratory analyses led the researchers to add an 80th percentile travel time in the list of reliability performance metrics as they suggested that 95th percentile travel time is too extreme of a value to be influenced significantly by traffic operational strategies. Also they found BTI to be too erratic for use as the primary reliability metric. From the before and after studies conducted, it was categorically established that average congestion is reduced and travel time reliability is improved as a result of all forms of improvements considered, including operational enhancements and capacity expansion.
In the cross-sectional statistical modelling step of the 2009 Cambridge Systematics study [3], two forms of models (i.e. simple and complex models) were developed to predict the overall travel time characteristics of a highway section in terms of both mean and reliability performance. The main purpose of congestion-by-source analysis was to find out the factors that cause congestion to form. Focusing on the Seattle area, they studied in detail all seven causes of congestion i.e. traffic incidents, weather, work zones, fluctuations in demand, special events, traffic control devices, and bottlenecks. The study revealed that a majority of travel delays and thus congestion in the region was the direct result of traffic volume demand exceeding available roadway capacity.
While the literature provides helpful insights on travel time reliability measurement methods and trends, localized studies are important to capture the true dynamics of travel time reliability at a certain location. The following sections describe such a study that examined travel time reliability along the I-65 corridor in Birmingham, Alabama.
III.
CASE STUDY DESCRIPTION
A. Site Location
The Birmingham case study reported herein used travel time data from a 19.75 mile long stretch of Interstate 65 (I-65) in Alabama to analyse travel time reliability measures with and without incident presence. The study corridor is located in the Birmingham metropolitan area and extends from Walker Chapel road on the north to the Shelby/Jefferson County line to the south. Each direction of travel of the study corridor was divided into 36 links (i.e., links 1001 to 1036 in the NB direction and links 1046 to 1081 in the SB direction). Table 1 shows the study links and corresponding milepost information and Table 2 provides details on study link description and lengths on both directions of travel (in miles).
TABLE 1: STUDY LINKS BY MILEPOST
Milepost NB Link SB Link
249 1037 1081
250 1034, 1035 1079, 1080
251 1033, 1034 1078, 1079
252 1032, 1033 1077, 1078
253 1031, 1032 1076, 1077
254 1030, 1031 1075, 1076
255 1028, 1029 1073, 1074
256 1026, 1027 1071, 1072
257 1024, 1025 1070, 1071
258 1024, 1025 1069, 1070
259 1019, 1020, 1021, 1022, 1023 1064, 1065, 1066, 1067, 1068
260 1015, 1016, 1017, 1018 1060, 1061, 1062, 1063
261 1013, 1014 1058, 1059
262 1009, 1010, 1011, 1012 1054, 1055, 1056, 1057
263 1007, 1008 1052, 1053
264 1005, 1006 1050, 1051
265 1004, 1005 1049, 1050
266 1003, 1004 1048, 1049
TABLE 2:STUDY CORRIDOR LINKS AND CHARACTERISTICS
NB Link SB Link Link ID Link Length (in miles)
NB links SB links
1001 1046 I-65N Walker Chapel Rd (Exit267) 0.58 0.74
1002 1047 I-65N Walker Chapel Rd (Exit267) 0.98 1.28
1003 1048 I-65N Hwy31 (Exit266) 0.68 0.48
1004 1049 I-65N Hwy31 (Exit266) 1.36 1.43
1005 1050 I-65N 41st Ave (Exit264) 0.27 0.51
1006 1051 I-65N 41st Ave (Exit264) 0.49 0.26
1007 1052 I-65N 32nd Ave/33rd Ave (Exit263) 0.63 0.46
1008 1053 I-65N 32nd Ave/33rd Ave (Exit263) 0.3 0.31
1009 1054 I-65N Finley Blvd (Exit262B) 0.33 0.37
1010 1055 I-65N Finley Blvd (Exit262B) 0.45 0.4
1011 1056 I-65N 16th St (Exit262A) 0.26 0.25
1012 1057 I-65N 16th St (Exit262A) 0.31 0.34
1013 1058 I-65N I-20/I-59 (Exit261) 0.48 0.51
1014 1059 I-65N I-20/I-59 (Exit261) 0.24 0.25
1015 1060 I-65N 6th Ave (Exit260) 0.28 0.26
1016 1061 I-65N 6th Ave (Exit260) 0.07 0.07
1017 1062 I-65N 3rd Ave (Exit260B) 0.21 0.21
1018 1063 I-65N 3rd Ave (Exit260B) 0.43 0.32
1019 1064 I-65N 4th Ave (Exit259B) 0.07 0.12
1020 1065 I-65N 4th Ave (Exit259B) 0.09 0.09
1021 1066 I-65N 6th Ave (Exit259A) 0.02 0.09
1022 1067 I-65N Hwy149/University Blvd (Exit259) 0.29 0.12
1023 1068 I-65N Hwy149/University Blvd (Exit259) 0.77 0.84
1024 1069 I-65N Green Springs Ave (Exit258) 0.44 0.43
1025 1070 I-65N Green Springs Ave (Exit258) 0.97 0.93
1026 1071 I-65N Oxmoor Rd (Exit256) 0.56 0.53
1027 1072 I-65N Oxmoor Rd (Exit256) 0.62 0.44
1028 1073 I-65N Lakeshore Dr. (Exit255) 0.4 0.32
1029 1074 I-65N Lakeshore Dr. (Exit255) 0.95 1.19
1030 1075 I-65N Alford Ave (Exit254) 0.54 0.49
1031 1076 I-65N Alford Ave (Exit254) 1.44 1.27
1032 1077 I-65N US-31/Montgomery Hwy (Exit252) 0.23 0.16
1033 1078 I-65N US-31/Montgomery Hwy (Exit252) 1.07 1.37
1034 1079 I-65N I-459(Exit250) 1.03 1.04
1035 1080 I-65N I-459(Exit250) 1.05 1.05
1036 1081 I-65N Shelby/Jefferson County Line 0.86 0.81
B. Data Description
The travel time data used in this study were collected with the help of Geographic Positioning Systems (GPS) technology placed on freight vehicles traversing the study corridor. The data processing task was conducted by INRIX, a leading provider of traffic information. The data were collected over the months of February, March, and April of 2010, during the AM and the PM peak hours on Mondays, Tuesdays, Wednesdays, and Thursdays, which are considered as typical weekdays for traffic analysis purposes. Public holidays were excluded from the data set. The morning peak hours extended from 6:00 AM to 10:00 AM, while the afternoon peak hours covered the 3:00 PM to 7:00 PM time period.
TABLE 3:A SAMPLE OF TRAVEL TIME DATA AVERAGED OVER 5-MINUTES
Date Time Link ID Travel Time (sec) Average Travel
Time (sec)
3/8/2010 9:20:00 AM 1010 30
29.6
3/8/2010 9:21:01 AM 1010 29
3/8/2010 9:22:00 AM 1010 29
3/8/2010 9:23:01 AM 1010 30
3/8/2010 9:24:00 AM 1010 30
3/8/2010 9:25:01 AM 1010 31
31.0
3/8/2010 9:26:00 AM 1010 31
3/8/2010 9:27:01 AM 1010 31
3/8/2010 9:28:00 AM 1010 31
3/8/2010 9:29:01 AM 1010 31
IV.
CASE STUDY METHODOLOGY
This chapter presents the methodology used in this study to calculate and interpret different travel time reliability indices along the I-65 corridor. This was accomplished using some popular formulas which have been discussed in the literature review chapter. The average and standard deviation of travel time values were calculated using common statistical formulas.
Initially, the variation of reliability indices was studied on a link by link basis. Using the study travel time data, the standard deviation, % variability, buffer time, PTI, TTI, and BTI indices were determined by direction and peak time study period and the results were analysed and compared. Also the variation of PTI along NB and SB links was studied on a 5-min time interval and conclusions were drawn from the plots regarding the times during which links experienced higher PTI values.
To study the effect of incidents on travel time reliability along the study corridor, incident data collected by the Alabama Service and Assistance Patrol (ASAP) were used. The database was split into incident and non-incident data records and analysis of records was performed separately to observe how PTI varied with- and without traffic incident presence.
Finally, this study compared I-65 field PTI values with PTI values calculated using the model proposed by SHRP2 L03 project in order to evaluate its robustness and its applicability to local conditions.
A. Preparation of Case Study Analysis Dataset
Close inspection of the travel time data produced by INRIX indicated some reporting errors on a few of the study links. These were likely linked to mechanical errors of the GPS receivers attached to the freight vehicles. Data with anomalies were deleted from the study database to make the analysis consistent. The links listed in Table 4 had erroneous data, so they were neglected during the analysis.
TABLE 4: LIST OF STUDY LINKS WITH ERRONEOUS GPSDATA
Time Period NB Links SB Links
AM 1021
PM 1021 1068, 1070, 1074, 1076, 1077, 1078
In addition, no data were reported for link 1081 for AM peak time in the southbound direction and for link 1036 for PM peak time in northbound direction and thus those links were excluded from the analysis, as well.
B. Calculation of Travel Time Indices
The travel time data for the case study links were used to calculate different statistical properties (average, standard deviation, 95th percentile travel time) and different indices, i.e. travel time index (TTI), buffer time index (BTI), and planning time index (PTI). As a sample, Tables 5 and 6 showcase various properties and indices calculated for links 1001 (AM peak period) and 1002 (PM peak period) respectively. In a similar fashion, travel time properties for all other study links were calculated [7] and then graphs were plotted to examine the trends of travel time reliability indices across the links. It should be noted that the calculation of PTI required knowledge of free flow travel time. Thus the free flow speed of 70mph was used for the entire network to calculate free flow travel times for all study links.
C. Corridor-wise Variation of Reliability Indices
TABLE 5:STATISTICAL MEASURES AND RELIABILITY INDICES FOR LINK 1001(FFTIME =29.83 SEC);AMPEAK Time
AM
Average Time (sec)
Std. Dev
% Variation
95th Percentile Time (sec)
Buffer
Time (sec) PTI BTI TTI
6:04:01 31.29 1.46 1.05 4.66 33.18 1.89 6.03 1.11
6:09:01 31.19 1.76 1.05 5.65 33.92 2.73 8.75 1.14
6:14:01 31.87 2.82 1.07 8.86 35.18 3.31 10.40 1.18
6:19:01 31.82 3.07 1.07 9.64 35.00 3.18 10.00 1.17
6:24:01 31.77 3.39 1.07 10.66 34.60 2.83 8.90 1.16
6:29:01 31.54 2.89 1.06 9.16 33.98 2.44 7.74 1.14
6:34:01 30.97 1.60 1.04 5.18 33.00 2.03 6.55 1.11
6:39:01 30.76 1.36 1.03 4.41 32.76 2.00 6.51 1.10
6:44:01 30.94 1.40 1.04 4.52 32.98 2.04 6.58 1.11
6:49:01 31.61 2.81 1.06 8.87 35.24 3.63 11.47 1.18
6:54:01 31.26 2.09 1.05 6.68 33.90 2.64 8.46 1.14
6:59:01 30.98 1.52 1.04 4.92 33.98 3.00 9.70 1.14
7:04:01 31.05 1.90 1.04 6.13 34.54 3.49 11.24 1.16
7:09:01 31.46 3.09 1.05 9.82 34.92 3.46 11.01 1.17
7:14:01 30.97 1.97 1.04 6.37 33.76 2.79 9.00 1.13
7:19:01 31.43 3.40 1.05 10.82 33.36 1.93 6.15 1.12
7:24:01 30.78 1.59 1.03 5.17 33.00 2.22 7.21 1.11
7:29:01 30.87 1.32 1.03 4.27 32.78 1.91 6.20 1.10
7:34:01 31.47 2.42 1.05 7.68 33.96 2.49 7.93 1.14
7:39:01 31.12 1.23 1.04 3.95 33.00 1.88 6.04 1.11
7:44:01 30.91 1.25 1.04 4.05 33.00 2.09 6.76 1.11
7:49:01 30.92 1.57 1.04 5.07 33.50 2.58 8.34 1.12
7:54:01 31.37 2.01 1.05 6.41 34.96 3.59 11.44 1.17
7:59:02 31.41 2.48 1.05 7.89 36.70 5.29 16.83 1.23
8:04:02 31.36 2.05 1.05 6.53 34.90 3.54 11.28 1.17
8:09:01 31.50 1.79 1.06 5.69 34.40 2.90 9.20 1.15
8:14:01 31.40 1.88 1.05 5.97 34.52 3.12 9.92 1.16
8:19:01 31.30 1.67 1.05 5.33 34.58 3.28 10.47 1.16
8:24:01 31.38 1.55 1.05 4.94 33.74 2.36 7.53 1.13
8:29:01 31.01 1.59 1.04 5.12 33.58 2.57 8.27 1.13
8:34:01 30.77 1.28 1.03 4.14 32.90 2.13 6.92 1.10
8:39:01 30.75 1.18 1.03 3.84 32.38 1.63 5.29 1.09
8:44:01 31.13 1.40 1.04 4.51 33.38 2.25 7.23 1.12
8:49:01 31.11 1.54 1.04 4.95 33.38 2.27 7.29 1.12
8:54:01 31.20 3.14 1.05 10.07 34.00 2.80 8.96 1.14
8:59:01 30.87 1.80 1.03 5.82 33.38 2.51 8.15 1.12
9:04:01 31.27 3.18 1.05 10.17 33.38 2.11 6.73 1.12
9:09:01 31.31 2.04 1.05 6.53 33.96 2.65 8.47 1.14
9:14:01 31.19 1.48 1.05 4.73 33.38 2.19 7.02 1.12
9:19:01 30.99 1.44 1.04 4.63 33.76 2.77 8.94 1.13
9:24:01 30.77 1.47 1.03 4.79 33.00 2.23 7.26 1.11
9:29:01 31.16 1.56 1.04 5.00 33.56 2.40 7.71 1.13
9:34:01 31.33 1.55 1.05 4.95 33.90 2.57 8.22 1.14
9:39:01 31.45 1.51 1.05 4.81 33.78 2.33 7.40 1.13
9:44:01 31.31 1.64 1.05 5.24 33.94 2.63 8.39 1.14
9:49:01 31.18 1.52 1.05 4.86 33.72 2.54 8.16 1.13
9:54:01 31.13 1.68 1.04 5.40 33.16 2.03 6.52 1.11
TABLE 6:STATISTICAL MEASURES AND RELIABILITY INDICES FOR LINK 1002(FFTIME =50.40 SEC);PMPEAK Time
PM
Average
time (sec) Std. Dev.
% Variation
95th Percentile Time (sec)
Buffer
Time (sec) PTI BTI TTI
3:04:01 53.07 2.36 4.44 57.62 4.55 1.14 8.58 1.05
3:09:01 53.30 2.34 4.39 57.78 4.48 1.15 8.40 1.06
3:14:01 52.90 2.45 4.64 56.90 4.00 1.13 7.57 1.05
3:19:01 52.80 2.39 4.53 57.62 4.82 1.14 9.14 1.05
3:24:01 52.54 2.59 4.93 57.60 5.06 1.14 9.63 1.04
3:29:01 52.43 2.43 4.63 57.18 4.75 1.13 9.05 1.04
3:34:01 52.31 2.27 4.34 55.78 3.47 1.11 6.64 1.04
3:39:01 52.80 4.02 7.61 59.36 6.56 1.18 12.42 1.05
3:44:01 53.55 7.01 13.10 58.16 4.61 1.15 8.61 1.06
3:49:01 52.62 3.87 7.35 56.00 3.38 1.11 6.43 1.04
3:54:01 52.31 2.60 4.96 57.20 4.89 1.13 9.35 1.04
3:59:01 52.70 2.33 4.42 55.94 3.24 1.11 6.15 1.05
4:04:01 52.60 2.16 4.11 55.54 2.94 1.10 5.60 1.04
4:09:01 52.24 2.66 5.09 56.14 3.90 1.11 7.47 1.04
4:14:01 51.86 3.14 6.05 55.40 3.54 1.10 6.83 1.03
4:19:01 52.70 4.17 7.91 62.52 9.82 1.24 18.63 1.05
4:24:01 52.76 2.95 5.60 57.00 4.24 1.13 8.04 1.05
4:29:01 52.67 2.19 4.16 56.96 4.29 1.13 8.15 1.05
4:34:01 52.70 2.73 5.19 55.90 3.20 1.11 6.08 1.05
4:39:01 52.44 2.60 4.96 56.00 3.56 1.11 6.78 1.04
4:44:02 52.73 3.69 7.00 56.36 3.63 1.12 6.87 1.05
4:49:01 52.75 4.07 7.72 58.58 5.83 1.16 11.05 1.05
4:54:01 52.53 2.89 5.50 57.98 5.45 1.15 10.38 1.04
4:59:01 54.13 14.41 26.62 58.28 4.15 1.16 7.67 1.07
5:04:01 52.62 4.74 9.00 57.44 4.82 1.14 9.15 1.04
5:09:01 52.82 3.93 7.43 57.22 4.40 1.14 8.32 1.05
5:14:01 52.97 3.95 7.45 59.70 6.73 1.18 12.71 1.05
5:19:01 52.50 3.63 6.91 55.58 3.08 1.10 5.86 1.04
5:24:01 55.20 22.97 41.60 55.88 0.68 1.11 1.23 1.10
5:29:01 57.29 35.55 62.05 58.04 0.75 1.15 1.31 1.14
5:34:01 52.74 3.63 6.88 58.54 5.80 1.16 11.00 1.05
5:39:01 53.50 4.86 9.08 58.76 5.26 1.17 9.83 1.06
5:44:01 53.85 4.58 8.50 57.80 3.95 1.15 7.33 1.07
5:49:01 54.36 7.04 12.95 62.92 8.56 1.25 15.75 1.08
5:54:01 54.15 5.84 10.78 62.50 8.35 1.24 15.41 1.07
5:59:01 55.07 13.00 23.60 64.20 9.13 1.27 16.58 1.09
6:04:01 53.11 4.10 7.72 61.98 8.87 1.23 16.71 1.05
6:09:02 52.73 4.30 8.15 59.16 6.43 1.17 12.19 1.05
6:14:01 53.74 9.02 16.78 56.98 3.24 1.13 6.02 1.07
6:19:01 55.49 16.19 29.17 58.72 3.23 1.17 5.82 1.10
6:24:01 56.04 14.16 25.26 63.62 7.58 1.26 13.52 1.11
6:29:01 55.18 9.64 17.46 66.60 11.42 1.32 20.69 1.09
6:34:01 54.77 10.54 19.25 59.00 4.23 1.17 7.73 1.09
6:39:01 55.78 11.92 21.37 60.30 4.52 1.20 8.11 1.11
6:44:01 56.03 9.93 17.73 62.98 6.95 1.25 12.41 1.11
6:49:01 57.61 11.46 19.88 86.70 29.09 1.72 50.48 1.14
6:54:01 61.80 37.62 60.87 87.10 25.30 1.73 40.95 1.23
6:59:01 59.15 30.65 51.82 61.58 2.43 1.22 4.10 1.17
D. Effect of Accidents on Travel Time Reliability
From the ASAP data available for the study corridor over the study time period, incidents causing 2 or more lane closures were separated out as shown in the Table 7 and used for further analysis. Directions 1 and 2 have been used in ASAP report to indicate NB and SB directions, respectively. Using the mile post number and the date and time of the incident, the actual incident location was determined and variation of planning time index was explored to see the effect of incidents on travel time reliability.
TABLE 7:LIST OF INCIDENTS CAUSING 2 OR MORE LANE CLOSURES OVER THE STUDY PERIOD
Date Arrival Time Direction
Mile Number
Lanes Available
Lane Closed
Departure Time
2/3 17:45 1 260 4 2 17:58
2/9 8:33 1 253 3 3 8:40
2/24 17:10 1 259 3 2 18:02
3/11 8:33 1 260 5 3 9:15
3/25 9:10 1 259 1 2 9:42
3/25 7:04 1 255 3 2 7:27
3/25 9:00 1 258 3 2 9:45
4/5 15:41 2 259 3 1 15:46
4/5 16:48 2 259 3 1 16:50
4/5 15:01 2 255 3 3 16:01
4/20 8:10 1 259 5 2 8:30
4/20 7:30 1 260 2 3 8:30
4/21 14:57 2 259 3 2 16:22
4/21 15:19 2 259 3 3 16:35
V.
ANALYSIS AND RESULTS
A. Travel Time Indices for Links and Corridors
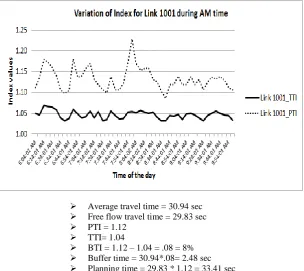
For the analysis of travel time reliability along the I-65 study corridor, three different indices were calculated for each one of the study links using three months of weekday travel time data, namely TTI, BTI, and PTI. As an example, the results for Link 1001 are shown in Fig. 1 and summarized below.
Average travel time = 30.94 sec Free flow travel time = 29.83 sec PTI = 1.12
TTI= 1.04
BTI = 1.12 – 1.04 = .08 = 8% Buffer time = 30.94*.08= 2.48 sec Planning time = 29.83 * 1.12 = 33.41 sec
It can be observed that at 7:49:01 AM link 1001 has a PTI of 1.1 and TTI of 1.04. The difference between these two is the buffer time index. From the above example it is clear that the planning time represents how much total time a traveller should allow for ensuring on-time arrival while buffer time shows the additional time that is necessary. Between BTI and PTI, the PTI measure is more advantageous as it can be directly compared with TTI which by definition is a measure of average congestion. Travel time indices were calculated for all NB and SB links and along the whole corridor for the AM and PM peak periods considered in this study and are summarized in Tables 8 through 11.
TABLE 8.TRAVEL TIME RELIABILITY RESULTS:NBI-65LINKS;AM PEAK PERIOD (6:00 TO 10:00AM)
Link No.
Link Description I-65N
FF Time)
(sec)
Mean TT (sec)
Std dev.
% Variation
95% Percentile
TT (sec) TTI
BTI
% PTI
1001 Walker Chapel Rd 29.83 31.20 1.91 6.13 33.81 1.05 8.37 1.13
1002 Walker Chapel Rd 50.4 53.61 4.87 9.08 59.02 1.06 10.03 1.17
1003 Highway 31 34.97 37.14 2.33 6.28 40.08 1.06 7.89 1.15
1004 Highway 31 69.4 77.16 6.30 8.17 84.33 1.10 9.29 1.21
1005 41st Ave 13.89 15.29 1.27 8.34 17.00 1.10 17.18 1.22
1006 41st Ave 25.2 31.30 6.73 21.51 35.09 1.24 12.26 1.39
1007 32nd Ave/ 33rd Ave 32.4 40.11 3.39 8.44 45.18 1.24 12.66 1.39 1008 32nd Ave/ 33rd Ave 15.43 19.61 1.79 9.12 22.20 1.27 13.19 1.44
1009 Finley Blvd 16.97 21.45 1.79 8.34 24.11 1.26 12.41 1.42
1010 Finley Blvd 23.14 28.39 2.16 7.62 31.74 1.23 11.81 1.37
1011 16th Street 13.37 16.09 1.26 7.82 18.05 1.20 12.17 1.35
1012 16th Street 15.94 19.55 1.37 7.01 21.75 1.23 11.25 1.36
1013 I-20/I-59 24.69 31.22 2.57 8.23 35.16 1.26 12.60 1.42
1014 I-20/I-59 12.34 18.15 6.11 33.68 27.82 1.47 44.62 2.25
1015 6th Ave 14.4 17.25 3.69 21.39 20.26 1.20 17.25 1.41
1016 6th Ave 3.6 4.82 1.29 26.76 6.03 1.34 23.78 1.67
1017 3rd Ave 10.8 13.68 3.46 25.29 17.12 1.27 23.76 1.59
1018 3rd Ave 22.11 30.23 10.95 30.23 39.16 1.37 28.20 1.77
1019 4th Ave 3.6 4.81 1.81 37.74 6.54 1.34 34.47 1.82
1020 4th Ave 4.63 6.75 2.63 38.90 9.20 1.46 34.42 1.99
1021 6th Ave 1.03 1.15 0.50 43.45 1.68 1.11 41.48 1.63
1022 Hwy 149/University
Blvd 14.91 19.91 7.87 39.55 26.01 1.34 29.08 1.74
1023 Hwy 149/ University
Blvd 39.6 59.54 24.41 41.00 91.89 1.50 50.24 2.32
1024 Green Springs Ave 22.63 32.85 17.92 54.54 54.12 1.45 57.31 2.39 1025 Green Springs Ave 49.89 68.42 22.61 33.04 95.68 1.37 37.57 1.92
1026 Oxmoor Road 28.8 39.64 15.65 39.48 57.24 1.38 40.75 1.98
1027 Oxmoor Road 31.89 45.96 15.99 34.80 68.00 1.44 45.82 2.13
1028 Lakeshore Drive 20.57 29.79 11.46 38.48 48.58 1.45 59.32 2.36 1029 Lakeshore Drive 48.86 67.00 18.11 27.03 102.41 1.37 49.93 2.10
1030 Alford Ave 27.77 42.17 14.71 34.87 64.81 1.52 50.82 2.33
1031 Alford Ave 74.06 122.19 50.92 41.67 188.80 1.65 52.42 2.54
1032 US-31 11.83 23.15 14.41 62.25 47.62 1.96 101.22 4.02
1033 US-31 55.03 96.15 51.04 53.09 181.25 1.75 81.61 3.29
1034 I-459 52.97 74.44 38.56 51.81 116.08 1.41 51.63 2.19
1035 I-459 54.00 67.47 15.80 23.42 89.67 1.25 31.74 1.66
1036 I-65N Shelby/ Jefferson
Co. Line 44.23 55.21 22.39 40.55 84.40 1.25 49.05 1.91
Along the corridor
Walker Rd to Shelby/
TABLE 9.TRAVEL TIME RELIABILITY RESULTS:SBI-65LINKS;AMPEAK (6:00 TO 10:00AM)
Consideration of the corridor wide results displayed on the last row of Tables 8 through 11 help one understand the magnitude of the travel time variability for each direction of traffic and for AM and PM. Such information is important to travellers who traverse the study section and who need to know how they can plan their trip to ensure on time arrival.
The findings revealed that the SB direction during the AM peak has the lowest average directional travel time (1,055 sec or 17.6 min) whereas the highest travel time is observed on the NB direction again during the AM peak (1,363 sec or 22.7 min). Consideration of index values, however, showed that the SB PM peak (average travel time=1,159 sec or 19.3 min) has the highest PTI value (PTI=2.42), indicating that the SB direction during PM peak experiences greater travel time variability than the NB during AM (PTI= 1.94) or PM peaks (PTI=1.55) or the SB in the AM peak period (PTI=1.86). As discussed earlier, some of the links in each direction were not considered due to data anomalies. In order for one to get actual indices for the whole corridor, data from those links must also be used.
Furthermore it is important to keep in mind that the greatest attractor of traffic during AM and the largest generator of traffic in the PM peak is the downtown Birmingham/UAB area which is situated roughly in the middle of the study corridor (just south of I-20/I-59). For this reason, commuters would be more interested in the travel time variability toward the downtown Birmingham area during AM peak period (from both SB and NB direction) and from the downtown toward residential areas in the north and south during the afternoon peak (rather than the total corridor NB and SB directions). Therefore it would be beneficial to determine travel time statistics and related indices for the subsections of the corridor consisting of the SB and NB links leading to downtown in AM peak and NB and SB links moving traffic out of the downtown area in the PM peak.
Link
No. Link Description FF Time (sec) Mean TT (sec) Std dev. % Variation 95% Percentile TT (sec)
TTI BTI
% PTI
1046 Walker Chapel Rd 38.06 40.45 8.09 20.00 43.41 1.06 7.59 1.14 1047 Walker Chapel Rd 65.83 74.76 28.08 37.56 84.12 1.14 11.82 1.28
1048 Highway 31 24.69 33.10 16.91 51.08 56.05 1.34 58.86 2.27
1049 Highway 31 73.54 110.54 58.79 53.18 180.15 1.50 56.63 2.45
1050 41st Ave 26.23 46.62 28.85 61.88 84.69 1.78 74.28 3.23
1051 41st Ave 13.37 23.00 10.73 46.65 37.06 1.72 55.47 2.77
1052 32nd Ave/ 33rd Ave 23.66 37.45 15.62 47.72 54.37 1.58 41.45 2.30 1053 32nd Ave/ 33rd Ave 15.94 23.39 1047 44.75 31.16 1.47 30.35 1.96
1054 Finley Blvd 19.03 27.56 14.25 51.70 34.31 1.45 22.76 1.80
1055 Finley Blvd 20.54 26.31 11.08 37.81 34.26 1.43 16.49 1.67
1056 16th Street 12.86 17.17 4.06 23.64 19.93 1.33 15.66 1.55
1057 16th Street 17.49 23.70 3.96 16.70 27.38 1.35 15.34 1.57
1058 I-20/I-59 26.23 35.63 8.11 22.75 41.92 1.36 17.59 1.59
1059 I-20/I-59 12.86 18.02 3.79 21.03 21.87 1.40 20.60 1.70
1060 6th Ave 13.37 17.39 3.41 19.61 20.34 1.30 16.72 1.52
1061 6th Ave 3.6 4.77 1.02 21.47 5.60 1.32 17.13 1.56
1062 3rd Ave 10.8 13.91 3.29 23.69 16.16 1.29 16.09 1.50
1063 3rd Ave 16.46 20.45 4.43 21.67 24.35 1.24 18.99 1.48
1064 4th Ave 6.17 8.11 1.66 20.50 9.46 1.32 16.48 1.53
1065 4th Ave 4.63 5.55 1.04 18.70 6.39 1.20 15.02 1.38
1066 6th Ave 4.63 5.13 0.81 15.90 5.79 1.11 12.97 1.25
1067 Hwy 149/
University
6.17 8.04 1.27 15.80 8.96 1.30 11.43 1.45
1069 Green Springs Ave 22.11 50.96 5.76 11.31 59.89 2.30 17.16 2.71
1071 Oxmoor Rd 27.26 59.57 6.31 10.59 70.23 2.18 17.82 2.58
1072 Oxmoor Rd 22.63 30.57 2.49 8.13 34.51 1.35 12.86 1.53
1073 Lakeshore Drive 16.46 26.57 3.05 11.49 30.45 1.61 14.56 1.85
1075 Alford Ave 25.2 72.39 5.86 8.09 82.01 2.87 13.28 3.25
1079 I-459 53.49 77.17 5.73 7.43 85 1.44 10.14 1.59
1080 I-459 54 57.73 3.60 6.24 63.74 1.07 10.40 1.18
1081 I-65N Shelby / Jefferson County
Line
41.65 59.45 3.64 6.11 65.35 1.43 9.92 1.57
Along the corridor
Walker Rd to Shelby/Jefferson
Co. Line
TABLE 10:TRAVEL TIME RELIABILITY RESULTS:NBI-65LINKS;PMPEAK (3:00 TO 7:00PM) Link No. Link Description I-65N FF Time (sec) Mean TT (sec) Std dev. % Variation 95% Percentile TT (sec)
TTI BTI PTI
1001 Walker Chapel Rd 29.83 32.55 9.24 28.37 38.06 1.09 14.89 1.28 1002 Walker Chapel Rd 50.4 53.83 7.66 14.22 59.73 1.07 10.81 1.19
1003 Highway 31 34.97 36.88 2.38 6.46 39.69 1.05 7.59 1.13
1004 Highway 31 69.94 77.31 5.51 7.13 83.89 1.11 8.50 1.20
1005 41st Ave 13.89 15.43 1.23 7.98 17.16 1.11 11.19 1.24
1006 41st Ave 25.2 31.31 3.17 10.11 35.53 1.24 13.47 1.41
1007 32nd Ave/ 33rd Ave 32.4 42.19 5.18 12.28 47.47 1.30 12.56 1.47 1008 32nd Ave/ 33rd Ave 15.43 21.52 3.82 17.75 24.93 1.39 15.89 1.62
1009 Finley Blvd 16.97 24.77 5.63 22.74 30.50 1.46 22.67 1.80
1010 Finley Blvd 23.14 33.84 7.18 21.23 45.12 1.46 32.08 1.95
1011 16th Street 13.37 19.93 5.53 27.75 28.12 1.49 38.95 2.10 1012 16th Street 15.94 25.03 8.58 34.25 38.02 1.57 47.51 2.39
1013 I-20/I-59 24.69 36.73 8.90 24.22 51.74 1.49 38.07 2.10
1014 I-20/I-59 12.34 18.12 5.30 29.23 23.82 1.47 30.22 1.93
1015 6th Ave 14.4 19.05 5.92 31.07 26.75 1.32 38.63 1.86
1016 6th Ave 3.6 5.22 1.70 32.52 7.08 1.45 34.28 1.97
1017 3rd Ave 10.8 14.79 4.44 30.01 20.78 1.37 38.91 1.92
1018 3rd Ave 22.11 31.17 10.20 32.72 44.30 1.41 39.68 2.00
1019 4th Ave 3.6 4.89 1.79 36.51 6.74 1.36 35.64 1.87
1020 4th Ave 4.63 6.74 2.20 32.67 9.08 1.46 32.79 1.96
1021 6th Ave 1.03 1.09 0.33 30.34 1.54 1.06 38.91 1.50
1022 Hwy 149/
University Blvd 14.91 19.15 4.87 25.44 24.27 1.28 25.62 1.63
1023 Hwy 149/
University Blvd 39.6 52 22.32 42.92 64.86 1.31 24.75 1.64 1024 Green Springs Ave 22.63 28.44 14.91 52.41 35.64 1.26 25.00 1.57 1025 Green Springs Ave 49.89 64.5 27.79 43.09 75.79 1.29 17.61 1.52
1026 Oxmoor Road 28.8 36.43 11.37 31.2 45.46 1.26 24.65 1.58
1027 Oxmoor Road 31.89 41.48 15.70 37.86 52.96 1.30 27.52 1.66
1028 Lakeshore Drive 20.57 25.69 10.55 41.06 33.97 1.25 30.68 1.65 1029 Lakeshore Drive 48.86 58.57 19.55 33.37 64.94 1.20 11.03 1.33
1030 Alford Ave 27.77 36.89 13.74 37.26 44.19 1.33 20.08 1.59
1031 Alford Ave 74.06 100.4 43.02 42.86 117.1 1.36 16.52 1.58
1032 US-31 11.83 14.57 8.18 56.14 16.67 1.23 14.22 1.41
1033 US-31 55.03 63.52 11.91 18.75 68.63 1.15 8.15 1.25
1034 I-459 52.97 60.44 4.26 7.05 66.72 1.14 10.35 1.26
1035 I-459 54 69.79 15.39 22.05 96.42 1.29 34.78 1.79
1036 I-65N Shelby/
Jefferson Co. Line 44.23 55.40 19.57 35.32 83.51 1.25 43.20 1.89
Along the corridor
Walker Rd to Shelby/Jefferson
Co. Line
1015.7 1279.66 1571.18 1.26 22.78 1.55
This analysis was undertaken and the results are presented in detail in [7]. In summary, when considering NB links 1001 to 1014 moving traffic north of downtown during the AM peak it was observed that the average travel time along this NB sub-corridor was 440.27 sec (7.34 min), or 16% higher than the free flow travel time of 378.5 sec (6.31 min). The TTI and PTI indices for this sub-corridor were low at 1.16 and 1.31 respectively which means that a traveller traversing this corridor would need less that an extra minute to secure on-time arrival. So this NB sub-corridor experienced no major traffic problems during the AM peak period.
TABLE 11:TRAVEL TIME RELIABILITY RESULTS;SBI-65LINKS;PMPEAK (3:00 TO 7:00PM) Link No. Link Description FF Time (sec) Mean TT (sec) Std dev. % Variation 95 Percentile TT
TTI BTI PTI
1046 Walker Chapel Rd
38.06 42.23 13.93 33.00 51.32 1.11 18.93 1.35
1047 Walker Chapel Rd
65.83 70.03 5.68 8.11 75.31 1.06 7.56 1.14
1048 Highway 31 24.69 26.17 1.62 6.18 28.71 1.06 9.70 1.16
1049 Highway 31 73.54 82.77 5.86 7.06 90.23 1.13 9.01 1.23
1050 41st Ave 26.23 31.78 3.06 9.62 36.09 1.21 13.59 1.38
1051 41st Ave 13.37 16.25 1.53 9.41 18.53 1.18 14.01 1.35
1052 32nd Ave/ 33rd Ave
23.66 28.87 2.13 7.39 32.19 1.22 11.51 1.36
1053 32nd Ave/ 33rd Ave
15.94 18.88 1.41 7.46 21.20 1.18 12.27 1.33
1054 Finley Blvd 19.03 22.87 1.87 8.19 25.82 1.43 12.91 1.36
1055 Finley Blvd 20.54 25.70 1.95 7.59 29.05 1.25 13.00 1.41
1056 16th Street 12.86 15.94 1.14 7.17 17.78 1.24 11.52 1.38
1057 16th Street 17.49 22.46 1.70 7.58 25.36 1.29 12.09 1.45
1058 I-20/I-59 26.23 37.31 19.95 53.47 47.70 1.42 26.40 1.82
1059 I-20/I-59 12.86 20.91 17.20 82.25 42.28 1.63 85 3.29
1060 6th Ave 13.37 16.75 20.78 124.1 52.57 1.74 103.2 3.93
1061 6th Ave 3.6 7.00 6.29 90.10 16.86 1.94 120.8 4.68
1062 3rd Ave 10.8 21.94 19.76 90.10 53.51 2.03 121.4 4.95
1063 3rd Ave 16.46 32.26 27.50 80.24 81.48 2.08 121.91 4.95
1064 4th Ave 6.17 14.60 11.16 76.46 32.82 2.37 112.7 5.32
1065 4th Ave 4.63 10.92 8.33 76.33 25.14 2.36 123.6 5.43
1066 6th Ave 4.63 9.75 6.75 69.28 21.74 2.11 115.9 4.70
1067 Hwy 149/
University Blvd 6.17 16.68 11.67 72.57 35.58 2.61 116.72 5.77 1069 Green Springs
Ave
22.11 79.17 38 48 135.52 3.58 66.93 6.13
1071 Oxmoor Rd 27.26 77.35 31.45 40.65 115.4 2.84 46.25 4.23
1072 Oxmoor Rd 22.63 41.46 16.86 40.67 64.37 1.83 52.86 2.84
1073 Lakeshore Drive 16.46 34.34 13.42 39.07 49.66 2.09 43.53 3.02
1075 Alford Ave 25.2 86.84 19.85 22.86 113.62 3.45 30.65 4.51
1079 I-459 53.49 83.22 21.39 25.70 109.9 1.56 29.62 2.06
1080 I-459 54 78.25 40.52 51.78 144.5 1.45 72.13 2.68
1081
I-65N Shelby / Jefferson Co.
Line
41.65 86.62 40.83 47.14 146.90 2.08 63.70 3.53
Along the corridor
Walker Rd to Shelby/Jefferson
Co. Line
718.96 1159.32 1741.14 1.61 50.19 2.42
Observation of the results for SB links 1046 to 1059 for AM peak period confirms a 37.7% increase in average travel time in the SB sub corridor extending from Walker Chapel to I-20/I-59 during AM peak when compared to free flow travel time. It should be noted that even though these links are on the southbound direction, they bring traffic to downtown area during the morning peak. The TTI and PTI indices are 1.38 and 1.92 respectively. This finding indicates great variability of travel time on the SB sub-corridor moving traffic toward downtown in the AM peak. In fact a traveller starting his trip at Walker Chapel Rd needs an average of 8.9 min to reach I-20/I-59 in downtown Birmingham but should allow a total of 12.5 min to ensure on-time arrival.
Also sub-corridor analysis results for the PM peak periods were performed. It can be observed that average travel times for all sub-corridors during the PM peak are 7.7 to 13.5% higher than the corresponding free flow travel times. However, when variability indices are considered, the PTI value for the SB sub-corridor (i.e., links 1060 through 1081) moving traffic from downtown to the suburbs in the afternoon is found to be 3.59, much higher than the PTI values for the three other sub-corridors that range from 1.39 to 1.49.
B. Variation of PTI and TTI in Study Links
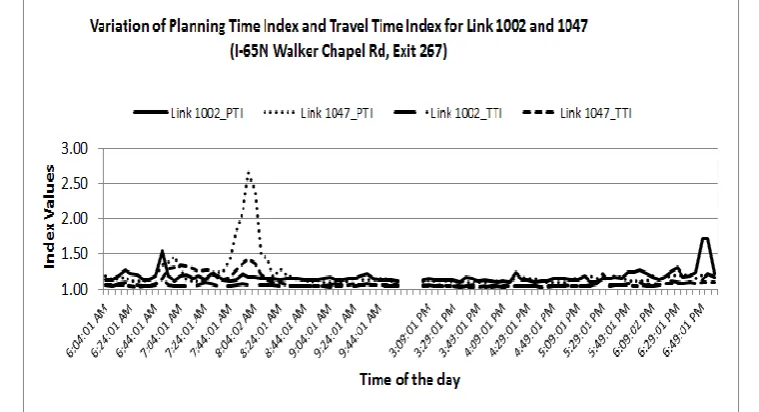
Using all available study data, a detailed analysis examined the variation of the travel time indices over time on a link-by-link basis. For demonstration purposes, results for links 1002 and 1047 are illustrated in Fig. 2, while a complete set results for all other links are available in [7].
Fig. 2 Variation of Planning Time Index and Travel Time Index for link 1002 (NB) and 1047 (SB) across the day
Observation of trends displayed in plots of PTI and TTI similar to that of Fig. 2 reveal the following findings for the study corridor:
In the Birmingham case study, travel time reliability appears to be closely associated with traffic demand/congestion as it is clearly evident on links that move traffic to and from the downtown area during the AM and PM peaks respectively.
Comparison of travel time reliability indices values show that PTI values are consistently greater than TTI values.
Among all SB links, links moving traffic toward the downtown (e.g. 1046 through 1057) experience greater travel time variability during the AM peak. Several SB links are in the south of the downtown area and many of them have high travel time variability in the PM peak (such as 1069 through 1075 and 1079 and 1080) as they move traffic toward the suburbs.
When considering NB I-65 links, those located between the I-459 and Alford Ave exits in Hoover (e.g., 1034, 1033,1032, 1031) show the highest travel time variability during the AM peak period, followed by links in Vestavia and Homewood (e.g. between link 1024 and 1031) that are also carrying traffic toward UAB and the downtown Birmingham. High travel time variability is also observed on the links north of I-20 during the PM peak (i.e., link 1013, 1012, 1011, 1010, and 1009).
Based on the number of links experiencing high levels of travel time variability (as expressed through the travel time indices), travel time reliability is considerably higher in the NB direction, compared to the SB direction during both peak periods considered.
The highest PTI values (ranging from over 8 to over 12) were observed during PM peak on the SB direction from I-20 to Oxmoor Rd exits (links 1058 through 1072). Other links registering PTI values in excess of 8 include 1014 (NB, AM), and 1072 (SB, PM). Links with high PTI values (often exceeding 6) include SB links 1050 (AM), 1051 (AM), 1071 (PM), 1080 (PM), and 1081 (PM), and NB links 1032 (AM) and 1033 (AM)
C. Variation of PTI along the Study Corridor
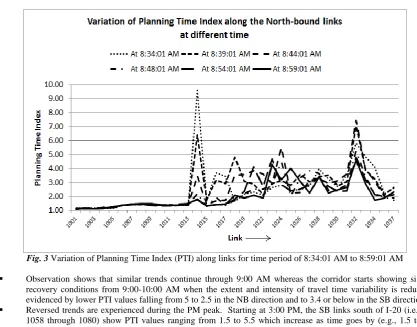
Also consideration was given to the variation of PTI across the study corridor and was used to examine the travel time variability over space and time. A sample plot displaying PTI variability for the entire corridor over a 30-min time period is illustrated in Fig. 3, while similar plots for remaining study links are available in [7].
The following points have been noted after considering graphs showing PTI variation along the corridor at different times for all study links:
During the early morning hours (6-7:30 AM) links at the ends of the study corridor that move traffic toward the downtown area in either direction experience the highest PTI values (ranging from 1.5-6.0).
As demand builds up (from 7:30-8:30 AM), travel time variability increases for the entire NB section of the study corridor extending from the Shelby/Jefferson County Line (link 1036) to I-20 in Birmingham (link 1013) with PTI values ranging from 1.5 to 7.5.
Fig. 3 Variation of Planning Time Index (PTI) along links for time period of 8:34:01 AM to 8:59:01 AM
Observation shows that similar trends continue through 9:00 AM whereas the corridor starts showing signs of recovery conditions from 9:00-10:00 AM when the extent and intensity of travel time variability is reduced as evidenced by lower PTI values falling from 5 to 2.5 in the NB direction and to 3.4 or below in the SB direction Reversed trends are experienced during the PM peak. Starting at 3:00 PM, the SB links south of I-20 (i.e., links
1058 through 1080) show PTI values ranging from 1.5 to 5.5 which increase as time goes by (e.g., 1.5 to 11.0 during the 4:00 to 4:30 PM period; and 1.5 to nearly 13 from 4:30-5:00 PM). PTI values observed in the NB direction during the same time periods are much lower, ranging from 1.0 to 3.0.
During the peak of the PM peak (5:00-6:00 PM), the PTI values for the above mentioned SB links vary from 1.5 to 11 where as for the NB links PTI values range from 1 to 4.8.
As the corridor starts to experience recovery conditions from 6:00 PM and on, PTI values drop and reach 1 to 4.5 in the SB direction and 1 to 3.2 in the NB by the end of the study period.
D. Effect of Traffic Accidents on Travel Time Reliability
Travel time reliability is likely affected both by recurrent and non-recurrent congestion. The latter is attributed to different incidents such as traffic accidents, disabled vehicles, planned event, road hazards, scheduled construction, unscheduled construction, weather etc. For this research, effects of traffic accidents on travel time reliability have been analysed in greater detail using ASAP data. As documented in the methodology chapter, accidents which caused two or more lane closures were considered in the analysis.
For facilitating comparison, data were plotted showing the travel time variation at incident links during accident dates vis-à-vis normal days. Only those time periods which were affected by the accidents were investigated. Moreover the variation of PTI values with and without accident presence are shown for analysing the effect of traffic accidents on PTI values. A sample plot is displayed in Fig. 4 and figures displaying similar information for remaining links are available in [7]. For easy reference, Table 12 summarizes the impacts of accident presence on link PTI values based on the analysis performed in this study.
Consideration of the results from the entire study corridor confirms the direct link between increased travel time due to accident presence and higher PTI value. In all cases, a noticeable increase in PTI values was observed under accident conditions ranging from 14% to over 170%. The typical increase of PTI value is from 25% to 83% and on an average this increment is 54.2%. The above observations conclude that the planning travel times of the study site should increase by over 50% to account for a possible traffic accident presence along a travel path.
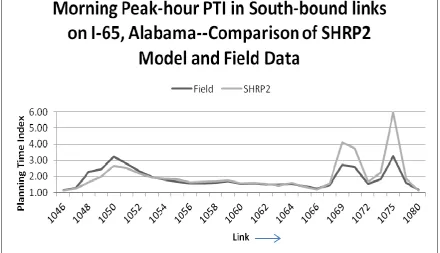
E. Comparison of Field Reliability Metrics with SHRP02 L03 Methodology
Reliability predictive models were proposed by the recently completed Strategic Highway Research Program 2 (SHRP2) L03 Project. The SHRP2 established these models using data from 164 detectors located in the Atlanta region. Two types of models were developed for urban freeways: (1) Simple models that predict reliability measures as a function of the mean TTI, and (2) More complex models that predict the mean and reliability measures as a function of demand, capacity, incident characteristics, and rainfall.
The simple reliability predictive model for links proposed is as follows:
Fig. 4 Variation of Travel Time and PTI along link 1073 with and without accident (Accident day: April 5 from 3:01 to 4:01 PM, and normal day: April 06)
TABLE 12.COMPARISON OF PTI VALUES WITH ACCIDENT AND WITHOUT ACCIDENT
Link PTI Values % Increase
without accident with accident
1017 1.75 3.00 71.43
1031 3.50 4.00 14.29
1022 2.50 4.00 60.00
1023 1.40 1.75 25.00
1018 1.75 4.75 171.43
1029 1.50 2.25 50.00
1025 2.50 4.00 60.00
1023 3.50 4.60 31.43
1073 4.25 5.50 29.41
1019 1.90 2.60 36.84
1022 2.25 3.60 60.00
1064 6.00 11.00 83.33
1065 7.00 11.00 57.14
1066 7.50 9.60 28.00
1067 8.00 10.75 34.38
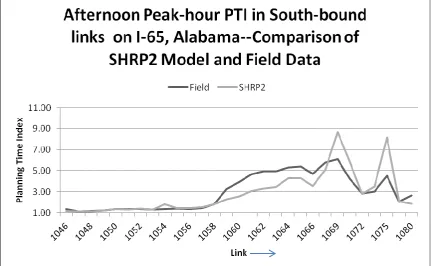
The calculated PTI data were compared with the PTI values calculated using mean TTI and equation (3) and results are shown in Fig. 5 through 8.
Fig. 5 Comparison of SHRP02 model and field data- NB links for AM peak (6 to 10 AM)
Fig. 7 Comparison of SHRP02 model and field data - NB links for PM peak (2 to 7PM)
Fig. 8 Comparison of SHRP02 model and field data - SB links for PM Peak (2 to 7PM)
VI.
CONCLUSIONS AND RECOMMENDATIONS
A. Findings from the Case Study
analysing the variation of reliability indices by link; along the entire corridor; as well as along four sub-corridors. The effect of traffic accidents on travel time reliability was also investigated.
The link-by-link analysis revealed that SB links that are moving traffic toward the city (e.g. 1046 through 1057) experience greater travel time variability during AM peak and those in the downtown area (e.g. links 1058 through 1067) show greater travel time variability during the PM peak. When considering NB links, it was found that links located between the I-459 and Alford Ave exits in Hoover (e.g., 1034, 1033, 1032, 1031) show the highest travel time variability during the AM peak, followed by links in Vestavia and Homewood (e.g. between link 1024 and 1031) that are also carrying traffic toward UAB and the downtown Birmingham. High travel time variability was also observed on the links north of I-20 during the PM peak (i.e., link 1013, 1012, 1011, 1010, and 1009).
From this study, travel time reliability appears to be closely associated to traffic demand/congestion as it is clearly more evident on links that move traffic to and from the down-town area during the AM and PM peaks respectively.
Also the variation of planning time indices across the study corridor was studied to examine travel time variability over space and time. It was concluded that travel time reliability was closely related to demand. For the AM peak, the PTI varied from 1.5 to 7.5 and for the PM peak from 1.5 to 11 with higher values observed under higher demands and in the commuting direction of traffic.
The sub-corridor analysis revealed that during the AM Peak, the NB sub-corridor moving traffic from the suburbs toward the down town experience far greater congestion than other sub-corridors and registered a PTI index value of 2.22. Great variability of travel time was observed on the SB sub-corridor moving traffic toward downtown in the AM peak where a PTI value of 1.92 was calculated.
The SB sub-corridor (from 6th Ave to Jefferson County Line) also experiences congestion during the morning peak time as the average time calculated for this sub-corridor is 517.8 sec (8.6 min) or 57.5% higher than the free flow travel time with a PTI index value of 1.79. This finding may indicate a reverse commute situation when drivers from downtown are travelling toward the suburbs on the south of Birmingham which also provide employment opportunities. During the PM peak, the SB sub-corridor extending from 6th Ave to I-65N Shelby/ Jefferson County Line exhibited the highest travel time variability. The PTI index value for this sub-corridor (i.e., links 1060 through 1081) was found to be 3.59. This was much higher than the PTI values for the three other sub-corridors that ranged from 1.39 to 1.49.
Given these findings it is recommended that local and state transportation agencies consider improvements and interventions at this sub-corridor to improve travel time reliability during the PM peak. This in turn will improve the afternoon commute of transportation users from downtown Birmingham to the suburbs.
The sub-corridor analysis conducted in this study further demonstrated the value of considering local conditions (here the location of downtown) when performing travel time reliability studies as the corridor-wide analyses may be unable to capture the true dynamics of traffic as well as a more detailed sub-corridor analysis does.
To study the effects of traffic accidents on travel time reliability, the data analysis focused on examining PTI variations with- and without accident presence. In all cases, a noticeable increase in PTI values was observed under incident conditions ranging from 14% to over 170%. The typical increase of PTI value was from 25% to 83% and, on average, this increment was 54.2%. It was concluded that the planning travel times should increase by over 50% to account for a possible traffic accident presence along a travel path.
Also an attempt was undertaken to compare field planning time index (PTI) with PTI values calculated using a model proposed by SHRP2 L03 project. For PM peak period, remarkably close values for field and model values were found along the NB links. For SB links the results were mixed with some links showing close comparisons and some not. Overall, the SHRP2 L03 methodology appears to be a useful tool to predict travel time reliability in freeway corridor, in the absence of field data.
B. Recommendations for Future Study
While many useful findings resulted from this analysis, the study has some limitations. First, only three months of travel time data were used in the analysis. Reliability measures for the study corridor would be more accurate if longer periods of data were considered. It is recommended that further studies be conducted with longer periods of travel time data to improve the accuracy of reliability measures for the I-65 corridor. Also this study focused only on the effects of traffic accidents on travel time reliability. Further studies should be conducted to determine the effect of other incidents such as severe weather conditions, planned lane closures, and special events. Furthermore, additional corridors can be analysed in the future to evaluate the consistency of findings. Additional experimentation sites would allow for further refinement of the SHRP2 L03 methodology which is recommended in follow up studies in order to allow its use as a reliable predictive method in the future.
REFERENCES
[1]. Bell, M.G.H. and Iida, Y., Network Reliability of Transport. Proceedings of the 1st International Symposium on Transportation Network Reliability (INSTR), Oxford, Elsevier Science, 2003.
[2]. Bertini R.L. and Lyman, K., Developing Improved Travel Time Reliability Measures for Real-Time and Archives ITS Data Applications. ITS Europe, Aalborg, Denmark, 2007.
[3]. Cambridge Systematics, Analytical Procedures for Determining the Impacts of Reliability Mitigation Strategies. Final Report, SHRP-L03 project, NCHRP, Washington, D.C., 2009.
[4]. Chen, C., Skabardonis A., and Varaiya, P. Travel Time Reliability as a Measure of Service. 82nd Annual Meeting of the Transportation Research Board, Washington D.C., 2002.
[6]. Hojati, A.T., Ferreira, L., and Charles, P., Assessing the Major Causes of Travel Time Reliability on Urban Freeways. 32nd Australasian Transport Research Forum (ATRF), Auckland, New Zealand, 2009.
[7]. Islam, S. M. Travel Time Reliability Under Varying Freeway Conditions, M.S. Thesis, University of Alabama at Birmingham, Birmingham, Alabama, 2012.
[8]. Lomax, T. et al., Selecting Travel Reliability Measures. Publication: TTI with Cambridge Systems, Inc., 2003. [9]. Lyman, K. and Bertini, R.L., Using Travel Time Reliability to Improve Regional Transportation Planning and
Operations. 87th Annual Meeting of the Transportation Research Board, Washington D.C., 2008.
[10]. Susilawati, S., Taylor, M.A.P., and Somenahalli, S.V.C, Travel Time Reliability Measurement for Selected Corridors in the Adelaide Metropolitan Area, Journal of the Eastern Asia Society for Transportation Studies, Vol. 8, 2010.
[11]. Tu, H., Lint, H.V., and Zuylen, H.V., The Effects of Traffic Accidents on Travel Time Reliability, Proceedings of the 11th International IEEE, Conference on ITE, Beijing, China, 2008.
[12]. Tu, H., Lint, H.V., and Zuylen, H.V., The Impact of Adverse Weather on Travel Time Variability of Freeway Corridor, 80th Annual Meeting of the Transportation Research Board, Washington, D.C., 2007.