Patron: Her Majesty The Queen Rothamsted Research Harpenden, Herts, AL5 2JQ
Telephone: +44 (0)1582 763133 Web: http://www.rothamsted.ac.uk/
Rothamsted Research is a Company Limited by Guarantee
Rothamsted Repository Download
A - Papers appearing in refereed journals
Zhu, W., Li, H.J., Qu, H.C., Wang, Y.L., Misselbrook, T., Li, X. and Jiang,
R. 2018. Water stress in maize production in the drylands of the Loess
Plateau. Vadose Zone Journal. 17 (1).
The publisher's version can be accessed at:
•
https://dx.doi.org/10.2136/vzj2018.06.0117
The output can be accessed at: https://repository.rothamsted.ac.uk/item/8w892.
© 20 December 2018. Licensed under the Creative Commons CC BY-NC-ND.
Water Stress in Maize Production
in the Drylands of the Loess Plateau
Wei Zhu, Huijie Li, Hongchao Qu, Yilin Wang,
Tom Misselbrook, Xiao Li, and Rui Jiang*
Water stress during two maize (Zea mays L.) growing seasons (2013 and 2014) was investigated in a semiarid region of northwest China. The HYDRUS-1D model gave good simulation of the soil water content in different layers throughout a 0- to 200-cm depth during the maize growing season, with R2 values of 70.6 and 77.0%
for the calibration and validation periods, respectively. Water stress for maize pro-duction was observed in June of 2013 and in July of 2014. The soil water storage (SWS) decreased significantly during the early stage of the maize growing season, especially in 2014. The root depth and crop height were 20 cm deeper and 100 cm higher, respectively, in 2014 than in 2013 at the early stage. These results suggest that in the early stage of the maize growing season, pre-seeding SWS can alleviate crop water stress effectively via deep roots. Model simulation showed that the plow pan layer (at a depth of 20–40 cm), with high soil bulk density and a lower soil water retention curve, significantly reduced infiltration. High evapotranspiration and low precipitation result in a temporary dry layer during the early stage, highlighting the plow pan as the sensitive layer for water stress during the drought period. Effective management practices such as deep plowing, plastic film mulching, or water con-servation treatments in the fallow period are needed to avoid the formation of this temporary dry layer during the drought period at the early stage and thus improve maize production in rainfed agriculture on the Loess Plateau of China.
Abbreviations: ET, evapotranspiration; LAI, leaf area index; RT, root uptake; SWS, soil water storage.
Soil water
is a limiting factor for crop production, particularly in the rainfed agriculture on the Loess Plateau of China (Zhang et al., 2016; Hu et al., 2009), where rainfall is the only resource to supplement the soil moisture. Soil water, especially in the upper soil layer, plays a key role in controlling water and energy fluxes in the soil profile (Vereecken et al., 2007). It affects the partitioning of precipitation into runoff and infiltration and controls the redistribution of rainwater and the availability of water to crops. Thus, soil water is related to processes such as soil evaporation, plant transpiration, runoff, and percolation. These processes are controlled by factors including climate, vegetation, topography, and soil properties. A good understanding of soil water processes during the crop growing season and their influencing factors is therefore important to manage the water resources effectively and improve crop yields in rainfed agricultural regions.The Loess Plateau of China is an area with high soil evaporation losses and large inter-annual rainfall variations. Limited precipitation and high evaporation often result in low crop yields. Porporato et al. (2004) indicated that plant productivity and water stress are strongly influenced by the unpredictability of soil moisture dynamics as affected by climatic variability and variation in the frequency and amount of rainfall. Water stress typically occurs from April to June for maize in the Loess Plateau, where the maize growing season spans from the end of April to September, and 50 to 60% of the annual precipitation occurs between July and September. Drought in April to June often results in poor maize estab-lishment (Liu et al., 2009). Jiang et al. (2016) found that the lower maize yield related to water stress is due to the plow pan (30–60 cm), which would temporarily become a dry layer during the drought period and significantly affect maize production. It could be hypothe-sized that the dry layer (plow pan layer) limits transport of the deeper soil water to the upper layers, causing water stress in the establishment and early season growth period and thereby
Core Ideas
• HYDRUS-1D was successfully used to simulate the change in soil water in a 0–200-cm soil profile.
• We quantified the process of soil water balance in detail during the maize growing season.
• This study indicated the plow pan’s effect on soil water storage.
W. Zhu, H.J. Li, H.C. Qu, Y.L. Wang, X. Li, and R. Jiang, College of Natural Resources and Environment, Northwest A&F Univ., Yan-gling 712100, China; T. Misselbrook and R. Jiang, Sustainable Agricultural Science Dep., Rothamsted Research, North Wyke, Okehampton, Devon, EX20 2SB, UK; X. Li, Zhongshan Torch Polytechnic, Zhongshan, Guangdong 528436, China. *Corresponding author (jiangrui@nwsuaf.edu.cn).
Received 9 June 2018. Accepted 13 Nov. 2018. Supplemental material online.
Citation: Zhu, W., H. Li, H. Qu, Y. Wang, T. Misselbrook, X. Li, and R. Jiang. 2018. Appli-cation of HYDRUS-1D for simulating water balance and implications for water stress in maize production in the drylands of the Loess Plateau. Vadose Zone J. 17:180117. doi:10.2136/vzj2018.06.0117
Special Section: Advancing Soil Physics for Securing Food, Water, Soil and Ecosystem Services
© Soil Science Society of America.
This is an open access article distributed under the CC BY-NC-ND license
(http://creativecommons.org/licenses/by-nc-nd/4.0/).
limiting maize yield. The Loess soil is very deep, and generally the soil water stored in deeper soil layers can supply plant water require-ments in periods of no rainfall. This supplementation of water for plant use from the deep soil layers has been proven by observations in many studies of a gradual depletion of soil water at the 2- to 3-m soil depth after years of intensive farming in croplands (Li et al., 2010; Wang et al., 2004). To prove our hypothesis regarding the disruptive role of a plow pan layer, studies of the water processes in a soil profile including a plow pan layer are required to develop an understanding of how it influences the soil water balance.
Precipitation, runoff, evapotranspiration (ET), and soil water storage (SWS) are the key components for the soil water balance equation, and accurate monitoring or estimation of each compo-nent is important for the calculation. Li et al. (1985) reported that a soil depth of no less than 2 m should be used for ET estimation for annual field crops (i.e., winter wheat [Triticum aestivum L.], maize, sorghum [Sorghum bicolor (L.) Moench] and cotton [Gossypium hirsutum L.]) in the Loess Plateau area. However, many studies have considered only the topsoil layer (usually the upper 20 cm) (Kachanoski et al., 1988; Goovaerts and Chiang, 1993; Famiglietti et al., 1998; Gómez-Plaza et al., 2000; Cosh et al., 2008; Schneider et al., 2008; Hu et al., 2009) or have focused on the 0- to 1-m soil profile (Kachanoski and de Jong, 1988; Comegna and Basile, 1994; Hupet and Vanclooster, 2002; Martínez-Fernández and Ceballos, 2003; Starks et al., 2006; Hu et al., 2011) because soil water profile measurement is labor intensive, expensive, and time consuming. A few studies have investigated ET from the soil profile deeper than 1 m (Kamgar et al., 1993; Tallon, 2004; Hu et al., 2010), but they considered the soil profile as a homogeneous soil layer. In fact, in the Loess soil throughout this depth, the bulk density and soil porosity may vary, influencing soil water movement, evaporation, and thus the water balance. There is a need therefore, to consider the water balance to a depth of at least 2 m and to assess the soil water processes in different soil layers for rainfed agriculture in the Loess soil region.
Modeling is a good way to simulate the soil water balance, and different models for soil moisture dynamics have been used to capture the essential features of the water cycle and the result-ing vegetation response, includresult-ing APSIM (Asseng et al., 1998; Probert et al., 1998; Stewart et al., 2006), EPIC (Rosenberg et al., 1992; Bryant et al., 1992; Li et al., 2004), HYDRUS (Moran et al., 2004; Šimůnek et al., 2008; Tan et al., 2014), LEACHM (Ramos and Carbonell, 1991; Smith et al., 1995; Roy et al., 2000), SWAP (Kroes et al., 2000), and DSSAT (Jones et al., 2003; Sau et al., 2004). HYDRUS-1D has been widely used to analyze water movement in unsaturated, partially saturated, or fully saturated homogeneous lay-ered media (Šimůnek et al., 2008), including several applications on the Loess Plateau of China. Fan et al. (2016) simulated infiltration characteristics of soil with interlayers by using HYDRUS-1D. Cao and Gong (2003) successfully simulated soil water transport under winter wheat using HYDRUS. Wu and Huang (2011) showed, using HYDRUS-1D, that the root water uptake rate under various condi-tions remained constant until the soil water content decreased below
a critical value and then declined variably according to conditions with further soil moisture depletion. HYDRUS-1D includes a dis-tinction of soil hydraulic properties for different soil layers (Carsel and Parrish, 1988) based on profile information and therefore has the potential to simulate the soil water balance accurately on the Loess Plateau by considering the different soil layers.
With the overall aim to quantify the soil water balance for improving maize production in the semiarid regions of the Loess Plateau, the specific objectives of this study were to: (i) simulate the soil water content associated with different soil layers using HYDRUS-1D; (ii) calculate a water balance for maize production in this region; and (iii) investigate the role of the plow plan layer in water stress during maize production.
6
Materials and Methods
Study Site
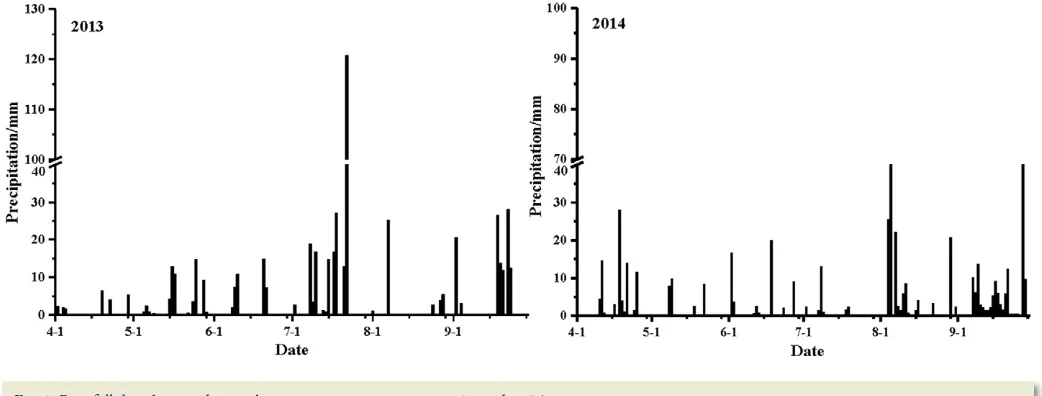
The study was conducted in 2013 to 2014 at the Changwu Agricultural and Ecological Experimental Station (35°12¢ N, 107°40¢ E, 940–1220 m asl) on the Loess Plateau of northwestern China. It has a warm, temperate, semi-humid, continental monsoon climate. The annual mean air temperature is 9.2°C, and the average annual rainfall is 582 mm, with 73% of the annual rainfall occur-ring duoccur-ring the maize growing season based on 53 yr of climate data (Wu et al., 2012). The rainfall during 2013 and 2014 was 519 and 521 mm, with 495 and 334 mm during the maize growing season, respectively (Fig. 1). The main cropping system in this area consists of one crop of maize or wheat per year. According to the Chinese Soil Taxonomy, the soils at this site are Cumuli-Ustic Isohumosols (Gong et al., 2007). The soil properties in the top 20 cm are as fol-lows: bulk density, 1.30 g cm−3; pH 8.4; organic matter, 16.40 g kg−1;
total N, 1.05 g kg−1; available P (Olsen-P), 20.70 mg kg−1;
avail-able K (NH4OAc-extractable K), 133.10 mg kg−1; and mineral N,
28.80 mg kg−1.
Field Experiment and Monitoring
Traditional (flat) cultivation was conducted during the maize growing season in this study. The cultivation consisted in alternating wide (60 cm) and narrow (40 cm) row spacings. The plant spacing within rows was 30 cm, giving a plant density
of 67,000 plants ha−1, similar to that of local farms. The
recom-mended N fertilizer rate of 180 kg N ha−1 was applied, using urea
(46% N); 70% of the N fertilizer was distributed manually over the soil surface prior to sowing and then plowed into the subsur-face as a basal dressing. The remaining 30% of the fertilizer was applied during the silking stage using a hole-sowing machine following precipitation. A total of 60 kg P ha−1 as calcium
super-phosphate (12% P2O5) and 75 kg K ha−1 as potassium sulfate
Field data were collected for two maize growing seasons (30 Apr.–30 Sept. 2013 and 30 Apr.–21 Sept. 2014). In 2013, the soil moisture (volumetric water content) and temperature were measured at 1-h intervals using an ECH2O system (Decagon Devices). Each ECH2O system consisted of five ECH2O-TE sensors, which were installed at soil depths of 10, 30, 60, 100, and 160 cm, representing measurement depths of 0 to 20, 20 to 40, 40 to 80, 80 to 120, and 120 to 200 cm. In addition, the soil moisture content of two replicates was determined gravimetri-cally at the same measured depths at 15-d intervals using a soil auger. In 2014, due to accidental damage to the ECH2O system, soil water content was measured using a neutron moisture meter (CNC503DR) every 15 or 30 d at the same measurement depths as in 2013. The soil water content at depths of 10 and 30 cm was also determined gravimetrically using a soil auger. Thus, the ECH2O-TE sensor and neutron moisture meter (CNC503DR) were calibrated against gravimetrically measured soil water con-tents in this study.
At the beginning of the experiment, undisturbed soil sam-ples (diameter 5 cm, height 5 cm) from the five representative layers were collected for laboratory measurement of soil bulk density, texture, saturated hydraulic conductivity (Ks), and satu-rated water content (qs). The bulk density was calculated from the volume–mass relationship for each core sample. Soil texture was determined using the pipette sampling method (Gee and Or, 2002). Values of Ks of the undisturbed soil cores were determined using the falling-head method (Klute and Dirksen, 1986). The soil cores were first saturated from the bottom and then submerged in water for 24 h. After weighing, the saturated soil samples were dried at 105°C to constant mass, and their mass-based saturated soil water content was determined. Values of qs were determined by multiplying the saturated mass-based soil water content by the bulk density. Root depth was measured by digging a soil profile at different maize growing stages, and crop height and leaf area index (LAI) were measured at the same time.
Description of the HYDRUS-1D Model
Soil Water Flow
One-dimensional uniform (equilibrium) water movement in a partially saturated rigid porous medium is described by a modified form of the Richards equation using the assumptions that the air phase plays an insignificant role in the liquid flow process and that water flow due to thermal gradients can be neglected:
cos
h
K S
t x x
é æ öù
¶q= ¶ ê ç¶ + a -÷ú ÷
ç ÷
ç
ê è øú
¶ ¶ ë ¶ û [1]
where h is the water pressure head (cm), q is the volumetric water content (cm3 cm−3), t is the length of the period (d), x is the spatial
coordinate (cm, positive upward), S is a sink term (cm3 cm−3 d−1),
a is the angle between the flow direction and the vertical axis (i.e.,
a = 0° for vertical flow, 90 ° for horizontal flow, and 0° < a < 90°
for inclined flow), and K is the unsaturated hydraulic conductivity function (cm d−1) given by
( , ) s( ) (r , )
K h x =K x K h x [2]
where Kr is the relative hydraulic conductivity (dimensionless) and
Ks is the saturated hydraulic conductivity (cm d−1).
Evapotranspiration
Potential evapotranspiration is calculated in HYDRUS-1D using the FAO recommended Penman–Monteith combination equation for evapotranspiration:
( )
(
)
( )
(
)
p d n
0
c c
1 ET
1 1
c e e r
R G
r r r r
a a
a a
é D - r - ù
ê ú
= ê + ú
l D+ g +êë D+ g + úû [3]
where ET0 is referenceevapotranspiration, including evaporation and transpiration (mm d−1), which is regarded as potential
evapotranspiration (ETp) in HYDRUS according to Allen (2011);
l is the latent heat of vaporization (MJ kg−1); R
n is net radiation (MJ
m−2 d−1); G is the soil heat flux (MJ m−2 d−1) [G = c
sds(T2 − T1)/Dt,
T1 is the temperature at the beginning of the period considered (°C),
cs is the soil heat capacity (1.007 MJ m−3°C−1 for the gray calcareous
soil on the Chinese Loess Plateau), and ds is the estimated effective soil depth]; r is atmospheric density (kg m−3); c
p is the specific
heat of moist soil (i.e., 1.013 kJ kg−1°C−1); e
a is the saturated vapor pressure at temperature T (kPa); ed is the actual water vapor pressure (kPa); rc is the crop canopy resistance, i.e., the “bulk” surface resistance describing the resistance of vapor flow through the transpiring crop and evaporating soil surface (s m−1) (Kelliher et al.,
1993); ra is aerodynamic resistance, the impedance when the water vapor from the evaporation mixes with the air above the canopy (s m−1) (Shuttleworth, 1989); D is the slope of the vapor pressure
curve (kPa °C−1) [D = 4098e
a/(T + 237.3)2, where T is the average
air temperature ( °C)]; g is the psychometric constant (kPa °C−1)
(g = 0.00163P/l, where P is the atmospheric pressure [kPa], and l
is the latent heat [MJ kg−1]).
Potential evaporation and transpiration fluxes can also be cal-culated from potential evapotranspiration using Beer’s law that partitions the solar radiation component of the energy budget via interception by the canopy (Ritchie 1972) as
( )
p ET 1 expp LAI ET SCFp
T = éë - -k ùû= [4]
( ) ( )
p ET expp LAI ET 1 SCFp
E = -k = - [5]
where Tp and Ep are potential transpiration and evaporation fluxes (mm d−1), respectively; LAI is the leaf area index; SCF is the soil
cover fraction, given as 1 − exp(−kLAI), and k is a constant gov-erning the radiation extinction by the canopy as a function of the sun angle, the distribution of plants, and the arrangement of leaves (default value: 0.463).
Root Water Uptake
The sink term, S, is defined as the volume of water removed from a unit volume of soil per unit time due to root water uptake and can be calculated according to (Šimůnek and Hopmans, 2009)
( , , , ,) ( ) ( )p ,
S h x t =a h x t S x t [6]
where
( ) ( ) ( )
p , , p
S x t =b x t T t [7]
and a(h,x,t) is a prescribed dimensionless water stress coefficient of root water uptake (0 £a£ 1), which can calculated based on the soil water pressure head (Feddes et al., 1978); Tp is the potential transpiration rate (cm d−1); b(x,t) is the normalized root
distri-bution [the integration of b(x,t) over the root zone is 1], which regulates the Tp allocation along the soil profile:
( ) ( ) ( ) r r r r r r
1.667 0.2
2.0833 1
, ; 0.2
0
r
x L L
L
L x L
b x t x L L L L
L
x L L
ìïï >
-ïï ïï ï é - - ù ï ë û ï =íï Î - -ïï
ï <
-ïï ïï ïî
[8]
where Lr is the maximum root depth at t (cm), and L is the x coor-dinate from the soil surface.
The actual transpiration rate, Ta (cm d−1), is obtained by
inte-grating S over the root zone Lr:
( ) ( ) ( )
r r
a L , , d p L h, , , d
T =
ò
S h x t x T=ò
a x t b x t x [9]Boundary Conditions
The upper boundary condition was set as the atmospheric boundary condition with surface runoff, which allowed surface runoff when precipitation exceeded infiltration capacity. Soil evaporation at the surface was controlled by the pressure head at the soil surface:
( )
a h cos a
E K h h
x æ¶ ö÷ ç
=- ççè¶ + a÷÷ø £ [10]
( )
a p a
E =E h h> [11]
where ha can be calculated from the air humidity, Hr, as
( )
a RTln r
h H
Mg
= [12]
where M is the molecular weight of water (M mol−1) (= 0.018015
kg mol−1), g is gravitational acceleration [L T−2], (= 9.81 m s−2),
and R is the gas constant (J mol−1 K−1) (= 8.314 J mol−1 K−1).
The lower boundary condition was set as free drainage. The rate q(n) at which the bottom node n decreases is determined by the program as
( ) ( )
q n =-K h [13]
where h is the local value of the pressure head at the bottom of the profile, and K(h) is the hydraulic conductivity corresponding to this pressure head.
Model Setting
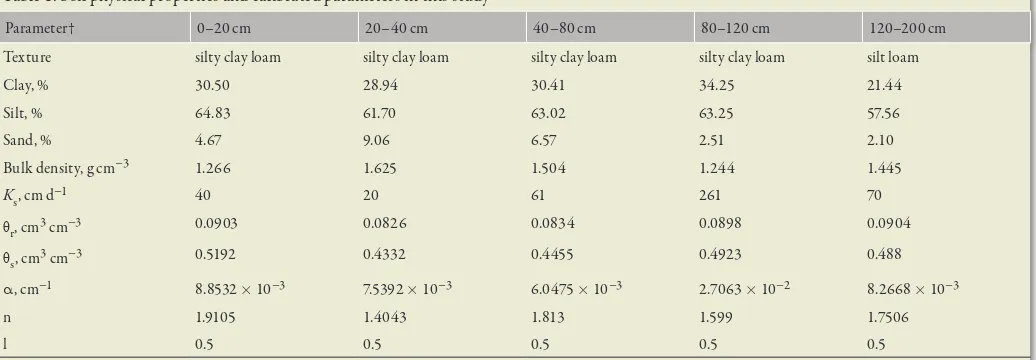
The initial hydraulic parameters required in the model were measured or estimated from soil texture, bulk density, and hydrau-lic conductivity (Table 1) using the RETC software (Schaap et al., 2001). A higher Ks value was observed in the 80- to 120-cm layer, which was the tillage layer before the new loess soil layer was deposited, and there were some macropores in this layer.
Model Calibration and Validation
(RMSE), coefficient of determination (R2), and Nash–Sutcliffe
modeling efficiency (NSE) (Nash and Sutcliffe, 1970).
Calculation of Water Balance
Precipitation (P) was considered as the only source of input water in this study. The input is balanced out either through runoff (R) or through the net change in soil water storage (DSWS). According to water balance models for the Loess Plateau (Zhao et
al., 2004), changes in soil water storage (DSWS) are controlled by precipitation, evaporation from the soil surface (Es), and transpira-tion from the crop (Tp). Runoff was not considered in this study (the study plots were surrounded by a 5-mm ridge). The soil water balance in the root zone (2 m) is given as
s p
SWS P E T
D = - - [14]
6
Results
Simulation of Soil Water Contents
in Different Soil Layers
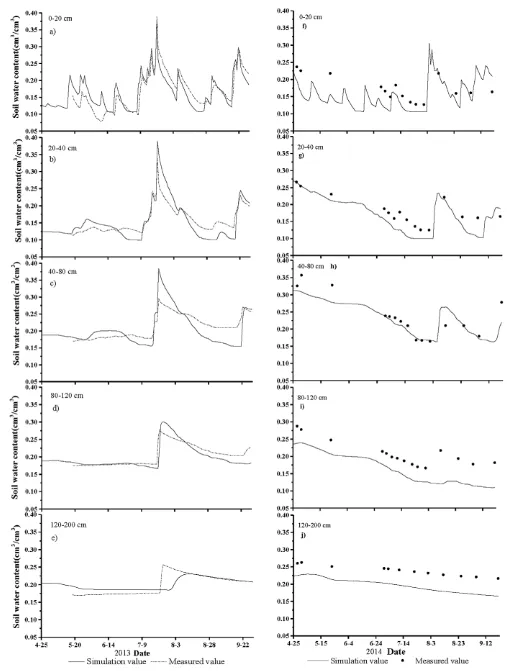
Simulated and measured soil water contents for the different soil layers during the calibration and validation periods are presented in Fig. 2. There was good agreement between simulated and measured soil water contents, as indicated by the small RMSE (0.025 for 2013 and 0.002 for 2014), high R2 values (70.6% for 2013 and 77.0% for
2014) and NSE (0.64 for 2013 and 0.80 for 2014). HYDRUS-1D simulated the topsoil layers better than the deeper soil layers, soil water content was underestimated in the 80- to 200-cm soil layer during both the calibration and validation periods (Fig. 2i, 2e, and 2j). There was also a time lag in the model simulation in the deepest soil
layer for the soil water peak during a period of high rainfall (Fig. 2e).
Temporal Analysis of Soil Water Storage
for Different Soil Layers
Climatic factors, soil water uptake by roots, and the anteced-ent soil moisture before sowing (initial SWS) were the main factors
influencing the change in SWS in different layers during 2013 and 2014. The SWS in 2013 was higher than that in 2014 for deeper soil layers (40–200 cm) during the late stage of the maize growing season because of the higher rainfall. The soil water con-sumption was much higher during the early stage of the maize growing season in 2014 than in 2013 due to the higher initial SWS (higher by about 167 mm) in 2014 (Table 2).
Water supply and water consumption during the maize grow-ing season in 2013 and 2014 are given in Table 2. The water supply in 2013 was mainly from the 0- to 80-cm soil layers, and the layers deeper than 80 cm maintained a balance across the whole growing season. In 2014, however, water consumption during the maize growing season occurred from the 20- to 200-cm soil layers, while the deeper soil layers (80–200 cm) showed larger water loss than in 2013. The difference in SWS for the deeper soil layers (120–200 cm) between 2013 and 2014 was significant during the period from June to harvest, which was probably because of the deep infiltra-tion during the large rainfall event and less deeper soil evaporainfiltra-tion during the dry period in 2013.
Evapotranspiration, Root Water Uptake,
and Crop Growth
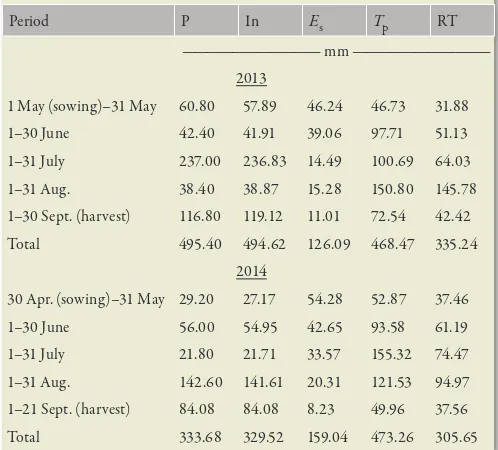
The variation in ET was mainly controlled by the variation in Es at the beginning of the maize growing season and by Tp
when the canopy cover increased (Table 3). In 2013, ET was 583 mm, with Es and Tp accounting for 21 and 79%, respectively— lower than that in 2014 (631 mm) due to the larger Es in 2014 (Table 3). The maximum ET was about 7.5 and 8.8 mm d−1,
and the maximum Tp was 6.8 and 7.5 mm d−1 during 2013 and
2014, respectively.
Monthly infiltration was approximately equal to precipitation (Table 3). Rainfall during the maize growing season was much greater in 2013 than in 2014, with the largest amount occurring in July and September during 2013 and in August during 2014. The
Tp during July and August accounted for 54 and 58% of that for the whole growing season in 2013 and 2014, respectively.
Table 1. Soil physical properties and calibrated parameters in this study
Parameter† 0–20 cm 20–40 cm 40–80 cm 80–120 cm 120–200 cm Texture silty clay loam silty clay loam silty clay loam silty clay loam silt loam
Clay, % 30.50 28.94 30.41 34.25 21.44
Silt, % 64.83 61.70 63.02 63.25 57.56
Sand, % 4.67 9.06 6.57 2.51 2.10
Bulk density, g cm−3 1.266 1.625 1.504 1.244 1.445
Ks, cm d−1 40 20 61 261 70
qr, cm3 cm−3 0.0903 0.0826 0.0834 0.0898 0.0904
qs, cm3 cm−3 0.5192 0.4332 0.4455 0.4923 0.488
a, cm−1 8.8532 ´ 10−3 7.5392 ´ 10−3 6.0475 ´ 10−3 2.7063 ´ 10−2 8.2668 ´ 10−3
n 1.9105 1.4043 1.813 1.599 1.7506
l 0.5 0.5 0.5 0.5 0.5
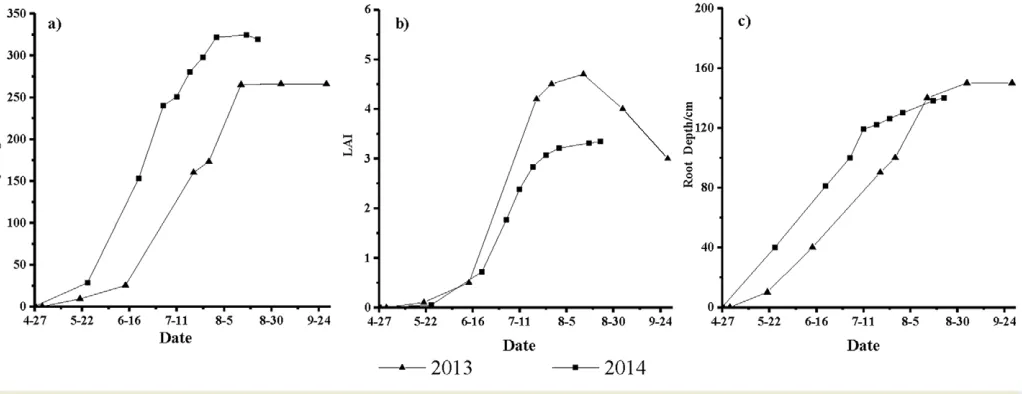
Root uptake (RT) during 2013 and 2014 was 335 and 306 mm, respectively, with the maximum daily RT occurring at the jointing stage (5 and 19 August, respectively). The physical proper-ties of the maize showed that the maximum crop height in 2014 was higher than that in 2013, with crop height being greater in 2014 throughout the growing season. The maximum LAI values were 4.7 and 3.3 in 2013 and 2014, respectively, and the crop roots grew to depth faster in 2014, being approximately 20 cm longer than in 2013 during the early stage of the maize growing season (Fig. 3). Temporal variability in crop height, LAI, and root depth were significantly different (p < 0.001, paired-sample t-test) between the 2 yr. The RT was greatest in August for both years (Table 3) and was greater during the early growing season (May– July) in 2014 than in 2013, despite the low precipitation in July 2014. However, RT/Tp in July was greater in 2013 (0.64 and 0.48 for 2013 and 2014, respectively) because of the low precipitation and high Tp in 2014 (Table 3). The RT was positively correlated with SWS in 2013 but negatively correlated in 2014. There was a negative correlation between soil evaporation and SWS in 2013 but a positive correlation in 2014 (Supplemental Table S1).
Soil Water Balance during
the Maize Growing Season
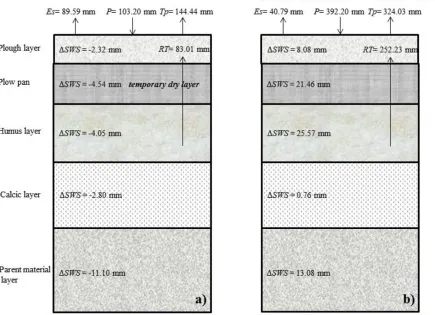
The soil water balance during the maize growing season is shown in Fig. 4. We separated the maize growing season into drought (early growing season) and wet (later growing season) peri-ods according to the precipitation. The high initial SWS provided enough soil water for maize growth during the drought period, with greater soil water consumption for each layer in 2014 than in 2013 (Fig. 4a and 4c). The root uptake during the drought period was also lower in 2013 than in 2014 (Fig. 4a and 4c). During the wet period, the whole soil profile gained water in 2013 due to the
high rainfall, while only the top 0- to 60-cm soil layer gained water in 2014 (Fig. 4b and 4d).
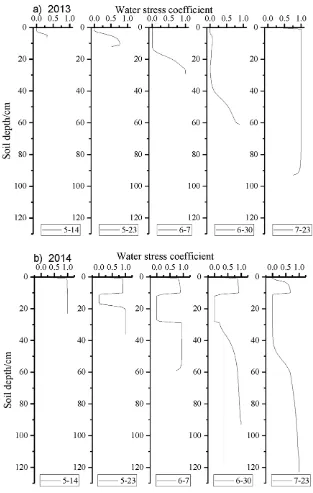
Water Stress for Maize Growth
We calculated the root zone water stress coefficient, a, for the soil profile during the early stage of the maize growing season (May–July). For each month, we chose 1 or 2 d as an example (Fig. 5). During May, the crop root was short and the water stress occurred in the surface soil layer in 2013. The water stress coeffi-cient was low at 0 to 20 cm and then at 0 to 40 cm at the beginning and end of June 2013, respectively, indicating that serious water Table 2. Changes in monthly soil water storage (DSWS) for different soil layers during the maize growing seasons.
Period
DSWS
0–20 cm 20–40 cm 40–80 cm 80–120 cm 120–200 cm 0–200 cm 2013
1 May (sowing)–31 May 3.59 7.12 −2.31 −4.16 −10.62 −6.38
1–30 June −4.46 −11.24 −3.18 1.32 −0.42 −17.98
1–31 July 8.05 29.62 38.97 42.00 0.60 119.24
1–31 Aug. −4.93 −27.58 −37.35 −33.32 18.36 −84.82 1–30 Sept. (harvest) 5.92 21.50 28.47 −5.64 −7.92 42.33
Total 8.17 19.42 24.60 0.20 0.00 52.39
2014
30 Apr. (sowing)–31 May −4.09 −10.42 −10.71 −15.16 −9.48 −49.86 1–30 June 0.03 −10.06 −11.22 −9.68 −4.56 −35.49 1–31 July −1.84 −10.54 −19.92 −19.48 −10.50 −62.28
1–31 Aug. 8.17 2.68 6.06 −2.52 −7.44 6.95
1–21 Sept. (harvest) 2.75 15.26 9.81 −3.88 −3.90 20.04
Total 5.02 −13.08 −25.98 −50.72 −35.88 −120.64
Table 3. Monthly precipitation (P), infiltration (In), soil evaporation (Es), crop transpiration (Tp), and root uptake (RT) during the maize growing seasons.
Period P In Es Tp RT
——————————— mm ——————————— 2013
1 May (sowing)–31 May 60.80 57.89 46.24 46.73 31.88 1–30 June 42.40 41.91 39.06 97.71 51.13 1–31 July 237.00 236.83 14.49 100.69 64.03 1–31 Aug. 38.40 38.87 15.28 150.80 145.78 1–30 Sept. (harvest) 116.80 119.12 11.01 72.54 42.42 Total 495.40 494.62 126.09 468.47 335.24
2014
stress occurred. Although the water stress coefficient was low at 10 to 30 cm in June 2014, there was no water stress because root water uptake occurred from the 30- to 60-cm and surface layers. In addi-tion, the root growth was faster in 2014 than in 2013, suggesting there was no significant water stress in June 2014. This difference may be related to the lower initial SWS before sowing (323 mm) in 2013 and higher initial SWS (490 mm) in 2014. Low rainfall (21.8 mm) caused water stress at 0 to 60 mm during July 2014, while heavy rainfall in July 2013 replenished the 0- to 100-cm soil layer, which alleviated the maize water stress.
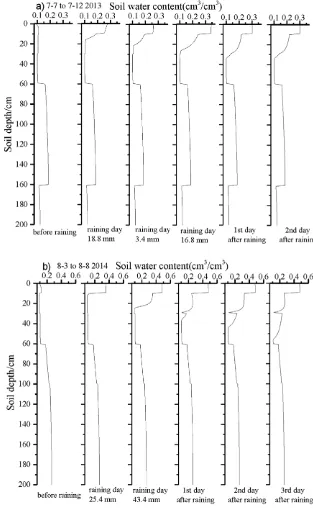
The soil water retention curve for the 20- to 40-cm soil layer was lower than for other layers (Supplemental Fig. S1). This layer had the largest bulk density value (Table 1), implying that this layer was the plow pan and was sensitive to drought. We surveyed the study plot and found that the plow pan was 5 to 30 cm thick. To investigate how the plow pan layer affects soil water infiltration during rainfall, we selected the first rainfall event (>30 mm) after the drought period in both years to simulate soil water redistri-bution in the soil profile (Fig. 6). The soil water contents in the plow pan layer were very low (close to the permanent wilting point, Supplemental Fig. S1) before rainfall, suggesting serious water stress. A rapid increase in soil water contents was observed in the layer above the plow pan during rainfall. However, infiltration to the plow pan layer was very slow. Even the higher rainfall in 2013 (39 mm) could not get through this plow pan layer, indicating that the plow pan layer effectively blocked the soil water movement vertically and reduced the infiltration rate.
6
Discussion
Evaluation of HYDRUS-1D Model Simulation
In this study, there was a good agreement between simulated and measured soil water contents in the different soil layers, con-firming that the HYDRUS-1D model is an appropriate tool for simulating soil water changes on the Loess Plateau. There are
several case studies where HYDRUS-1D has previously been used on the Loess Plateau. Wu and Huang (2011) used HYDRUS-1D to simulate water uptake by maize roots across three types of Loess soil. Fan et al. (2008) reported good comparison between estimated evapotranspiration using HYDRUS-1D and other ET estimation methods. Zhai et al. (2014) showed that HYDRUS-1D was capable of simulating soil water content dynamics and applied it to assess soil water and heat processes between different mulch-ing methods for winter wheat on the Loess Plateau. However, they showed better simulation of soil moisture in deep soil than in the surface soil layer and attributed this to the inability of HYDRUS-1D to represent the effect of alternate freezing and thawing and also to the neutron probe giving more precise mea-surement of soil moisture in deeper soil layers than for topsoil. In our study, the match between simulated and measured data was poorer for the deeper soil layers (80–200 cm; Fig. 2i, 2e, and 2j), which might be partially attributed to local flow caused by mac-ropores and cracks (Li et al., 2015), the sensitivity of the ECH2O system, and poor simulation of the time lag for the deeper soil water peak during high rainfall due to the plow pan. The soil water dynamics in the deeper layers is affected by water transport in the upper layers, so, from this standpoint, deep soil water simulation is more difficult than that in the surface layers.
Factors Influencing Soil Water Storage
during the Maize Growing Season
60% of total precipitation can be consumed by evapotranspira-tion in semiarid areas (Oki and Kanae, 2006). Wang et al. (2011) found that evapotranspiration could consume 90% of the total precipitation on the Loess Plateau of China. However, in our study, evapotranspiration accounted for 140% of precipitation during the maize growing season (Fig. 4), indicating that soil water was also a supply for water consumption. The SWS in the 80- to 120-cm soil layer is affected by plant root systems (Cong et al., 1990; February and Higgins, 2010), and we found that root uptake had a negative effect on SWS in 2014 (Supplemental Table S1). However, a positive correlation between SWS and root
uptake in 2013 was observed (Supplemental Table S1), implying that infiltration during heavy rain-fall may have much more influence on SWS than root uptake (Yang et al., 2012a). The SWS tended to be more stable in deeper soil layers (120–200 cm) due to less influence of evapotranspiration, precipitation, infiltration, and root uptake (Lin 2006; Guber et al., 2008; Hu et al., 2010; Gao and Shao, 2012; Jia et al., 2013). However, greater root uptake and less deeper infiltration may cause increased deep soil water consumption (Hupet and Vanclooster, 2002; Zhou et al., 2007; Zhao et al., 2010). Comparing SWS in the deep soil layers (120–200 cm) between 2013 and 2014 (Table 2) showed that SWS tended to be more stable for deeper soil layers when high rainfall occurred during the maize growing season.
What Is the Sensitive Soil Layer for
Water Stress during Maize Production?
During the dry period of 2013, the soil water content in the 20- to 40-cm layer was close to the permanent wilting point (Fig. 2a; Supplemental Fig. S1), and the water stress coefficient was very low (Fig. 5), indicating the formation of a tem-porary dry layer. The temtem-porary dry layer could be caused by low infiltration from rainwater but large evaporation and root uptake (Yang et al., 2012a). In our study, most of the maize roots were distributed within the 0- to 60-cm depth during the drought period in 2013. Similar to our study, Wang et al. (2008) also found that a dry soil layer was formed in the 30- to 35-cm layer after many years of tillage, and Yang et al. (2012b) observed a dry soil layer at a depth of 20 to 25 cm. We found that the temporary dry layer was likely to reduce water consumption (Fig. 4a) and soil evaporation (Supplemental Table S1, no correlation between Es
and soil water content during the drought period) from the layers below the plow pan layer. The plow pan effectively blocks the rainwater infiltration capacity and results in a sharp decrease in the infiltration rate of precipitation into the deeper soil layers (Fig. 6) (Chen et al., 2008). In addition, the formation of the tempo-rary dry layer may block deeper soil water movement to upper layers and limit maize growth, resulting in lower production (Jiang et al., 2016; Martinez et al., 2013). Therefore, avoidance of the formation of a temporary dry soil layer during the maize growing season, through management of the sensitive plow pan layer, should be a major concern. Management practices that may influence the soil water conditions in the plow pan layer include deep plowing or plastic film mulching during the maize growing season.
The Sensitive Time for Water Stress
and the Effects on Maize Growth
Figure 5 shows that significant water stress occurred during June in 2013 and during July in 2014. The result was well matched with our measured data, where we found that the soil water contents for the plow pan layer during the two periods were close to the permanent wilting point. The water stress is also shown by crop growth indices during the maize growing season, such as shorter plant height and low values of leaf number, length, and width com-pared with water conservation cultivation (mulching system) (Jiang et al., 2016). The water stress was related to weather conditions. Although the pre-cipitation during May to June was similar in 2013 and 2014, the precipitation during the 1- and 3-mo periods before sowing was much higher and the evap-oration was much lower in 2014 (Jiang et al., 2018), resulting in high initial SWS before sowing in 2014 (Fig. 4). This is the probable reason why water stress occurred earlier in 2013 than in 2014. The drought condition caused slower root growth at the early stage of the maize growing season in 2013. This might be because the root water uptake was limited by drought in the upper soil and by the plow pan. Water stress usually causes roots to grow deeper to absorb water from deeper soil layers (Brunner et al., 2015); how-ever, in this study the high soil density but low soil water content in the plow pan restricted root growth through this layer, resulting in slower root growth and a shallow root distribution that was unable to take water from deeper soil layers (only 24 mm of soil storage water was consumed during May–June 2013; Table 2). Consequently, the 0- to 40-cm layer suffered water stress (most roots were distributed in this layer) and became a temporary dry layer during the con-tinuous drought (Fig. 4 and 5). Concurrent studies at the same site also reported that the maize produc-tion in 2013 was very low (Jiang et al., 2016, 2018). The negative impact of water stress (temporary dry layer) in the early stage of the maize growing season on production has been shown in other studies (Jiang et al., 2018; Zhang et al., 2014). In 2014, we observed deeper rooting and increased crop height, especially
in the early stage of the maize growing season, probably because the high initial SWS could meet the water requirement of the crop and the roots rapidly grew to the deeper soil layer. Although water stress in the plow pan layer occurred in June and July (Fig. 5), the RT in 2014 was higher than that in 2013 (Table 3) and maize production was much higher in 2014 (Jiang et al., 2018), indicating that the ini-tial SWS before sowing could alleviate subsequent crop water stress effectively via deep roots. This was also proved by the consumption of soil water, of which 148 and 121 mm occurred during May to
in this area due to the common incidence of drought during the early stage of the maize growing season.
6
Conclusion
In this study, soil water contents in the different layers of the 0- to 200-cm soil profile were simulated using HYDRUS-1D. HYDRUS-1D was shown to be an effective tool for evaluating water processes related to SWS root uptake, soil evaporation, and crop transpiration response to rainfall during the maize growing season on the Loess Plateau of China. Precipitation, soil evapora-tion, and crop transpiration led to variation in SWS in the upper soil layers. Root uptake had an important effect on the consump-tion of stored soil water, especially in the 80- to 120-cm layer. Deep water consumption occurred during the drought period due to limited precipitation and low soil water storage. High SWS before sowing (initial SWS) reduced the risk of water stress during the drought period. Large soil evaporation and root uptake but low precipitation result in a temporary dry layer at a soil depth of 20 to 40 cm (the plow pan), especially during the early stage of the maize growing season. The plow pan layer was highlighted as the sensitive layer for water stress during the maize growing season. This temporary dry layer may cause a deficit in water availability for the crop by blocking the vertical movement of deeper soil water, limiting maize root uptake of soil water from the deeper soil layers and resulting in low maize production. Therefore, to alleviate the impacts of water stress on maize production in the rainfed agri-cultural region of the Loess Plateau, effective management such as deep plowing, plastic film mulching during the maize growing season, or water conservation treatments during the fallow season should be used to avoid the formation of a temporary dry soil layer during the drought period.
Acknowledgments
This study was funded by the National Key R&D Program of China (2017YFD0200106), the National Natural Science Foundation of China (41877086), the Natural Science Basic Research Plan in Shaanxi Province of China (2017JM4012), and Shaanxi Science and Technology for Co-ordination and Innovation Project, China (2016KTZDNY03-06). Collaboration with Rothamsted Research was supported by the Newton Fund through the BBSRC project of the UK–China Virtual Joint Centre for Improved Nitrogen Agrono-my (CINAg) (BB/N013468/1) and the Young Faculty Study Abroad Program of Northwest A&F University.
References
Allen, R.G. 2011. Skin layer evaporation to account for small precipitation events: An enhancement to the FAO-56 evaporation model. Agric. Water Manage. 99:8–18. doi:10.1016/j.agwat.2011.08.008
Asseng, S., B.A. Keating, I.R.P. Fillery, P.J. Gregory, J.W. Bowden, N.C. Turner, et al. 1998. Performance of the APSIM-Wheat model in western Australia. Field Crops Res. 57:163–179. doi:10.1016/S0378-4290(97)00117-2 Brunner, I., C. Herzog, M.A. Dawes, M. Arend, and C. Sperisen. 2015. How
tree roots respond to drought. Front. Plant Sci. 6:547.
Bryant, K.J., V.W. Benson, J.R. Kiniry, J.R. Williams, and R.D. Lacewell. 1992. Simulating corn yield response to irrigation timings: Validation of the EPIC model. J. Prod. Agric. 5:237–242. doi:10.2134/jpa1992.0237 Cao, Q.H., and Y.S. Gong. 2003. Simulation and analysis of water balance
and nitrogen leaching using HYDRUS-1D under winter wheat crop. (In
Chinese with English abstract.) Plant Nutr. Fert. Sci. 9:139–145. Carsel, R.F., and R.S. Parrish. 1988. Developing joint probability
distributions of soil water retention characteristics. Water Resour. Res. 24:755–769. doi:10.1029/WR024i005p00755
Chen, H.S., M.A. Shao, and Y.Y. Li. 2008. Soil desiccation in the Loess Plateau of China. Geoderma 143:91–100. doi:10.1016/j.geoderma.2007.10.013 Comegna, V., and A. Basile. 1994. Temporal stability of spatial patterns of
soil water storage in a cultivated Vesuvian soil. Geoderma 62:299–310. doi:10.1016/0016-7061(94)90042-6
Cong, X.H., Y.M. Liang, and D.Q. Li. 1990. Root characteristics of Hippophae rhamnoides and dynamic of soil water in semi-arid of Loess Plateau. (In Chinese with English abstract.) Shuitu Baochi Tongbao 10(6):98–103. Cosh, M.H., T.J. Jackson, S. Moran, and R. Bindlish. 2008. Temporal persistence
and stability of surface soil moisture in a semi-arid watershed. Remote Sens. Environ. 112:304–313. doi:10.1016/j.rse.2007.07.001
Famiglietti, J.S., J.W. Rudnicki, and M. Rodell. 1998. Variability in surface moisture content along a hillslope transect: Rattlesnake Hill, Texas. J. Hydrol. 210:259–281. doi:10.1016/S0022-1694(98)00187-5
Fan, J., M.A. Shao, and Q.J. Wang. 2008. Comparisons of many equations for calculating reference evapotranspiration in the Loess Plateau of China. (In Chinese with English abstract.) Nongye Gongcheng Xuebao 24:98–102. Fan, Y.W., N. Huang, X.Y. Ma, G.Q. Bi, and W.J. Zhao. 2016. Simulation of
infiltration characteristics in soil with sand interlayer using HYDRUS-1D. (In Chinese with English abstract.) Soils 48:193–200.
February, E.C., and S.I. Higgins. 2010. The distribution of tree and grass roots in savannas in relation to soil nitrogen and water. S. Afr. J. Bot. 76:517–523. doi:10.1016/j.sajb.2010.04.001
Feddes, R.A., P.J. Kowalik, and H. Zaradny. 1978. Simulation of field water use and crop yield. PUDOC, Wageningen, the Netherlands.
Gao, L., and M.A. Shao. 2012. Temporal stability of soil water storage in diverse soil layers. Catena 95:24–32. doi:10.1016/j.catena.2012.02.020 Gee, G.W., and D. Or. 2002. Particle-size analysis. In: J.H. Dane and G.C.
Topp, editors, Methods of soil analysis. Part. 4. SSSA Book Ser. 5. SSSA, Madison, WI. p. 255–293. doi:10.2136/sssabookser5.4.c12
Gómez-Plaza, A., J. Alvarez-Rogel, J. Albaladejo, and V.M. Castillo. 2000. Spatial patterns and temporal stability of soil moisture across a range of scales in a semi-arid environment. Hydrol. Processes 14:1261–1277. doi:10.1002/(SICI)1099-1085(200005)14:7<1261::AID-HYP40>3.0.CO;2-D Gong, Z.T., G.L. Zhang, and Z.C. Chen, editors. 2007. Pedogenesis and soil
taxonomy. (In Chinese.) Beijing Science Press Publ., Beijing. Goovaerts, P., and C.N. Chiang. 1993. Temporal persistence of spatial
patterns for mineralizable nitrogen and selected soil properties. Soil Sci. Soc. Am. J. 57:372–381. doi:10.2136/sssaj1993.03615995005700020015x Guber, A.K., T.J. Gish, Y.A. Pachepsky, M.Th. van Genuchten, C.S.T. Daughtry,
T.J. Nicholson, and R.E. Cady. 2008. Temporal stability in soil water content patterns across agricultural fields. Catena 73:125–133. doi:10.1016/j.catena.2007.09.010
Hu, W., M.A. Shao, F.P. Han, K. Reichardt, and J. Tan. 2011. Watershed scale temporal stability of soil water content. Geoderma 162:260–272. doi:10.1016/j.geoderma.2011.02.008
Hu, W., M.A. Shao, and K. Reichardt. 2010. Using a new criterion to identify sites for mean soil water storage evaluation. Soil Sci. Soc. Am. J. 74:762–773. doi:10.2136/sssaj2009.0235
Hu, W., M.A. Shao, Q.J. Wang, and K. Reichardt. 2009. Time stability of soil water storage measured by neutron probe and the effects of calibration procedures in a small watershed. Catena 79:72–82. doi:10.1016/j.catena.2009.05.012
Hupet, F., and M. Vanclooster. 2002. Intraseasonal dynamics of soil moisture variability within a small agricultural maize cropped field. J. Hydrol. 261:86–101. doi:10.1016/S0022-1694(02)00016-1
Jiang, R., X. Li, W. Zhu, K. Wang, S. Guo, T. Misselbrook, and R. Hatano. 2018. Effects of the ridge mulched system on soil water and inorganic nitrogen distribution in the Loess Plateau of China. Agric. Water Manage. 203:277–288. doi:10.1016/j.agwat.2018.03.027
Jones, J.W., G. Hoogenboom, C.H. Porter, K.J. Boote, W.D. Batchelor, L.A. Hunt, et al. 2003. DSSAT cropping system model. Eur. J. Agron. 18:235– 265. doi:10.1016/S1161-0301(02)00107-7
Kachanoski, R.G., and E. de Jong. 1988. Scale dependence and the temporal persistence of spatial patterns of soil water storage. Water Resour. Res. 24:85–91. doi:10.1029/WR024i001p00085
Kachanoski, R.G., E.G. Gregorich, and I.J. Van Wesenbeeck. 1988. Estimating spatial variations of soil water content using
noncontacting electromagnetic inductive methods. Can. J. Soil Sci. 68:715–722. doi:10.4141/cjss88-069
Kamgar, A., J.W. Hopmans, W.W. Wallender, and O. Wendroth. 1993. Plotsize and sample number for neutron probe measurements in small field trials. Soil Sci. 156:213–224. doi:10.1097/00010694-199310000-00001 Kelliher, F.M., R. Leuning, and E.D. Schulze. 1993. Evaporation and canopy
characteristics of coniferous forests and grasslands. Oecologia 95:153– 163. doi:10.1007/BF00323485
Klute, A., and C. Dirksen. 1986. Hydraulic conductivity and diffusivity: Laboratory methods. In: A. Klute, editor, Methods of soil analysis. Part 1. 2nd ed. SSSA Book Ser. 5. SSSA, Madison, WI. p. 687–734. doi:10.2136/sssabookser5.1.2ed.c28
Korsunskaya, L.P., N.G. Gummatov, and Y.A. Pachepsky. 1995. Seasonal changes in root biomass carbohydrate content, and structural characteristics of Gray Forest soil. Eurasian Soil Sci. 27:45–52. Kroes, J.G., J.G. Wesseling, J.C. Van Dam, S.M. Brooks, and R.A. McDonnell.
2000. Integrated modelling of the soil–water–atmosphere–plant system using the model SWAP 2.0: An overview of theory and an application. Hydrol. Processes 14:1993–2002. doi:10.1002/1099-1085(20000815/30)14:11/12<1993::AID-HYP50>3.0.CO;2-# Li, H.J., J. Yi, J.G. Zhang, Y. Zhao, B. Si, R.L. Hill, et al. 2015. Modeling of soil
water and salt dynamics and its effects on root water uptake in Heihe arid wetland, Gansu, China. Water 7:2382–2401. doi:10.3390/w7052382 Li, J., M.A. Shao, and X.C. Zhang. 2004. Simulation equations for soil water
transfer and use in the EPIC model. (In Chinese with English abstract.) Ganhan Diqu Nongye Yanjiu 22(2):72–75.
Li, W., M.D. Hao, and X.C. Wang. 2010. Depletion and restoration of soil water in different cultivating systems in gully region of Loess Plateau. (In Chinese with English abstract.) Trans. Chin. Soc. Agric. Eng. 26(3):99–105. Li, Y.S., S.F. Han, and Z.H. Wang. 1985. Soil water properties and their
zoning in the Loess Plateau. (In Chinese with English abstract.) Mem. Northw. Inst. Soil Water Conserv. 2:2–17.
Lin, H. 2006. Temporal stability of soil water spatial pattern and subsurface preferential flow pathways in the Shale Hills catchment. Vadose Zone J. 5:317–340. doi:10.2136/vzj2005.0058
Liu, C.A., S.L. Jin, L.M. Zhou, Y. Jia, F.M. Li, Y.C. Xiong, and X.G. Li. 2009. Effects of plastic film mulch and tillage on maize productivity and soil parameters. Eur. J. Agron. 31:241–249. doi:10.1016/j.eja.2009.08.004 Martinez, G., Y.A. Pachepsky, H. Vereecken, H. Hardelauf, M. Herbst,
and K. Vanderlinden. 2013. Modeling local control effects on the temporal stability of soil water content. J. Hydrol. 481:106–118. doi:10.1016/j.jhydrol.2012.12.024
Martínez-Fernández, J., and A. Ceballos. 2003. Temporal stability of soil moisture in a large-field experiment in Spain. Soil Sci. Soc. Am. J. 67:1647–1656. doi:10.2136/sssaj2003.1647
Moran, M.S., C.D. Peters-Lidard, J.M. Watts, and S. McElroy. 2004. Estimating soil moisture at the watershed scale with satellite-based radar and land surface models. Can. J. Remote Sens. 30:805–826. doi:10.5589/m04-043 Nash, J.E., and J.V. Sutcliffe. 1970. River forecasting through conceptual
models: 1. A discussion of principles. J. Hydrol. 10:282–290. doi:10.1016/0022-1694(70)90255-6
Oki, T., and S. Kanae. 2006. Global hydrological cycles and world water resources. Science 313:1068– 1072. doi:10.1126/science.1128845 Porporato, A., E. Daly, and I. Rodriguez‐Iturbe. 2004. Soil water balance
and ecosystem response to climate change. Am. Nat. 164:625–632. doi:10.1086/424970
Probert, M.E., J.P. Dimes, B.A. Keating, R.C. Dalal, and W.M. Strong. 1998. APSIM’s water and nitrogen modules and simulation of the dynamics of water and nitrogen in fallow systems. Agric. Syst. 56:1–28. doi:10.1016/S0308-521X(97)00028-0
Ramos, C., and E.A. Carbonell. 1991. Nitrate leaching and soil moisture prediction with the LEACHM model. Fert. Res. 27:171–180. doi:10.1007/BF01051125
Ritchie, J.T. 1972. Model for predicting evaporation from a row crop with incomplete cover. Water Resour. Res. 8:1204–1213. doi:10.1029/WR008i005p01204
Rosenberg, N.J., M.S. McKenney, W.E. Easterling, and K.M. Lemon. 1992. Validation of EPIC model simulations of crop responses to current climate and CO2 conditions: Comparisons with census, expert judgment and experimental plot data. Agric. For. Meteorol. 59:35–51. doi:10.1016/0168-1923(92)90085-I
Roy, J.W., G.W. Parkin, and C. Wagner-Riddle. 2000. Water flow in unsaturated soil below turfgrass: Observations and LEACHM (within EXPRES) predictions. Soil Sci. Soc. Am. J. 64:86–93. doi:10.2136/sssaj2000.64186x Sau, F., K.J. Boote, M.N. Bostick, J.W. Jones, and M.I. Mínguez. 2004. Testing and improving evapotranspiration and soil water balance of the DSSAT crop models. Agron. J. 96:1243–1257. doi:10.2134/agronj2004.1243 Schaap, M.G., F.J. Leij, and M.Th. van Genuchten. 2001. Rosetta: A
computer program for estimating soil hydraulic parameters with hierarchical pedotransfer functions. J. Hydrol. 251:163–176. doi:10.1016/S0022-1694(01)00466-8
Schneider, K., J.A. Huisman, L. Breuer, Y. Zhao, H.G. Frede. 2008. Temporal stability of soil moisture in various semi-arid steppe ecosystems and its application in remote sensing. J. Hydrol. 359:16–29. doi:10.1016/j.jhydrol.2008.06.016
Seneviratne, S.I., T. Corti, E.L. Davin, M. Hirschi, E.B. Jaeger, I. Lehner, et al. 2010. Investigating soil moisture–climate interactions in a changing climate: A review. Earth Sci. Rev. 99:125–161. doi:10.1016/j.earscirev.2010.02.004 Shuttleworth, W.J. 1989. Forests, weather and climate: Micrometeorology
of temperate and tropical forest. Philos. Trans. R. Soc. London 324:299– 334. doi:10.1098/rstb.1989.0050
Šimůnek, J., and J.W. Hopmans. 2009. Modeling compensated root water and nutrient uptake. Ecol. Modell. 220:505–521. doi:10.1016/j.ecolmodel.2008.11.004
Šimůnek, J., H. Saito, M. Sakai, and M.Th. van Genuchten. 2008. The HYDRUS-1D software package for simulating the one-dimensional movement of water, heat, and multiple solutes in variably-saturated media. Dep. of Environmental Sciences, Univ. of California, Riverside. Smith, W.N., W.D. Reynolds, R. de Jong, R.S. Clemente, and E. Topp.
1995. Water flow through intact soil columns: Measurement and simulation using LEACHM. J. Environ. Qual. 24:874–881. doi:10.2134/jeq1995.00472425002400050013x
Starks, P.J., G.C. Heathman, T.J. Jackson, and M.H. Cosh. 2006. Temporal stability of soil moisture profile. J. Hydrol. 324:400–411. doi:10.1016/j.jhydrol.2005.09.024
Stewart, L.K., P.B. Charlesworth, K.L. Bristow, and P.J. Thorburn. 2006. Estimating deep drainage and nitrate leaching from the root zone under sugarcane using APSIM-SWIM. Agric. Water Manage. 81:315– 334. doi:10.1016/j.agwat.2005.05.002
Tallon, L.K. 2004. Representative soil water benchmarking for environmental monitoring. J. Environ. Inform. 4(1):31–39. doi:10.3808/jei.200400034 Tan, X., D.G. Shao, and H.H. Liu. 2014. Simulating soil water regime in lowland
paddy fields under different water managements using HYDRUS-1D. Agric. Water Manage. 132:69–78. doi:10.1016/j.agwat.2013.10.009 Tromp-van Meerveld, H.J., and J.J. McDonnell. 2006. On the interrelations
between topography, soil depth, soil moisture, transpiration rates and species distribution at the hillslope scale. Adv. Water Resour. 29:293– 310. doi:10.1016/j.advwatres.2005.02.016
Vereecken, H., T. Kamai, T. Harter, R. Kasteel, J. Hopmans, and J.
Vanderborght. 2007. Explaining soil moisture variability as a function of mean soil moisture: A stochastic unsaturated flow perspective. Geophys. Res. Lett. 34:L22402. doi:10.1029/2007GL031813
abstract.) Ying Yong Sheng Tai Xue Bao 15:436–442.
Wang, L., S.P. Wei, R. Horton, and M.A. Shao. 2011. Effects of vegetation and slope aspect on water budget in the hill and gully region of the Loess Plateau of China. Catena 87:90–100. doi:10.1016/j.catena.2011.05.010 Wang, Y.H., D.X. Cai, Y.Q. Yao, J.J. Lv, J.H. Li, Z.Q. Ding, and J. Zhang. 2008.
Effects of conservation tillage on rainfall runoff, soil water infiltration and distribution on loess sloping farming in the western part of Henan. (In Chinese with English abstract.) J. Soil Water Conserv. 22(2):29–31. Wu, Y., J.Q. Bai, Z.P. Zhang, J.P. Xu. 2012. Trend analysis of precipitation and its
erosivity over last 53 years based on the daily rainfall in Changwu County. (In Chinese with English abstract.) Res. Soil Water Conserv. 19(4):38–42. Wu, Y.Z., and M.B. Huang. 2011. Analysis of influential factors for maize root water uptake based on HYDRUS-1D model. (In Chinese with English abstract.) Trans. Chin. Soc. Agric. Eng. 27(14):66-73. Yang, L., W. Wei, L. Chen, F. Jia, and B. Mo. 2012a. Spatial variations of
shallow and deep soil moisture in the semi-arid Loess Plateau, China. Hydrol. Earth Syst. Sci. 16:3199–3217. doi:10.5194/hess-16-3199-2012 Yang, L., W. Wei, L. Chen, and B. Mo. 2012b. Response of deep soil moisture
to land use and afforestation in the semi-arid Loess Plateau, China. J. Hydrol. 475:111–122. doi:10.1016/j.jhydrol.2012.09.041
Zhai, X.F., Q. Li, Z.H. Wang, R. Jiang, and Y. Zhao. 2014. Soil water and heat dynamic analysis under straw and plastic film mulching modes. (In Chinese with English abstract.) Soil 4:716–724.
Zhang, S.L., V. Sadras, X.P. Chen, and F.S. Zhang. 2014. Water use efficiency of dryland maize in the Loess Plateau of China in response to crop management. Field Crops Res. 163:55–63. doi:10.1016/j.fcr.2014.04.003 Zhang, Y.W., L. Deng, W.M. Yan, and Z.P. Shangguan. 2016. Interaction
of soil water storage dynamics and long-term natural vegetation succession on the Loess Plateau, China. Catena 137:52–60. doi:10.1016/j.catena.2015.08.016
Zhao, C., Z. Feng, and G. Chen. 2004. Soil water balance simulation of alfalfa (Medicago sativa L.) in the semiarid Chinese Loess Plateau. Agric. Water Manage. 69:101–114. doi:10.1016/j.agwat.2004.04.006
Zhao, Y., S. Peth, X.Y. Wang, H. Lin, and R. Horn. 2010. Controls of surface soil moisture spatial patterns and their temporal stability in a semi-arid steppe. Hydrol. Processes 24:2507–2519. doi:10.1002/hyp.7665 Zhou, X., H. Lin, and Q. Zhu. 2007. Temporal stability of soil moisture