Strength of PLA Components Fabricated with Fused Deposition
Technology Using a Desktop 3D Printer as a Function of Geometrical
Parameters of the Process
Vladimir E. Kuznetsov*1, Alexey N. Solonin*, Oleg D. Urzhumtsev*, Richard Schilling**, Azamat G. Tavitov*
*) National University of Science and Technology “MISIS”, Moscow, Russia
**) Reutlingen University, Reutlingen, Germany
1Corresponding author, Email address: [email protected]
Abstract
The current paper is studying the influence of geometrical parameters of the FDM (FFF) 3D printing process on printed part strength for open source desktop 3D printers and the most popular material used for that purpose, i.e. PLA (polylactic acid). The study was conducted using a set of different nozzles (0.4, 0.6 and 0.8 mm) and a range of layer heights from the minimum to maximum physical limits of the machine. To assess print strength, a novel assessment method is proposed. A tubular sample is loaded in the weakest direction (across layers) in a three-point bending fixture. To explain the results obtained, a mesostructure evaluation through SEM scans of the samples were used. A significant influence of geometric process parameters was detected on sample mesostructure and, consequently, on sample strength.
Keywords: additive manufacturing; desktop 3D printing; Fused Deposition Modeling; Fused Filament Fabrication; Polylactic Acid; anisotropy; interlayer bonds; mechanical strength; digital fabrication
1.
Introduction
projects, the most important of which was the RepRap initiated by Adrian Bowyer and his colleagues [3, 4]. The project declared its aim to develop a 3D printer which could be printed by another 3D printer. Although none of the RepRap printers can fully replicate
themselves, the project’s success led to the formation of an ecosystem of desktop digital additive fabrication. The FDM technology under the name of FFF, Fused Filament Fabrication, appeared in the mass market.
Open source software and hardware of desktop 3D printers gives the full control over the speed and temperature management during the printing process. A reasonable choice of geometrical parameters and the temperature-speed settings on the desktop 3D printers allows in many cases to obtain better product properties, including higher strength, than products made using far more expensive proprietary machines
documented by research results [5].
The overwhelming majority of products made by desktop printers today are various toys and customized casings for cell phones but there are also examples of products
with serious applications. The most resonating of these are Cody Wilson’s Liberator [6] and the E-nable project [7].
The last decade saw an explosive growth in the number of 3D Printers basically caused by the mass-market segment of desktop machines and which led to the appearance of a substantial market of supplies —polymers for printing in the “filament” format with a
thread diameter of 1.75 and 2.85 mm. Introduced by Stratasys FDM printing started exclusively with ABS (polyacrylonitrile butadiene styrene), the FFF printing initiated by RepRap started with PCL (polycaprolactone) [4], but today a variety of materials, including PLA (polylactic acid), PC (polycarbonate), PEEK (polyetheretherketone) [] and many others can be used as filament material for 3D printing. Meanwhile, for all the variety, in the majority of applications nowadays polylactide (PLA) is the first choice. PLA is favored for its biodegradability, absence of unpleasant odors when heated and for its overall environmental compatibility in all aspects of its life cycle. Additionally, PLA emits ten times less potentially dangerous ultra-fine particles [9] than ABS.
show better resulting mechanical characteristics, shown e.g. in [5], where the mean tensile strength of the samples is measured to be 28.5 MPa for ABS and 56.6 MPa for PLA.
Parts obtained by FDM (FFF) have an explicit anisotropy of mechanical properties, caused by the process characteristics of depositing layers of fine threads of molten thermoplastic material. The strength of FDM (FFF) parts across the layers (in Z-direction) is significantly lower than the strength along the threads (x and y-direction respectively) sometimes by a factor. In the majority of studies investigating the influence of various parameters on the strength of FDM (FFF) technologies [5, 10-14], tensile properties are measured on flat samples oriented horizontally during the printing process to be researched, i.e. with the smallest dimension in the Z axis. Thus, during the tests samples are stressed alongside the printed strands, of which the shell of the sample consists, i.e. in the direction where the sample exhibits its maximum strength.
Interfaces between layers of FDM (FFF) prints are morphologically very similar to so-called weld or knit lines in injection-molded parts. Earlier studies on these interfaces show that their mechanical performance is substantially inferior to that of homogeneous parts made of the same material and to the bulk properties, respectively [15].
Attempts to significantly improve the strength of 3D printed parts therefore need to focus on the Z axis. In this respect, the most important parameter is not the strength of the filament material itself, but the strength and stability of the bonds between the layers of the sample, which in turn is largely determined by the parameters of printing. Research on the influence of process parameters on the strength of samples in the Z-axis is hitherto scarce.
The objective of this paper is to study the bonding strength between adjacent layers as a function of geometrical parameters of FDM (FFF) process.
2.
Experimental Methods
There is no standard procedure so far for testing specimens fabricated on FDM (FFF) printers. In the majority of papers observed [5, 10–14], testing standards used have been developed for polymer samples produced by molding or by machining or die cutting out of monolithic sheet or slab [16] and, consequently, not considering the specifics of samples made of fused filament threads.
In the absence of generally accepted standard procedures, an alternative method is proposed: testing whole part in the least strong direction. The strength of the boundary between two layers being the factor limiting the strength of FDM (FFF) specimen, bending test seems more adequate than tensile ones. It is also true considering typical loads on printed parts.Among the various procedures of measuring flexural strength the three-point-bending test is viewed as the most appropriate. The sample geometry was selected in order to allow varying the fabrication process parameters in wide range. The model is decomposed by printer software into upper and lower planes, shell mimicking the shape of the model, and infill inside the shell. All the practical experience in 3D printing shows that for an improvement of mechanical strength it is first of all necessary to invest printing time and material into the shell rather than into the infill. When the shell is printed, the filament strand is laid down parallel to the preceding one, ensuring maximum contact area between the layers. For this reason, the samples for the method presented consist exclusively of a shell. All the samples prepared for this paper had the same dimensions and shape.
2.1. Samples Fabrication
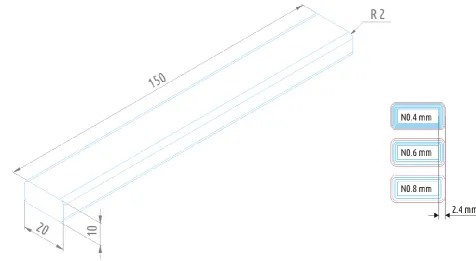
The sample shape chosen was a tube of a rectangular cross-section of 10 x 20 mm2 with rounded corners of 2 mm outer radius, with wall thickness of 2.4 mm and150 mm in length. The file used initially for printing was a solid model of a parallelepiped of 10 x 20 x 150 mm3 with rounded (R=2 mm) long ribs (Figure 1).
The samples were printed in an upright position, i.e. with the 150 mm dimension along Z-axis; the tubular geometry was achieved by setting the “fill density” parameter in the
printer software to 0 and by avoiding the upper and lower covers (solid infill top and
solid infill bottom). The wall thickness was preset by the parameter “shell thickness”.
Three different nozzles were used for producing the samplesof 0.4, 0.6, and 0.8 mm in diameter respectively. The shell was printed with 6, 4 and 3 rounds of the respective nozzle; for FDM (FFF) shell thickness usually is an integer multiple of nozzle diameter, and accordingly, shell is formed by one or several perimeters.
The layer thickness of the prints varied between 0.06 mm and 0.6 mm, for each combination of nozzle diameter and layer thickness at least three samples were produced. Irrespective of the nozzle used, the layer thickness chosen and the type of printer, all the samples were printed with a constant linear speed of 25 mm/s, which obviously caused a wide variation in volumetric speed, which in turn is calculated as the volume of plastic extruded through the nozzle per unit of time. The 0.4mm nozzle was used on a serial Ultimaker 2 printer, whilst 0.6 and 0.8 mm were used in an Ultimaker 2
with a modified heating unit (known as the “Olsson Block” [10]), allowing use of replaceable nozzles with varying diameters, and a heating element with increased heating power (ca. 35 W). Both printers were fed with 2.85 mm filament in diameter. In all experiments during the first stage, PLA filament from a single supplier (REC, Moscow, Russia) of one color (turquoise) and from the same batch was used. It was also necessary to generalize intermediate results by showing that parameter optimization results obtained for one PLA-based filament can be applied to prints using different PLA-based filaments. To answer this question, a set of additional experiments was performed to estimate the behavior of parts printed from other types of PLA. In addition to the turquoise PLA by REC, there were three other filaments investigated: colorless (natural) PLA from the same manufacturer (REC), as well as colorless (natural) and black filament by Verbatim (produced in China). The samples were printed under the same conditions used in the first part of the study. There were two nozzles used (0.4 and 0.6 mm), the first was utilized to print samples with 0.06 and 0.2 mm layer height, the second for samples with 0.1 and 0.4 mm layer height.
2.2. Mechanical Strength Examination
are two primary types of them — in the bulk (across the layers) or on the interface between layers. Cross-section mesostructure of some of the broken samples were investigated using scanning electronic microscopy (SEM) on Tescan Vega 3 LMH microscope.
For a more general discussion of results obtained, the normal stresses in the samples at the moment of failure (UFS) were calculated. The stresses were calculated by dividing the maximum moment (M) by the section modulus (W):
𝜎𝑚𝑎𝑥 = 𝑀
𝑊 , MPa.
The maximum moment for testing samples at distance between the supports of 100mm
𝑀 =𝐹×𝑙
4 = 0.025𝐹, N·m,
whereF is the load in N at the moment of failure. The section moment is calculated by using formula:
𝑊 = 2𝐼
ℎ, m 3,
where I is the second moment of the cross-section, calculated with the built-in app of SolidWorks to be 1416.89 mm4.
Thus, the maximum normal stress in the sample can be calculated from the load by
𝜎𝑚𝑎𝑥 = 0.088,
where F is given in N and 𝜎𝑚𝑎𝑥is in MPa.
3.
Results and Discussion
3.1. Influence of geometrical parameters
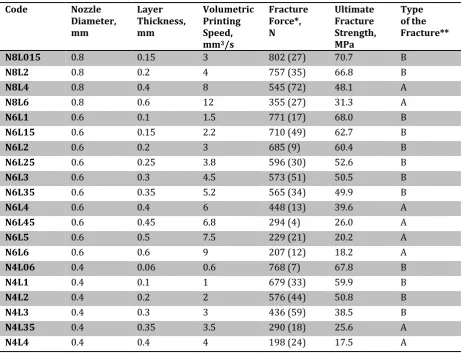
Table 1. Experimental data on the influence of geometrical parameters of 3D printing (nozzle diameter and layer thickness) on the fabricated components strength
Code Nozzle Diameter, mm Layer Thickness, mm Volumetric Printing Speed, mm3/s
Fracture Force*, N Ultimate Fracture Strength, MPa Type of the Fracture**
N8L015 0.8 0.15 3 802 (27) 70.7 B
N8L2 0.8 0.2 4 757 (35) 66.8 B
N8L4 0.8 0.4 8 545 (72) 48.1 A
N8L6 0.8 0.6 12 355 (27) 31.3 A
N6L1 0.6 0.1 1.5 771 (17) 68.0 B
N6L15 0.6 0.15 2.2 710 (49) 62.7 B
N6L2 0.6 0.2 3 685 (9) 60.4 B
N6L25 0.6 0.25 3.8 596 (30) 52.6 B
N6L3 0.6 0.3 4.5 573 (51) 50.5 B
N6L35 0.6 0.35 5.2 565 (34) 49.9 B
N6L4 0.6 0.4 6 448 (13) 39.6 A
N6L45 0.6 0.45 6.8 294 (4) 26.0 A
N6L5 0.6 0.5 7.5 229 (21) 20.2 A
N6L6 0.6 0.6 9 207 (12) 18.2 A
N4L06 0.4 0.06 0.6 768 (7) 67.8 B
N4L1 0.4 0.1 1 679 (33) 59.9 B
N4L2 0.4 0.2 2 576 (44) 50.8 B
N4L3 0.4 0.3 3 436 (59) 38.5 B
N4L35 0.4 0.35 3.5 290 (18) 25.6 A
N4L4 0.4 0.4 4 198 (24) 17.5 A
*) Value in brackets is a standard deviation;
**) A — on the interface between layers, B — in the bulk (across the layers).
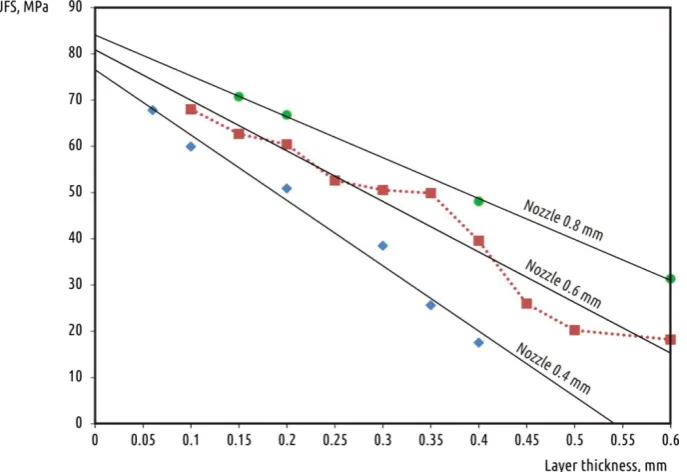
Figure 2. Ultimate Flexural Strength of tested samples versus deposited layer height for all nozzles used
The current paper might be the first publication presenting the strength data for PLA samples printed with 0.8 mm and 0.6 mm nozzles. However, data for samples printed with 0.4 mm nozzles come into conflict with results of previous research [12]. That study claims that increasing layer height also increases sample strength instead of
drastic reduction: “In upright samples, tensile and flexural strength increased as layer
thickness increased”. The authors of that research also indicate correspondence of their
results with previous studies [17]. However, experiment settings in [12] and [17] have significant differences that impede direct comparison. For example, [17] scrutinizes ABS samples printed on a proprietary Stratasys Vantage machine. The printing strategy
(“perimeter and interior”, equal to “shell and infill” in modern open source printer and
slicer terminology) is different from the study in [12], where the shell constitutes the whole sample volume. The results of [17] are ambiguous, as tensile strength is increased along with layer thickness rise, while the flexural strength tests do not exhibit that relation clearly: increasing layer thickness can both increase and reduce flexural strength depending on other settings.
thickness) ratio. Printing in upright position means very large height to bottom surface area ratio, resulting in a tall and unstable object. Nozzle movement, even given the reduced 20 mm/s speed, causes oscillations of the sample, thus reducing surface quality and interlayer cohesion. If that suggestion is correct, the results obtained in [12] are not applicable in a common printing setup for stable samples.
Strength degradation with increasing layer height was also registered in [20] although there was different object of study, as ABS printed samples were used with only two options for layer height.
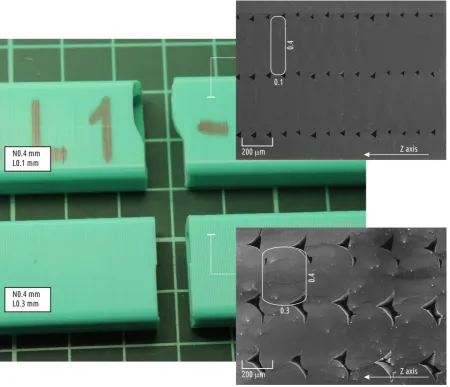
The sample printed with relatively thick layers shows that breakage occurred at the junction between layers (Figure 4, bottom), whereas the crack in the 0.1 mm sample (Figure 4 top) is not planar. The X-Z axes cross-sections (right side of Figure 3) of these samples were analyzed using a scanning electronic microscope (SEM), and the images obtained clearly explain the dependencies discovered.
Even when printing the shell, FDM (FFF) material is still far from being monolithic. The cross-section clearly displays individual threads that constitute the part, as well as voids between them. These voids significantly reduce the effective sample cross-sections in X-Y axes, making it lower than calculated value. Thus, the calculated UFS values have no physical meaning, while being a virtual measure solely for comparison purposes. SEM scans show that gap areas increase along with layer height, and the difference between actual cross-section area and sample cross-section used for calculations will rise as well. That is the proposed explanation for why sample strength decays with layer height increase.
Increase in interlayer cohesion with nozzle diameter increase can be explained with the following. When single thread thickness is increased, the shell of the same thicknesswill be made of smaller number of individual threads while voids between them remain of comparable size with constant layer height, and thus the print will contain less total space between these threads.
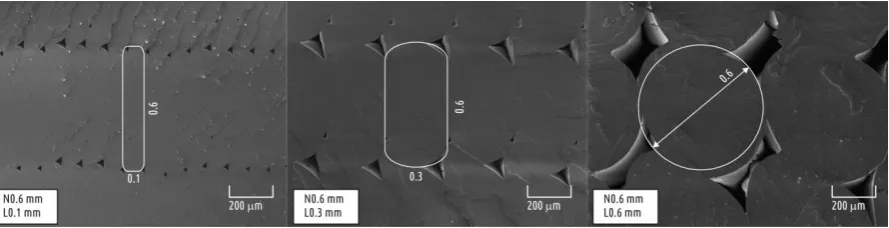
The data obtained can be generalized with the following formulation: the higher the ratio of nozzle diameter to layer height is, the more the individual thread of the deposed filament resembles an ideal circle. The smaller the layer height is, the more the cross-section resembles an elongated rectangle. That could be illustrated by images of the cross-sections of samples printed with 0.6 mm nozzles and with minimum (0.1 mm), mean (0.3 mm) and maximum (0.6 mm) layer thickness (Figure 4).
Figure 4. Transformation of an individual thread cross-section with layer thickness increase: idealized layer thread shape overlaid on SEM images
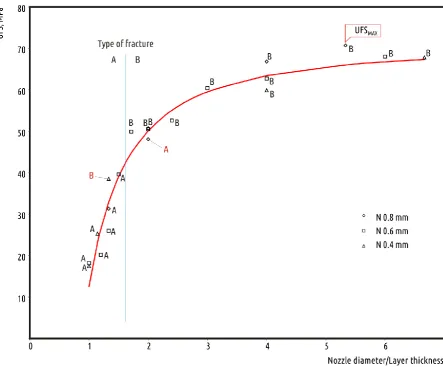
Figure 5. Ultimate Flexural Strength of tested samples versus nozzle diameter to layer height ratio
The curve fitting the experimental data with adequate accuracy may be represented by formula:
UFS = UFSMAX– 58.19 / (r1.5),
Where UFSMAX is the maximum UFS observed in the experiment,r is the nozzle diameter to layer height ratio and UFS is the resulting part strength.
This formula was obtained using curve fitting approach with Scikit-learn package implementation in Python as a result of optimization for the following formula:
UFS = a – b/(rc).
Unconstrained optimization resulted in R2 score equal to 0.958, and coefficient a was
calculated slightly below UFSMAX. As the value resembled bulk material strength or
maximum UFS value obtained, it was decided that for clarity purposes the resulting formula will use UFSMAX as a. R2 score reduced insignificantly to 0.954 which seemed a
From a practical point of view it might be more useful just to divide the scatterplot into
three zones labeled as “unadvised”, “optimal”, and the “rigorous” range in terms of
resulting part strength.
Printing with nozzle to layer height ratio (N/L) between 1 and 2 can only be advised for making low duty prints. These can be parts not bearing physical loads and the cases when printing time is more important than load capacity. The range of N/L ratio between 2 and 4 can be considered optimal for printing functional parts. Varying geometrical parameters allows for finding a compromise between printing time and part strength. Raising the ratio above 4 can only be recommended for fabrication of crucial parts, when printing time becomes insignificant.
The (N/L) ratio does not only quantitatively determine the part strength, but also qualitatively. The ratio value of about 1.6 divides all the observations, except for two outliers marked with red color on the Figure 5 into two types of failure: across the layers (A) and in the bulk (B).
3.2. Influence of filament material on print strength
Current subsection should be prefaced with the following Disclaimer:
Filament quality is a multidimensional notion which defines different parameters, from uniform spooling to biodegradability. The sample strength obtained when using a specific filament with a specific printing configuration and parameters is just one of many quality measures and increasing the sample strength might adversely affect other parameters. The current study concentrated on analyzing opportunities to increase sample strength across layers. We cannot claim that some of the filaments are better or worse than others, we just showed that samples printed using different filament from various suppliers at parameters indicated exhibit different strength.
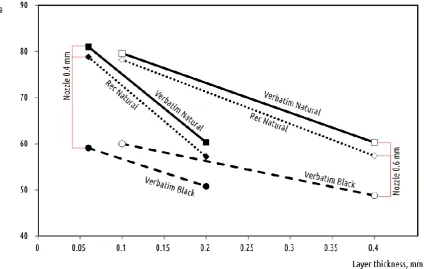
Table 2. Experimental data on geometrical parameters influence (nozzle diameter and layer thickness) on strength of components fabricated out of different PLA filaments
Vendor Color Nozzle diameter, mm
Layer thickness, mm
Fracture force*, N
Ultimate Fracture Strength, MPa
REC Natural 0.6 0.1 886 (19) 78.2
REC Natural 0.6 0.4 651 (6) 57.4
Verbatim Natural 0.6 0.1 902 (38) 79.6
Verbatim Natural 0.6 0.4 683 (29) 60.3
Verbatim Black 0.6 0.1 680 (38) 60.0
Verbatim Black 0.6 0.4 553 (44) 48.8
REC Natural 0.4 0.06 893 (20) 78.8
REC Natural 0.4 0.2 648 (40) 57.2
Verbatim Natural 0.4 0.06 918 (37) 81.0
Verbatim Natural 0.4 0.2 684 (16) 60.3
Verbatim Black 0.4 0.06 670 (38) 59.1
Verbatim Black 0.4 0.2 576 (61) 50.8
*) Value in brackets is a standard deviation
Conclusions
This paper offers a new methodology for researching the influence of material and process parameters on the mechanical properties of parts printed with FDM (FFF) technology. That methodology allows for obtaining more adequate results than the most common research approaches based on standards which are not applicable to FDM (FFF) printing technology.
The study showed that limiting printed part strength may be significantly increased by adjusting basic geometry parameters of the process. This should be true for most 3D printing filaments based on PLA for desktop printers available, including all filaments tested.
It is the layer height that has the biggest influence on intra-layer cohesion. Part strength decreased along with layer height increase for all nozzles investigated (0.4, 0.6 and 0.8mm) over the whole range of layer height values tested. For the samples under study, the decrease of strength when changing layer height from minimum to maximum was about 3.5 times.
Nozzle diameter also has a significant influence on interlayer cohesion. Given constant layer height, printing with a larger nozzle results in increased strength. The advantages of bigger nozzles become even more evident with greater layer thickness.
The mechanical properties of a part obtained by using the FDM (FFF) process depend on the filament used and may vary between different manufacturers, colors, lots and even spools within a single lot. However, dependencies obtained should be generalizable for all PLA based filaments.
The best combinations of printing conditions allowed for obtaining interlayer cohesion (the strength of a part loaded orthogonally to layer boundaries) gets close to known parameters of bulk PLA material. That resolves partially the anisotropy problem for FDM (FFF) printed parts.
Acknowledgements
The work was carried out with financial support from the Ministry of Education and Science of the Russian Federation in the framework of increase Competitiveness
Program of NUST “MISIS”, implemented by a governmental decree dated 16th of March
2013, № 211. The authors express their heartfelt thanks to their colleagues for their
References
1. Crump S., (1989) Apparatus and method for creating three-dimensional objects: US Pat. 5121329
2. Weinberg, M., (2013) Stratasys Sues Afinia: Ramifications for the Desktop 3D Printing Industry.Retrieved from http://makezine.com/2013/11/27/stratasys-sues-afinia-ramifications-for-the-desktop-3d-printing-industry/
3. The RepRap project http://reprap.org/
4. Jones R., Haufe P., Sells E., Iravani P., Olliver V., Palmer C., Bowyer A., RepRap –
the replicating rapid prototyper. Robotica, 2011, Vol. 29, Issue 1, pp. 177-191 doi:10.1017/S026357471000069X
5. Tymrak, B.M., Kreiger, M., Pearce,J. M.Mechanical properties of components fabricated with open-source 3-D printers under realistic environmental conditions, Materials & Design, 58, pp. 242-246 (2014). Retrieved from
http://dx.doi.org/10.1016/j.matdes.2014.02.038.
6. Wilson, Cody (2016) Come and Take It: The Gun Printer’s Guide to Thinking Free
7. The E-nable project: Retrieved from http://enablingthefuture.org/
8. Deng, X.; Zeng, Z.; Peng, B.; Yan, S.; Ke, W. Mechanical Properties Optimization of Poly-Ether-Ether-Ketone via Fused Deposition Modeling. Materials 2018, 11, 216.
doi:10.3390/ma11020216
9. Stephens, B., Azimi, P., Orch, Z.E., Ramos, T. Ultrafine particle emissions from desktop 3D printers. (2013) Atmospheric Environment 79, 334e339
10.Sie, G. The Olsson Block - a community invention by Anders Olsson. (2015)
Retrieved from
https://ultimaker.com/en/stories/17982-the-olsson-block-a-community-invention-by-anders-olsson
11.Nagendra G. Tanikella, Ben Wittbrodt, Joshua M.Pearce, Tensile Strength of Commercial Polymer Materials for Fused Filament Fabrication 3D Printing (2010), Retrieved from http://dx.doi.org/10.1016/j.addma.2017.03.005
12.Chacón, J.M., Caminero, M.A., García-Plaza, E., Núñez, P.J. Additive manufacturing of PLA structures using fused deposition modelling: effect of process parameters on
mechanical properties and their optimal selection (2017),
doi:10.1016/j.matdes.2017.03.065
13.Sood, A. K., Ohdar, R.K., Mahapatra, S.S. Parametric appraisal of mechanical property of fused deposition modelling processed parts. Materials and Design, Volume 31, Issue 1, pp. 287-295https://doi.org/10.1016/j.matdes.2009.06.016
14.Wittbrodt, B., & Pearce, J. M. (2015). The Effects of PLA Color on Material Properties of 3-D Printed Components. Additive Manufacturing. 8, 110–116. DOI:
http://dx.doi.org/10.1016/j.addma.2015.09.006
15.Kuehnert, I. Et al., (2016) Weld lines in Injection Molded Parts SPE Antec, Indianapolis
16.Standard Test Method for Tensile Properties of PlasticsASTM D638 ASTM D638–
17.Sun, Q., Rizvi, G.M., Bellehumeur, C.T., Gu, C.T. (2008) Effect of processing conditions on the bonding quality of FDM polymer filaments, Rapid Prototyping Journal, Vol. 14 Iss 2 pp. 72 – 80
18.Standard Test Method for Flexural Strength of Adhesive Bonded Laminated AssembliesASTM standard D 1184-98
19.PLA (general purpose) GRANTA CES (2016) EDUPACK.
http://www.grantadesign.com/education/edupack/
20.Abbotta, A.C., Tandona, G.P., Bradforda, R.L., Koernerb, H., Baurb, J.W. (2017)
Process-structure-property effects on ABS bond strength in fused filament fabrication, Additive Manufacturing, Vol. 19, pp. 29-38
21.Fafenrot S, Grimmelsmann N, Wortmann M, Ehrmann A. Three-Dimensional (3D) Printing of Polymer-Metal Hybrid Materials by Fused Deposition Modeling.