August 2017
Project Report No. 576
Improvement of soil structure and crop yield
by adding organic matter to soil
Andrew Whitmore1, Chris Watts1, Jacqueline Stroud1, Tom Sizmur1,2, Shibu Muhammed Ebrahim1, Mark Pawlett3, Jim Harris3, Karl Ritz3,4, Phil Wallace5, Ethel White6, Ron Stobart7, Blair McKenzie8,
Guy Thallon9
1Rothamsted Research, Harpenden, Hertfordshire AL5 2JQ 2University of Reading, Whiteknights, Reading, Berkshire RG6 6AH
3Cranfield University, College Rd, Cranfield MK43 0AL 4University of Nottingham, Sutton Bonington, Loughborough LE12 5NT
526 Westland, Martlesham Heath, Ipswich IP5 3SU
6Agri-Food and Biosciences Institute, 18a Newforge lane, Belfast, Co. Antrim BT9 5PX 7NIAB Huntingdon Rd, Cambridge CB3 0LE
8James Hutton Institute, Invergowrie, Dundee DD2 5DA
9Farmcare Trading Ltd. Unit 8a Longsides Barns, Haigh, Barnsley S75 4BS (previous address Produce World Group)
This is the final report of a 48-month project (RD-2012-3787) which started in September 2012. The work was funded by Defra (£300,000), Waitrose Agronomy Group coordinated by Produce
World Group and a contract for £774,999 from AHDB Cereals & Oilseeds.
While the Agriculture and Horticulture Development Board seeks to ensure that the information contained within this document is accurate at the time of printing, no warranty is given in respect thereof and, to the maximum extent permitted by law, the Agriculture and
Horticulture Development Board accepts no liability for loss, damage or injury howsoever caused (including that caused by negligence) or suffered directly or indirectly in relation to information and opinions contained in or omitted from this document.
Reference herein to trade names and proprietary products without stating that they are protected does not imply that they may be regarded as unprotected and thus free for general use. No endorsement of named products is intended, nor is any criticism implied of
other alternative, but unnamed, products.
3
CONTENTS
1. ABSTRACT ... 8
2. INTRODUCTION ... 10
3. MATERIALS AND METHODS ... 11
Field trials ... 13
Existing field trials managed by Rothamsted Research ... 14
New field trials managed by Rothamsted Research ... 15
Trials managed by partner organisations ... 18
Pot experiments ... 20
Soil type pot experiment (216 pots) ... 20
Saxmundham pot experiment (32 pots) ... 21
Quality of organic amendments ... 21
Crop measurements ... 23
Crop yields ... 23
Thousand grain weight ... 23
Oil content ... 23
Nitrogen content of grain ... 23
Soil measurements ... 24
Earthworm and soil microbiology ... 24
Soil borne diseases ... 28
Draught forces ... 28
Tension infiltrometery ... 31
Computer assisted Tomographic Scanning (CT) for soil structure ... 32
Soil sampling for CT scan ... 32
X-ray computed tomography (CT Scanning) ... 32
Image processing ... 32
Statistical analysis ... 32
Determination of response curves and yield optima ... 33
Modelling ... 34
4
4. RESULTS ... 35
Fosters field experiment at Rothamsted ... 35
Crop yields at Fosters ... 35
Crop quality ... 41
Soil physical measurements ... 46
Microbiology ... 51
Image processing ... 70
New Zealand field experiment at Rothamsted ... 72
Crop yields at New Zealand ... 72
Crop N content ... 78
Soil physical measurements ... 78
Earthworm populations ... 79
Microbiology ... 83
Pot experiments to evaluate the benefits of amending soils of differing textures ... 93
Saxmundham experiment to test whether the absence of worms leads to poor structure or whether poor structure depletes soil organisms ... 93
Woburn organic manuring experiment ... 95
Great Knott III experiment with straw ... 96
Crop yields ... 97
Soil physical measurements ... 97
Earthworm populations ... 99
Soil borne diseases ... 101
Mid-Pilmore trial (JHI) ... 102
Crop yields ... 102
Earthworms ... 102
NIAB trials at Morley (NFS) and Otley (STAR) ... 102
AFBI ... 103
Crop yield ... 103
5
Earthworms ... 104
Nutrient supply ... 105
Earthworm pot experiments ... 105
Fungicides and earthworm growth ... 106
Growers’ network ... 107
European survey ... 108
Draught forces ... 109
Fosters ... 109
Great Knott III ... 111
Modelling the response to organic amendment ... 112
Economics ... 113
5. DISCUSSION ... 115
Yield ... 115
Microbiology ... 116
Fosters ... 116
New Zealand ... 116
Comparison of microbiology of New Zealand and Fosters ... 117
Earthworms... 117
General synthesis... 118
Follow on – suggestions for future work ... 123
6. ADDITIONAL ACTIVITIES – KE ... 124
7. REFERENCES ... 128
8. APPENDICES ... 132
Appendix I. Mean grain/seed yield under different levels of organic amendments and fertilizer nitrogen in Fosters during 2013-2016 ... 132
Appendix II. Mean straw yield under different levels of organic amendments and fertilizer nitrogen in Fosters during 2013-2016 ... 135
Appendix III. Grain weight (1000) under different levels of organic amendments and fertilizer nitrogen in Fosters during 2013-2016 ... 138
6
Appendix V. Subset of Fosters experimental plots sampled for microbial
analysis ... 144
Appendix VI. Mean numbers of earthworms (log10 [number m2]) with respect to Crop x Amend x OMrate x Mixture treatment combinations (Fosters study). ... 145
Appendix VII. Fosters Microbial Biomass ... 146
Appendix VII.A: Microbial biomass means (± SE; n=2) from Rotation 1 ... 146
Appendix VII.B. Microbial Biomass means (±SE; n=2) from Rotation 2 ... 147
Appendix VIII. Fosters fungal biomass ... 148
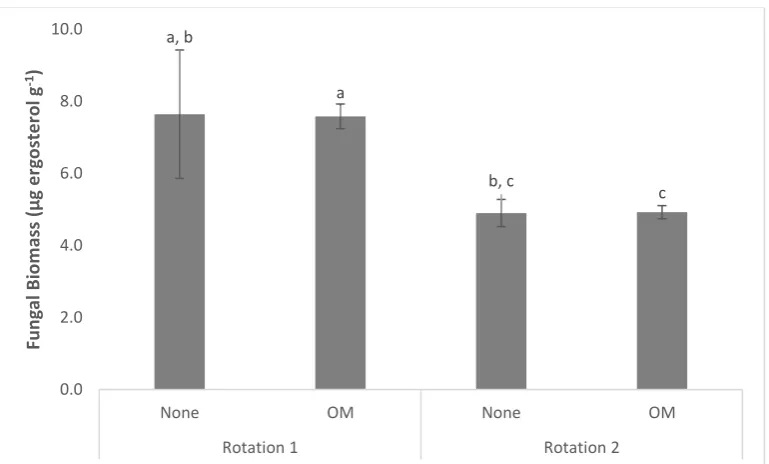
Appendix VIII.A. Fungal (ergosterol) biomass means (±SE; n=2) from Rotation 1 ... 148
Appendix VIII.B. Fungal (ergosterol) biomass means (± SE; n=2) from Rotation 2. ... 149
Appendix IX. New Zealand Microbial Biomass ... 150
Appendix IX.A. Microbial biomass means (±SE: n=3) ... 150
Appendix X. New Zealand Fungal Biomass ... 151
Appendix X.A. Fungal (ergosterol) biomass (means ±SE: n=3) ... 151
8
1. Abstract
Soil quality is intimately linked with soil biology. Recent research at Rothamsted Research (RRes) has shown that addition of Farm Yard Manure (FYM) can improve barley grain and straw yield within two years by more than 1t ha−1 each. Penetrometer measurements attribute this increase to an improvement in ease of root exploration in the soil, which, in turn, may be attributed to an increase in earthworm biomass and activity. These results suggest benefits from adding the right kind of organic matter can be achieved relatively rapidly in soils by feeding the soil organisms, which then bring about desirable changes in soil condition. We hypothesised crop yields will increase quickly (within four years) as a result of improved soil physical condition that results from feeding soil organisms, especially earthworms, with relatively small amounts of suitable organic matter additions.
To test these ideas, we set up field experiments at Rothamsted Research farm (flinty clay loam soil) in Harpenden between 2012 to 2017. The four harvest years of the project allowed three field experiments to run. These covered two tillage regimes, four arable crop rotation combinations, five nitrogen treatments and fourteen organic matter recipes at a range of concentrations. Additionally, two outdoor pot experiments, growing winter wheat under a range of earthworm amendments, seven organic matter recipes and four soil types, were studied. The influence on soil physical properties, crop yields and earthworm populations were examined on selected plots and pots. Different methods were used on selected plots to examine soil physical properties. Methods included bulk density, infiltration, penetrometer, aggregate stability, resistance to ploughing or CT scans of the pores in soil. Earthworm populations were determined on selected plots by handsorting one 20 x 20 x 20cm cube taken from a plot. Microbial biomass, fungal biomass and microbial community composition were also measured.
Five commercial growers’ trials were held at Haines Barn, Woodbridge, Butterwick, Terrington and Spalding (England). Data from three independent trials at AFBI (Northern Ireland), three at NIAB (England) and one at JHI (Scotland) were also included. These data included some yield data on cereal or horticulture cultivations, soil physical measurements and an earthworm survey.
Crop yields were determined on every plot, with a beneficial yield effect detected on both the Rothamsted trials after two years of amendments. Amended soils in a pot experiment testing the effect of soil type had more tillers and greater grain masses than unamended soils but there was no significant difference between soil types. Yield improvement in a European study did increase with texture in the order clay<silty clay loam<sand.
9
Adding organic amendments to soil in two field experiments was found to change the yield response of four crops (spring barley, winter wheat, oilseed rape, winter oats) to N. Amendments increased yields but by a greater amount in a tilled system than a system with reduced tillage. An increasing amount of amendment increased yield but there is evidence of a maximum in this response to amendment, beyond which the yield response declines. The amendments contained nutrients which helps to explain why crops yield well at low rates of mineral N application but not why they yield more overall. The full benefits from amending soil does not appear immediately and two or three years of application may be needed. Spring crops appear to benefit more than winter crops but in years when yields are good the benefits of amending soil are less clear, both in absolute and relative terms. Quality was either unaffected by amendment (N) or improved (TGW) and to the extent that might attract a premium (oil). A straightforward economic analysis suggests that acquiring and spreading amendments should cost no more than £50 t−1 C spread if amending is to be economic.
Several additional pieces of work were undertaken to try to understand why yields respond to organic amendments. Our initial hypothesis was that organisms rearrange the structure of soil to their own benefit while dwelling there and that this in turn improved the environment for crops. Amendments increased microbial biomass, earthworm biomass (g m−2) and numbers (m−2) on certain occasions but there was no overall statistical difference between amendments and no statistically consistent benefit to mass or numbers of organisms. Means to increase earthworm numbers, such as grinding up part of the amendment to make it more easily ingested by earthworms, staging the application four times per year or eliminating fungicide from the earthworm’s diet, all increased earthworm numbers and biomass but did not increase yields in the field.
All wheat crops grown with non-crop residue amendments were first wheats in these experiments. However, FYM was found to have altered N response curve of wheat in historic experiments where take-all was additionally present, such that up to 1t extra grain ha−1 was obtained.
Infiltration of water through soil was increased by amending soil, but not significantly. The plough draught forces (in kPa) were significantly reduced by amending soil and in proportion to the amount and energy content of the amendments. No significant difference, however, was found in measurements of soil mechanical impedance to a hand-operated penetrometer, nor in bulk density. However, there was no significant relationship between draught forces in autumn with the yield the following summer except, between autumn 2014 and summer 2015.
10
2. Introduction
The addition of organic matter such as Farm Yard Manure (FYM) to soil usually increases crop yields (Johnston et al., 2009) and improves fertility (Cooke, 1967) and soil quality generally (Weinhold et al., 2004). However, these benefits have been largely attributed to the nutrients contained in and added along with the organic amendments. Some work has suggested additional benefits of organic amendments, perhaps due to improvements in soil structure and the water release curve that allow roots to access water and nutrients more readily and which lead to increased porosity in soil (Johnston et al., 2009). Such findings are by no means universal and are often greater for sown rather than winter-sown crops (Hijbeek et al., 2016), possibly because of the need for a spring-sown crop to establish a root system as quickly as possible.
Part of the difficulty in establishing the benefits of added organic matter (OM) is in distinguishing the nutrient from the non-nutrient effect. In order to do this, we examine data where the yields have been measured at different rates of application of mineral N both with and without OM. In this way, it becomes possible to plot response curves to applied mineral N and calculate the amount of N (Nopt) needed to achieve optimum yield (Yopt) with and without OM. These response curves vary with season, but it is possible to assess in general whether the yield obtained with OM plus mineral N is greater than without no matter how much mineral N is applied. In much of the previous work that has found evidence of a benefit of OM (or otherwise), it is possible that insufficient mineral N to reach maximum yield was applied along with the OM. In other words, the full response curve is not described and because of this it is not possible to compare the maximum or optimum yields attainable in both cases. Indeed, the conclusion has usually been that the nutrients applied with the organic amendment lead to the same yield as with mineral N. This is eminently reasonable, but misses the potential additional response to more N still. Our key resource is a series of experimental trials where sufficient N has been given to allow us to infer the full response of crops to N and any changes that result from adding OM to soils. In these trials, we look for evidence of the mechanisms that lead to changes in the response curve.
11
amendments may create a network of pores that increase water holding capacity, increase infiltration, and decrease resistance to the penetration of plant roots.
Our overarching hypothesis is that adding organic matter to soil feeds the soil organisms which change the fertility (in the total sense of the word) possibly by re-arranging the structure of the soils to their own benefit but also to the benefit of crops exploiting the same soils.
We further hypothesised that crop yields will increase quickly (within four years) as a result of improved soil physical condition which results from addition of relatively small amounts of suitable organic matter additions. To explore these ideas, we set up a series of field and pot experiments, amended soil with organic matter and measured the yield response and changes in organisms and structure using a wide range of techniques.
Because not all farmers have access to amendments at economic prices, we investigated other means of increasing fresh OM in soil such as reduced tillage and pre-treatment of crop residues to increase the amount retained in soil.
3. Materials and methods
To test the hypotheses a mixture of existing and new experiments was used (Table 3.1). The existing experiments have associated historical data which was used to support the analyses carried out in this research, but the treatment structure was not altered in any way. The new trials were set up with treatments specifically chosen to test our experimental hypotheses. Field and pot experiments were set up and the pot experiments embraced trials under both ambient and controlled environmental conditions.
Table 3.1. Summary showing the details of different experiments used in this study
Trial name Location Purpose Treatments
Existing trials
Broadbalk LTE (1852- present)
RRes, Harpenden
To study the effect of FYM and inorganic fertilizers on wheat yield
FYM: 0- 3 t C ha−1 Fertilizer N: 0-288 kg N Hoos Barley LTE
(1852- present)
RRes, Harpenden
To study the effect of FYM and inorganic fertilizers on spring barley yield
FYM: 0- 3 t C ha−1 Fertilizer N: 0-144 kg N Woburn LTE
(1964- present)
RRes, Woburn
To study the benefits of applying organic amendments to soil and crop yield
Organic matter (compost, peat, straw, leys and FYM): 0-3.5 t C ha−1
12 Fosters
(2013-present)
RRes, Harpenden
To study the effect and residual effect of organic amendments along with
inorganic N fertilizer on soil and crop yield
Organic matter (Compost, Anaerobic digest, straw, FYM and straw in combination with other organic amendments): 0 - 3.5 t C ha−1
Fertilizer N:0-260 kg N ha−1 (depending on the crop) New Zealand
(2013- present)
RRes, Harpenden
To study the effect and residual effect of organic amendments along with
inorganic N fertilizer on soil and crop yield
Organic matter (Compost, and FYM): 0 - 3.5 t C ha−1
Fertilizer N:0-260 kg N ha−1 (depending on the crop) Great Knott III
(2013-2015)
RRes, Harpenden
To study the effect straw application on soil and crop yield
Straw: 1.8-7.3 t C ha−1
Trials managed by partner organisations
Sustainability trial for arable rotations (STAR)
(2005- present)
Otley, Suffolk Cultivations and rotations for sustainable farming
Four rotations: Winter cropping, Spring cropping, Continuous wheat and Alternate fallow. Four cultivation methods: Annual plough, Managed approach, Shallow tillage and Deep tillage. New Farming
Systems (2007-present)
Morley, Norfolk
Rotations to improve sustainability, resilience and outputs
Three rotations: Winter break, Spring break and Mixed cropping Four management systems: Current, legume, Current plus brassica cover crop, and current plus legume cover crop
Three N managements: Untreated, Half dose, and full dose.
Mid Pilmore (2003-present)
Perthshire, Scotland
To study the effects of different tillage methods on production
Five soil tillage practices with cultivation to a range of depths: 0 cm (no-till) to 40 cm (deep plough).
Two fertiliser levels: 90 and 180 kg N ha−1
Saxmundham NIAB, Cambridge
To test the effects of rotations and additions of organic matter on yields
13 Agri-Food
BioSciences Institute of Northern Ireland (AFBI)
Northern Ireland
To test the effects of slurry and manure on cropping under conventional and ploughed systems.
Various organic amendments versus mineral nutrition
Pot experiments
Soil type pot experiment
RRes, Harpenden
To study the benefits of applying organic amendments to soil and crop yield
Organic matter (Straw,
anaerobic digest, compost, FYM, and straw in combination with other OM amendments): 0-3.5 t C ha−1
Saxmundham pot experiment
NIAB, Cambridge
To study the effect of FYM on wheat yield
Recent FYM, LT FYM and added earthworms
Existing experiments on the addition of FYM to winter wheat on Broadbalk field and spring barley on Hoos field at Rothamsted Research (RRes) have been described elsewhere (e.g. Johnston et al., 2009), on the use of FYM at Saxmundham (Cooke and Williams, 1971), on the addition of different organic amendments on a sandy loam soil at Woburn (Mattingley,1974), on tillage at Mid-Pilmore (Newton et al., 2012), and at Morley and Otley (Stobart et al., 2016, Stobart et al., 2014, Morris et al., 2014, Hallett et al., 2014). A range of trials under different climates from a European project (Hibeek et al., 2016) has also been included in the synthesis of the results in order to assess the wider applicability of the results beyond the climate of SE England where the majority of the field experimentation took place.
There were two pot experiments under ambient conditions, both growing winter wheat. One experiment tested the 4 different OM amendments applied to Fosters but on three contrasting soil types in order to evaluate the effect of texture more widely than at Rothamsted but more economically than by setting up other field trials elsewhere. The other pot experiment tested the specific effect of adding earthworms or FYM on yields from heavy soils where earthworms were less abundant than might be expected. A range of smaller pot experiments were also carried out to test specific ideas relative to the growth of earthworms under laboratory conditions with a view to suggesting measures that might improve earthworm numbers in practice.
Field trials
14
on the same area (GPS located) over the 4-years of the project and covered a range of tillage, arable rotations, organic matter recipes and amounts, and nitrogen levels.
The soil in all three experiments as well as on the long-term Broadbalk and Hoos field trials is a well-drained Batcombe series flinty silty clay loam (average 25% clay, but somewhat variable) over clay with flints, latitude 51.8oN longitude 0.4oW in the East of England at an altitude of 130m with mean annual temperature of 10oC and mean annual rainfall of 700mm.
In addition, trials were established on commercial fields (Section 4.11) on a range of soil types in the East of England.
Data from other fields managed by Rothamsted Research, by NIAB and the James Hutton Institute were also used in this study.
Existing field trials managed by Rothamsted Research
3.1.1.1 Broadbalk wheat (RRes)
The Broadbalk field experiment has tested the effect of different rates of nutrients (chiefly N) in combination with different management practices (rotation and pest control) on yield of (mainly) winter wheat, among other treatments, since 1843. FYM has been applied at the annual rate of 35 t ha-1 (fresh material) along with two different rates of mineral N throughout (i, N0 and ii until 2005, N2, thereafter N3). Between 1985 and 2000 an additional N rate (N4) applied to wheat grown in rotation also received FYM. These plots were used to test the hypothesis that application of FYM ameliorates the effect of Take All (Gaeumannomyces graminis) on yield. Plot size is 24.38 x 5.3 m for the mineral N plots, 24.38 x 2.85 m for the FYM plots. Harvested area is 0.00512 ha in both cases.
3.1.1.2 Hoos barley (RRes)
Hoos field has grown spring barley since 1852 comparing yields on plots that receive both mineral N and dressings of either 0 or 35 FYM t ha-1 in the autumn. Additional plots were set up in the year 2000 that replicate the FYM treatments. However, they differ in that levels of native soil organic matter are much less than in the existing long-term FYM plots. It was the observation that yields on these plots, established in 2000, increased rapidly as a result of amendment that led to the current research proposal on which we now report.
3.1.1.3 Woburn organic manuring experiment (RRes)
15
soil in four replicated blocks in conjunction with different rates of application of N. The experiment is run on a contrasting soil to Rothamsted – a loamy sand – and as such crops are much more subject to drought than they would be in the deep silty clay loam at Rothamsted. The experiment makes use of different amendments (compost, peat, straw, leys) and FYM applied at two different rates. However, periodic changes in experimental setup and treatments mean that not all amendments (e.g. compost) have been applied throughout the 50-year duration of the experiment. The blocking has changed too, as has the complexity of the experiment. The value for the current research is that there is thus a scale of both carbon in the amount of amendment applied and N fertiliser applied giving the potential to investigate the response of crops to different rates of added organic matter as well as to N. This scale of amendment in not present in the other long term experiments at Rothamsted, although it has been imposed on the new AHDB-funded Rotations Partnership experiments. The WOM experiment is run as a rotation and there are confounding effects of year and crop that must be acknowledged in understanding the experimental results. In an attempt to account for these confounding effects we also ran a computer simulation model (Dailey in preparation, Coleman et al submitted) of the most important processes in the soil-crop system, to try to understand and generalise the benefits of applying organic amendments to soil.
New field trials managed by Rothamsted Research
3.1.2.1. Fosters field experiment (2 crops x 2 blocks x (5 N rates x 4 OM types + 5 OM
rates x (4 OM types +3 mixtures)) =220 experimental plots)
On Fosters field, located at Rothamsted Research farm, 220 ploughed plots tested 5 rates of addition of 4 kinds of organic matter (OM) amendment and 3 mixtures with straw, and with the background N-response measured at 5 rates of N. Two arable rotation series were compared in two replicate blocks, with half the field sown with each crop in 220 plots (Table 3.1.1). The soil has a total organic C of 1.6 % and pH of 6.99.
Crop details
Table 3.1.1. Cropping details on Fosters field.
Block 2013 2014 2015 2016 20171
W Rotation 1 Winter Wheat, ww
Spring Barley, sb
Winter Oats, woats
Winter Wheat, ww
Winter Wheat, ww
E Rotation 2 Spring Barley, sb
Winter Oilseed Rape, osr
Winter Wheat, ww
Spring Barley, sb
Winter Wheat, ww
16 Table 3.1.2.Treatments on Fosters field
Organic matter Carbon rate (tonnes C
ha−1)
Nitrogen rate (kg N ha−1) N0-N4, rates vary with crop but are reckoned in relation to RB209 guidance, such that N3 is the recommended rate
Straw N0-N4,
Anaerobic digestate N0-N4
Anaerobic digestate + Straw N3
Compost N0-N4
Compost + Straw N3
Farmyard manure N0-N4
Farmyard manure + straw N3
Trial details
The trial is managed using a conventional regime (fertiliser, pesticides) and is tilled by ploughing. Both the organic amendments and nitrogen treatments (Table 3.1.2)were applied by hand each year in the autumn (farmyard manure was chopped first with a muck spreader).
3.1.2.2 New Zealand field experiment (3 replicates x (3 rates of 2 types of OM x 5 rates of
N including shared OM and N controls) = 75 experimental plots)
On New Zealand field, two amendments at 3 rates of application were tested under reduced tillage with a similar assessment of the response to added N fertiliser.
Crop details
The crop rotation for the New Zealand experiment was spring barley (2013), winter oilseed rape (2014), winter wheat (2015), spring barley (2016: with no organic amendments) (Table 3.1.3). The organic amendments were applied to the same plots year on year, however the mineral N rotated hence different plots were sampled between years (Table 3.1.4).
Table 3.1.3. Cropping details on New Zealand field.
2013 2014 2015 20161 20171
17 Table 3.1.4. Treatments on New Zealand field.
Organic carbon: Nil Compost Farmyard Manure
Amount (kg C ha-1) 0 2.5, 3.5 2.5, 3.5
Nitrogen (kg N ha-1) Five rates, 0 up to 260 (depending on crop type)
Trial details
The trial was managed using a conventional regime (fertiliser, pesticides) under minimum tillage between 2013 and 2016. For tillage, a Lemken Karat stubble cultivator consisting of tines, discs and a crumbler roll was used at a depth of ca. 10 cm. Both the organic amendments and nitrogen treatments were applied by hand (farmyard manure was chopped first with a muck spreader).
3.1.2.3 Great Knott III field experiment (4 blocks x (2 rates of straw x 3 pre-treatments + 1
control) =28 plots)
On Great Knott III, the growth of winter wheat established under conventional tillage was examined in relation to a number of novel ways of pre-treating crop residues before incorporation.
Crop details
The crop rotation for Great Knott III fieldwas winter wheat for all the three years during 2013-2015 (Table 3.1.5). Wheat straw was applied at different rates as part of the treatments (Table 3.1.6).
Trial details
The trial was managed using a conventional regime (fertiliser, pesticides) and tilled by ploughing. Nitrogen was supplied as two splits at the recommended RB209 levels.
Table 3.1.5. Cropping details on Great Knott III field.
2013 2014 2015
18 Table 3.1.6. Treatments on Great Knott III field.
Amount (t straw ha−1)
2013 2014 2015
0 Nil Nil Nil
4.5 No chop Normal - chop 90%, grind
10% (application: initial 25% total followed by 3 staged applications of remainder winter/spring)
Normal - chop 90%, grind 10% (application: initial 25% total followed by 3 staged applications of remainder winter/spring) 4.5 Normala - chop 90%,
grind 10%
Normal - chop 90%, grind 10%
Normal - chop 90%, grind 10%
4.5 Normal, conditionedb Normal - chop 100 % Normal - chop 100 %
19 No chop 4x Normal - chop 90%,
grind 10% (application: initial 25% total followed by 3 staged applications of remainder winter/spring)
4x Normal - chop 90%, grind 10% (application: initial 25% total followed by 3 staged applications of remainder winter/spring)
19 4x Normal - chop
90%, grind 10%
4x Normal - chop 90%, grind 10%
4x Normal - chop 90%, grind 10%
19 4x Normal,
conditioned
4x Normal - chop 100 % 4x Normal - chop 100 %
a as obtained from the field
b Rolled in order to split open the straw and permit easier colonisation by fungi
Trials managed by partner organisations
3.1.3.1. STAR, NFS (NIAB)
19
the contrasting farming system based approaches. The primary focus of this work is around the interaction of crop yield and tillage.
The STAR and NFS sites are fully replicated randomised designs using large plots and farm scale equipment. While soil types differ (STAR - heavy soil, clay loam; and NFS - medium soil, sandy loam) tillage approaches are common to both studies; systems used are plough (inversion to c. 20 cm), deep non-inversion (to c. 20 cm) and shallow non-inversion (to c. 10 cm). Both studies use a common cropping approach of winter wheat every other year with combinable break crops in intervening seasons. The crop rotation (choice of combinable break crop) varies within and between studies. Further detail of treatment, system and findings for STAR and NFS can be found in Stobart et al. (2014) and Morris et al. (2014).
3.1.3.2. Mid-Pilmore (JHI)
Reduced tillage for arable cropping is increasingly common in the UK and is the focus of our investigations at this site. The effect of tillage intensity on earthworm populations is not well known so we used this experiment at Mid Pilmore (Perthshire, Scotland) to look at the effects of tillage on yields.
3.1.3.3. Saxmundham
The Saxmundham experiment is a resource now run by NIAB which tested the effects of rotations and additions of OM but has been under grass for the last two years for lack of the resource to manage it. The soil is of Beccles series similar to the STAR trial and close in distance. This particular soil is problematic to manage because it readily forms large clods that do not weather down because of the unfavourable (i.e. not sufficiently heterogeneous) distribution of pores. Rothamsted observations of this soil were that structure improved marginally with OM addition but these improvements did not result in yield increases (Cooke and Williams, 1971). Earthworms and other macrofauna were largely absent. It is not clear if the structure was poor because of the absence of worms or if the poor structure precluded colonization by soil macro-organisms.
20
elsewhere. Whether it is the relative absence of worms that leads to the relative absence of SOM it is not possible to say.
3.3.3.4 AFBI
Trials at the Agri-Food BioSciences Institute of Northern Ireland test the effects of slurry and manure on cropping under conventional and ploughed systems and in particular the availability of N to the crop receiving amendments and to subsequent crops. The trial compared crops that continued to receive amendment with crops that received amendment in the initial or initial two years only. The cropping and the amendments differed by site: at Hillsborough winter wheat in 2013 was amended with broiler litter, hen manure or pig slurry, subsequent crops in 2014 (winter barley) and 2015 (spring wheat) received compost across all plots. At Downpatrick spring wheat in 2013 was grown with and without broiler litter and additional fertiliser applications and was followed by winter barley (2014) again with and without broiler litter and additional fertiliser applications; maize was grown in 2014 and not harvested. At Crossnacreevy spring barley in 2014 was amended with either pig or cattle slurry or AD and followed in 2015 by winter barley + spring barley (because of poor establishment) with plots to which the amendments are applied and others from which amendments were withheld. The later sowing of spring barley in 2015 resulted in it not being harvested.
Pot experiments
Two outdoor pot experiments were conducted in outdoor protected sand beds under ambient temperature conditions at Rothamsted Research. Plant yields were compiled per pot. The components of yield were recorded: the number of plants, number of ears, grains per ear, and total grain weight.
Soil type pot experiment (216 pots)
21 Table 3.2.1. Treatments for soil type pot experiment.
Organic matter amendments Carbon rate
(tonnes C ha-1)
Nitrogen rate (kg N ha-1) Straw
Anaerobic digestate
Anaerobic digestate + Straw Compost
Compost + Straw Farmyard manure
Farmyard manure + straw
Saxmundham pot experiment (32 pots)
We obtained soil from the plotsin Rotation I of the Saxmundham field experiment, inferred from Trist and Boyd (1966) and Salter and Williams (1969) in the Saxmundham experiment (Beccles series, Trist and Boyd, 1966) that had received either 13.5 t FYM ha−1 (6 tons acre−1) or none and combined these background treatments with new interventions of either earthworms or none and freshly added manure or none and set up a pot experiment with four-fold replication. One winter wheat plant was established per pot and the soils were amended with either farmyard manure (25 t ha−1) or 5 endogeic earthworms (30 g m−2) or both farmyard manure and earthworms, and a control (no amendments). All pots received 160 kg N ha−1. The pots were watered, weeded and harvested by hand.
Quality of organic amendments
Quality of organic amendments used in the experiments were analysed for C, N (Table 3.3.1) and energy contents (Table 3.3.2) for different years of the experiment.
22
Table 3.3.1. Carbon and nitrogen content (%) of different organic amendments applied in Fosters and New Zealand during 2013-2016.
2013 2014 2015 2016 average
N C C:N
ratio
N C C:N
ratio
N C C:N
ratio
N C C:N
ratio
N C C:N
ratio AD 2.43 41.67 17.14 1.03 43.00 20.52 1.95 43.05 22.10 1.50 43.35 28.90 1.73 42.77 24.75 compost 1.39 29.33 21.07 2.10 25.31 24.52 1.62 19.83 12.23 1.48 19.51 13.17 1.65 23.50 14.26 FYM 2.71 30.80 11.38 2.13 21.88 10.27 2.01 42.13 20.96 2.77 37.14 13.39 2.41 32.99 13.72
straw 0.50 45.91 92.20 0.70 44.64 63.40 0.80 43.96 55.16 0.53 44.57 84.40
OSR residues
0.72 45.03 62.96
Wheat straw
0.53 44.57 84.40
barley straw
0.69 46.83 67.77
Table 3.3.2. Energy content of amendments measured by using bomb calorimetry.
Sample
Cellulose g/100g dry
matter Gross Energy (MJ/kg)
Barley straw 35.81 17.03
Farmyard manure 15.9 12.51
Anaerobic digestate 7.9 11.46
Compost 4.38 7.964
Wheat straw 35.81 16.38
23
Crop measurements
Crop yields
All plots in all years were harvested using a Sampo 2010 plot combine over an area of 9 m x 2 m from the centre of each plot (undisturbed by soil sampling) but note additional harvest in 2014, below. Moisture content was assessed, and yields were expressed at 85% dry matter for cereals and 90% dry matter for oilseeds (Appendix I and Appendix II). To check the nutrient composition of the cereals, grains and straw were oven dried at 80 °C for 48 h after collection and ground to <0.5 mm using a stainless steel centrifugal mill (Retsch 400). To assess the total N content, subsamples of spring barley were analysed by LECO (TruMac Combustion Analyser). An analytical replicate was performed for every ten samples for quality control of the procedure, with an acceptable 3.4 ± 0.9 % difference, well within the tolerance limit of <5 %. In 2014, there was a problem with the Sampo and yields were collected from the discard with a Haldrup over a 1 x 9 m strip. Although these data were less variable than the data collected with the Sampo there was no difference in the statistical analysis.
Thousand grain weight
The thousand grain weight (TGW) is the weight in grams of 1000 cereal kernels, determined using an automatic grain counter (Numigral 1, Chopin Technologies, France). After counting, the grain is dried overnight at 105 degrees C. The TGW for all these crops for different years were given in Appendix III.
Oil content
Water and oil content was determined from paired 6 g (8 ml) OSR seed samples taken from the harvested sample of each plot using a Minispec mq-20, pulsed time-domain NMR analyser (Bruker-BioSpin, Rheinstetten, Germany). Due to the different relaxation decays of the neutrons in the various sample components, moisture and oil can be detected and clearly distinguished. Initial calibration was obtained using OSR seed samples of different water and oil contents that were previously analysed by a wet-chemical method. Oil contents were corrected based on a standardised seed water content of 90 g/kg (Appendix IV).
Nitrogen content of grain
24
Soil measurements
Earthworm and soil microbiology
3.5.1.1. Earthworms
There was some variation between the methods used to sample for earthworms. The general methodology is described below and deviations from it described with the relevant field, pot or laboratory experiment.
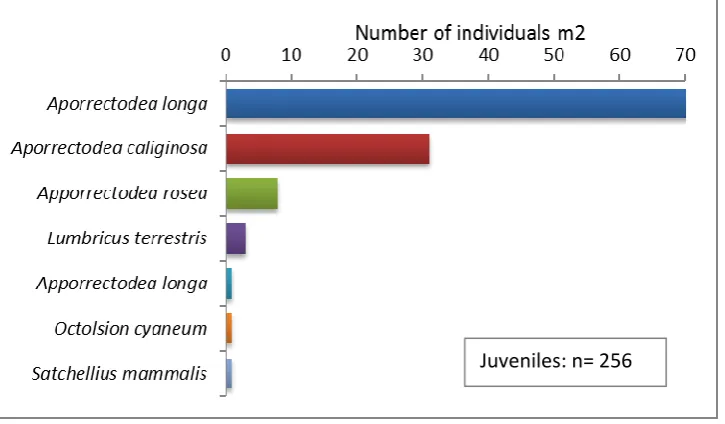
Earthworms were sampled based on the BS EN ISO 23611-1:201 Soil was sampled as a cube of 20 cm x 20 cm x 20 cm (w x b x d) and immediately sorted by hand to enumerate both the total and species level population density (abundance) and biomass. Earthworm species were identified using the OPAL Open Air Laboratories system. Prior to biomass estimates, earthworms were washed in deionised water to remove surplus soil and then blotted on tissue paper to remove surplus water prior. The earthworms were then weighed on an analytical balance (4DP). Mustard extractions were attempted at earlier stages of the experiment, however, this was discontinued as the mustard solution did not percolate into the soils effectively and the time of infiltration was very variable.
For the Fosters experiment, only plots involving the N fertiliser application rate at RB209 (Defra Fertilizer Guidance) but including the plots amended with straw mixtures were assayed for earthworms. Factorial nested ANOVA was applied to the entire datasets using time, crop, presence/absence of OM amendment of any form (‘Amend’), OM rate, and straw: other organic material mixtures (‘Mixture’) as treatment terms.
For the New Zealand study, worms were assayed twice per annum in 2014 and 2015. Frequency and biomass data were analysed by factorial nested ANOVA using time, presence of organic amendment ('Amend'), OM rate, OM type and N fertilisation rate as factors.
For the Mid-Pilmore trial (JHI), we measured earthworm populations in the final year of a long-running (14 years) spring cropping field trial managed using different tillage intensities (zero tillage, shallow non-inversion tillage (<7 cm), conventional ploughing (20 cm), conventional ploughing followed by compaction, and deep ploughing (ca. 35 cm) to investigate the effects of spring tillage and tillage intensity on earthworm populations. We used two methods to estimate earthworm populations (hand sorting and mustard extractions).
3.5.1.2. Soil microbiology
25
plots were re-sampled to determine treatment effects at various times throughout the trial (Table 3.5.1)
Five soil samples (10 cm diameter to 10 cm depth) were randomly taken within each designated plot using a trowel, but avoiding a central plot strip (1 m wide) to avoid damage to the crop and so affecting yield estimates. Resultant soil samples were homogenised from within each plot, passed through a 2 mm sieve and stored at 5°C until analysis. This mode of sampling was repeated for each plot.
Table 3.5.1.Plot sampling dates for microbiology
New Zealand Fosters
Time period Sampling
date Crop
Sampling
date R1 Crop R2 Crop
Baseline survey
9th/10th April 2013
Spring Barley
9th/10th April 2013 Winter Wheat: drilled 08/11/12, harvested 18/08/13 Spring Barley drilled 21/02/13 harvested 19/08/13 Autumn 2013 28th October Winter OSR 11th November1 waiting for Spring Barley Winter OSR drilled 13/08/13
Spring 2014 1st May Winter OSR
1st May1 Spring Barley: drilled 12/03/14 harvested 06/09/14 Winter OSR: harvested 14/07/14 Autumn 2014 15th October Winter Wheat 18th November1 Winter Oats:
drilled 22/10/14 Winter Wheat: drilled 25/09/14 Spring 2015 5th May Winter
Wheat
17th April1 Winter Oats: harvested 04/08/15 Winter Wheat: harvested 17/08/15 Autumn 2015 28th November Spring Barley 20th November: Rotation 1 only2 Winter Wheat: drilled 15/10/15 waiting for Spring Barley
Spring 2016 Not sampled
Spring Barley
6th April Winter Wheat, harvested 11/06/16 Spring Barley: drilled 17/03/16 harvested 23/08/16
1 anaerobic digestate plots not sampled, 2 rotation 2 not sampled.
26
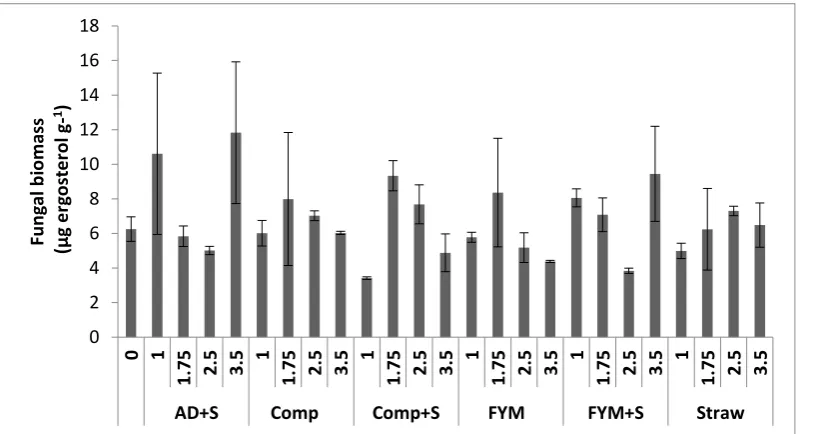
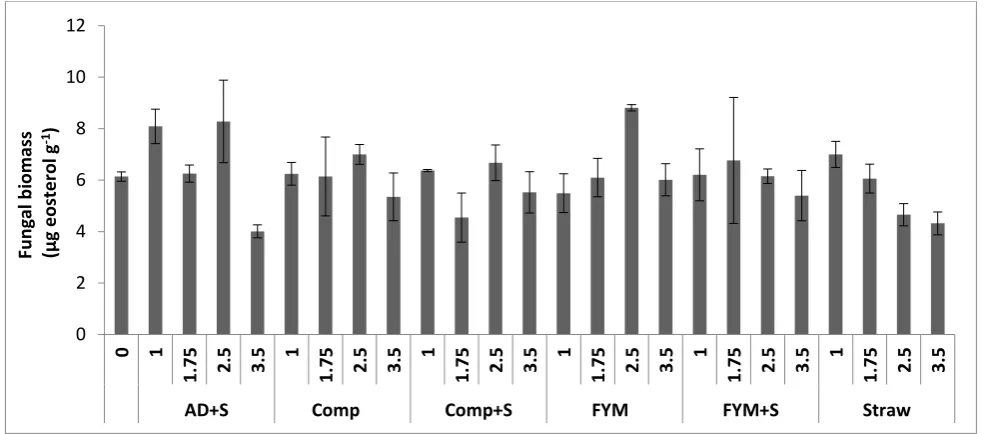
Organic amendment type (seven types): i) straw, ii) compost, iii) compost + straw, iv) farmyard manure (FYM), v) FYM + straw, iv) anaerobic digestate (AD), vii) AD+ straw Organic amendment rate (four rates): 1, 1.75, 2.5, 3.5 t C/ha
Control with no organic matter but mineral N applied at RB209 Control with no organic matter or mineral N applied
Soils were sampled from plots on the experiment on New Zealand field (Table 3.5.2) from the following treatments (three replicates):
Organic amendment type: Compost and FYM Organic amendment rates: zero, 2.5 and 3.5 t C/ha
Table 3.5.2. Subset of New Zealand plots sampled for microbiology analysis. Note that plots receiving different N rates rotate over the years of the experiment in the sequence N3-> N2-> N1-> N0-> N4, so that previous year’s fertilizer rate does not have a residual influence on results. OM treatments do not rotate
OM
Type
OM rate
(C t/ha)
N rate
(kg
N/ha)
Autumn
2013
(no crop)
Spring
2014 (SB)
Autumn
2014
(OSR)
Spring
2015
(OSR)
Autumn
2015
(WW)
27 3.5.1.3. Microbial methods
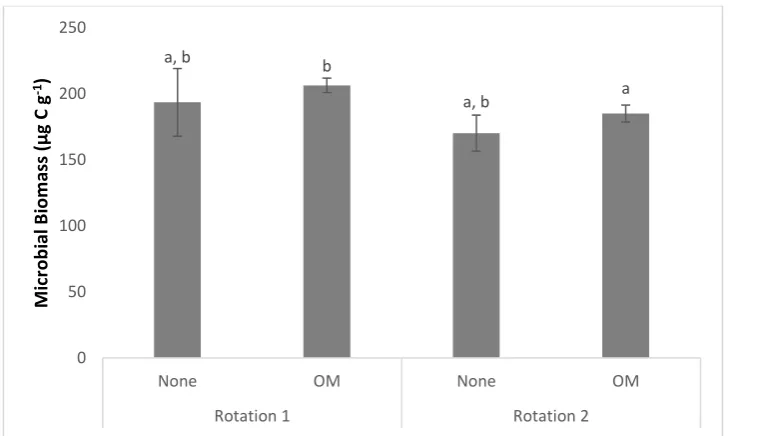
Microbial biomass-C was determined using the fumigation-extraction procedure (Jenkinson & Powlson 1976) using the KEC of 0.45 (Vance et al. 1987). Carbon was extracted with 40 ml of 0.5 M potassium sulphate, and analysed using a Burkard Scientific SFA-2000 Segmented Flow Analyser.
Phospholipid fatty acid analysis (PLFAs) provides a community structure profile (fingerprint) by identifying fatty acid biomarkers (extracted from phospholipid membranes) unique to the membranes of microorganisms. The relative abundance of these fatty acid biomarkers is used as a profile of the microbial community, because specific fatty acids can be used as indicators for the presence of groups of organisms within the soil microbial community. In this study, PLFA profiles were determined using an adaptation of the Frostegård et al. (1993)method as described in Pawlett et al. (2012). Lipids were extracted from approximately 7 g freeze-dried soil using the Bligh and Dyer solvent ratio of chloroform, methanol and citrate buffer (ratio 1:2:0.8 v/v/v), fractionated by solid phase extraction, and the phospholipids derivatised by mild alkaline methanolysis. The resultant fatty-acid methyl esters (FAMEs) were separated by gas chromatography (Agilents, USA) using a HP-5 (Agilent Technologies) capillary column (30 m length, 0.32 mm ID, 0.25 μm film). The temperature program started at 50°C (1 min), to 160°C at 25°C/min, followed by 2°C/min to 240°C and 25°C/min to 310°C (10 min). The injector temperature was set at 310°C, Flame Ionization Detector set at 320°C, and He flow set at 1 ml/min. The resultant FAMEs were calculated as relative abundance (mol %). Fatty acids were identified by comparison of sample retention time to a standard qualitative bacterial acid methyl ester mix (Supelco) and by using gas chromatography coupled with mass spectroscopy (Agilent, USA). Indicator fatty acids included: the sum of i15:0, ai15:0, 15:0, 16:1, i16:0, 16:19, 16:17 t, i17:0, ai17:0, cyc-17:0, 17:0 and cyc-19:0- total bacteria (Frostegård and Bååth 1996), the sum of the iso and anteiso branched fatty acids i15:0, ai15:0, i16:0, ai16:0, i17:0, ai17:0- Gram-positive bacteria (Zelles 1999), and the sum of 16:1, 16:19, 16:17c, 16:17t, 16:15, 21:1- Gram-negative bacteria (Zelles 1999).
28
(phenomenex, Macclesfield, UK). Ergosterol was calculated as “Recovery percentage” = [(Ergspike – Ergsoil)/Ergadded] × 100.
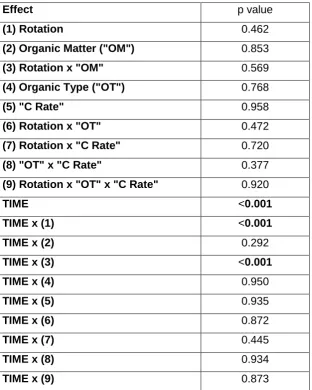
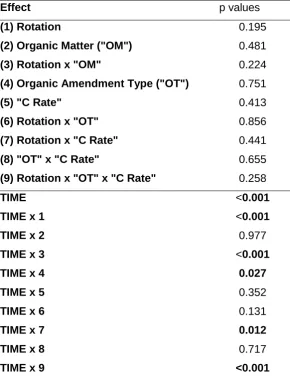
3.5.1.4. Statistics (for microbiology)
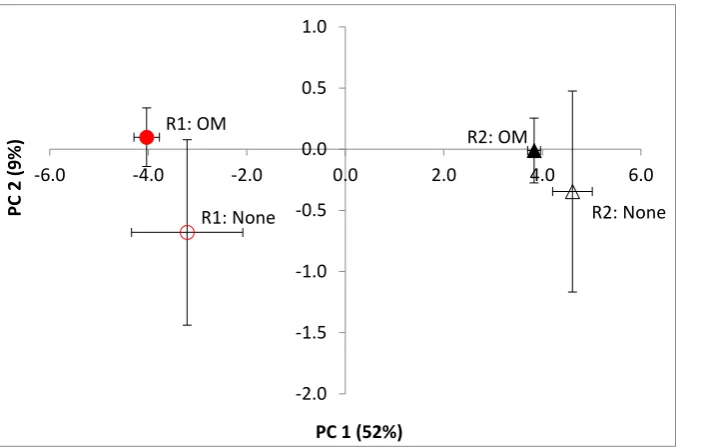
Total microbial biomass and fungal biomass data were analysed by analysis of variance (ANOVA) via General Linear Models (GLM) followed by post-hoc Fisher LSD. PLFA data was analysed using principal component analysis (PCA) followed by ANOVA of the resultant PC factor scores to determine whether there were any significant effects of the experimental design on the PC factor scores. The time effect was explored using repeated measures ANOVA (RM_ANOVA) through GLM. Data was nested to include the control (unamended by organic fertilisers) plots. Statistics were performed using Statsoft, Inc. (2012) STATISTICA version 11 (data analysis software system),
with an alpha value of 0.05.
Soil borne diseases
The original experimental protocol did not include a test of the effect of amendments on soil-borne diseases and the rotations were chosen to avoid the complication of a second (or third) wheat in the series. However, the long-term experiment on Broadbalk field provides the opportunity to test the effect of FYM at 35 t ha-1 year-1 on yields in rotation and after 2 or 3 years. There are several differences with this set of data compared with the systematically designed experiments on Fosters and New Zealand fields, however. There are currently two series of plots that receive FYM (at 0 and 96 kg applied mineral N ha-1 in addition to the FYM) where wheat was grown in rotation but between 1985 and 2000 there was a third series (at 192 kg N ha-1). Three data are not sufficient to fit four parameters in the linear plus exponential (lexp) model for the N response curves (Eq [1], section 3.7.1). Data from the plots receiving mineral N only (7 rates N between 1985 and 2000) were pooled with the data from the plots receiving FYM giving 10 data in all. Separate values of A, B, and C were fitted to each dataset but a common value of r (Eq. [1]), giving 7 parameters, 10 data and so 3 degrees of freedom. A take-all rating score was derived (TAR) as described by Dyke and Slope (1978). Roots were examined after washing and plants with take-all graded: slight (less than 25% of roots infected), moderate (25-75%), severe (more than 75 %); the proportion of roots infected was estimated, roots were not counted. From these gradings a weighted 'take-all rating' (TAR) was calculated: TAR = % plants with slight infection + 2 (% moderate) +3 (% severe); thus maximum TAR = 300.
Draught forces
29
requirements (Watts et al., 2006; Liang et al., 2013; Peltre et al., 2015). Inputs of above- and below-ground crop residues and organic amendments affect soil bulk density, tensile strength, clay dispersibility and soil cohesion (Schjønning et al., 1994, 2012; Munkholm et al., 2002) and thereby also tillage draught. Soil water content is known to play a key role in soil friability and draught force requirements (Watts & Dexter, 1994; Perfect et al., 1997; Arvidsson et al., 2004; Munkholm, 2011). More recently Peltre et al (2017) found:
Draught force was significantly smaller in the spring than in the autumn. In the autumn when soils were drier, and specific draught was correlated with several soil characteristics, whereas water content was the dominating parameter in the spring when soils were wetter.
In the autumn and spring, SOC normalized by clay content explained 38 and 5% of the variation in specific draught, respectively.
Specific draught did not differ significantly among individual fertilization treatments.
SOC was closely correlated with clay and water contents and bulk density, and with yield of the preceding wheat.
In previous work, we found that the forces required to pull a plough through the soil could detect differences in the amounts of organic matter in the long-term Broadbalk experiment at Rothamsted (Watts et al 2006). In this work a coupling was used between the plough and power take-off made from a block of solid steel and equipped with sensors to detect the forces transmitted through the plough because of its interaction with the soil (Scholz, 1966). The forces recorded depend on the forward motion of the tractor and on soil factors such as texture, water content and organic matter. The solid steel block is expensive and heavy for farmers to deploy and we sought a simpler, if still experimental design, based on a lightweight frame
3.5.3.1 Equipment
30
that is proportional to the plough-implement speed. This frequency is converted to a voltage within a data logger enclosure that is fitted inside the tractor cab.
All the load, depth and speed sensing transducers are connected to a data logger (OM-LGR-5325, OMEGA Eng., Manchester, UK) via a removable umbilical. The data logger is mounted in an enclosure box which also contains a stabilised power supply unit, a frequency converter, a fuse block and multi connectors. Power for the box is supplied via a cable which plugs into the in-cab tractor accessory socket. Data from the sensors is collected at 10 Hz.
Figure 3.1 Images of the draught sensing frame in place between the tractor and the plough
3.5.3.2 Field operation
31
The Fosters experiment was ploughed up and back in the normal way for a reversible plough. Each run crossed a strip 10 plots and the tramlines between them and two data sets were collected (only in one direction) for each strip of 10 plots. This procedure was repeated until the whole experiment had been ploughed and 44 data sets had been collected with all 220 plots ploughed. An extra channel on the data logger was used to mark the start and finish point when the tractor crossed a start and finish datum lines. Data was transferred from the logger to a laptop for processing.
3.5.3.3 Pre-processing data sets
Pre-processing involved converting speed measurements on each data set into distances and calculating the boundaries of each plot, then confirming the start and finish points with the correct distance apart. Once the plot boundaries had been determined, we selected a datum some 3 m from this boundary (allowing the plough to be fully inside the plot) to a point where the front furrow of the plough was about to leave the plot. This was typically 50 data points. Two sets of mean values of the each of the 5 sensors were determined for each plot. It is noteworthy that the original data sets showed a sharp increase in draught as the plough crossed the tramlines or a reduction in draught if the tramlines had been sub-soiled.
Draught force D, (kN) were determined by summing the horizontal force derived from each pin, depth d, (m) from the depth sensor calibration. Here we are interested in specific draught S, (kPa) as measure of soil strength. S for each plot is calculated by dividing mean draught, 𝐷̅ by the product of width of ploughing, w (3 x 0.36 = 1.09 m) and the mean depth 𝑑̅.
Tension infiltrometery
32
Computer assisted Tomographic Scanning (CT) for soil structure
Soil sampling for CT scan
Fosters trial is a 220 plot complete randomised block design, and 12 plots were chosen for analysis. These were the controls (no organic amendment) at nil (n = 2 plots) and at the recommended fertiliser rate 190 kg N ha−1 (n = 2 plots), and the organic amended plots at the recommended fertiliser rate (as above): anaerobic digestate (n = 2), compost (n = 2), farmyard manure (n = 2) or oat straw (n = 2) applied at 2.5 t C ha−1. These organic matter treatments had been applied each Autumn and ploughed in for the previous four years prior to soil sampling for this analysis. The high number of flints in this soil preclude soil core collection, thus soil clods were analysed. One large (20 cm x 20 cm) soil block per plot was collected at pre-harvest using a 14 cm wide gardening fork the day before analysis. The vertical orientation was maintained and the block was broken by hand (along natural aggregates) to make a ca. 10 cm x 10 x 8 cm clod. This was placed in a small plastic box (11 cm x 11 cm x 10 cm) for transportation, and for analysis (i.e. clods were analysed in the box).
X-ray computed tomography (CT Scanning)
CT scanning was performed using a Phoenix v/tome/xm scanner (GE sensing and Inspection Technologies, Wunstorf, Germany), set at 190 Kv and 200 µA, with a 0.5 mm Cu filter. Each scan took 33 minutes to complete. The total number of images for each clod was 2400 per scan at a detector size of 2014 x 2024 pixels creating 31 GB file sizes. Data are given in mm. Aggregate (clod) size was 10x10x8 cm as above, giving a potential pixel side of about 80 µm. In other words, we sampled pores down to a minimum of silt-size.
Image processing
Image processing analysis was performed on the raw grey-scale images using ImageJ 1.44
(http://rsbweb.nih.gov/ij/). Each clod image was cropped to a 44.8 x 44.8 mm x 19.2 mm (700 x 700
x 301 pixels) area to exclude the outside edge and edge effects, giving a final pixel dimension of 64 µm. A median filter (radius 2 pixels) was used to remove noise but maintain borders. To separate pores from the matrix, different threshold settings were compared and the Otsu (1979) global automatic threshold algorithm was selected for the optimum analysis of all 12 samples. After application, the resulting black and white images were inverted so that the pores were recoloured to black prior to analysis. These binary images (301 images per sample) were analysed using the instrument Analyse Particles tool which calculates each individual pore size and shape (ca. 100, 000 pores per image stack).
Statistical analysis
33
comparing the presence/absence of organic amendment or N-rate respectively. The OM types included each organic amendment (anaerobic digestate, compost, farmyard manure or oat straw). The residual graphs were checked to meet the normality assumption, and for four parameters (average size, perimeter, feret and area) required log transformation to meet the normality assumption. Differences obtained at levels p ≤ 0.05 were reported as significant. Feret is the longest dimension of a pore in these 2D section, the perimeter is the distance in pixels around each pore and the area the number of pixels contained within.
Determination of response curves and yield optima
Linear plus exponential response curves (lexp. George, 1984) were fitted to each data set from each year. However, where only four data were available (Hoos barley) or where data were pooled (Broadbalk), it was necessary to fix the exponent, r, to 0.99 as indicated in Eq [1] leaving at least one degree of freedom for the model:
𝑌 = 𝐴 + 𝐵 ∗ 𝑟𝑁+ 𝐶 ∗ 𝑁 [1]
𝑌 = 𝐴 + 𝐵 ∗ 𝑟𝑁 [1a]
where Y is yield in t ha−1, A B and C are constants with B and C < 0. If ß is the break-even ratio (BER, the point at which an increment of additional yield only just pays for the additional increment of N fertiliser needed), Nopt is the total application of N. Yopt is the yield at this application of N found by substituting Nopt into [1]. If the price of N is £0.5 kg−1 and the value of wheat is £140 (current prices, January 2017) then the BER is 0.00357 (0.5 per kg/0.14 per kg). Historically the value of BER has been close to 0.003 and this value is used for ß throughout.
𝑁𝑜𝑝𝑡 =ln((−ß − 𝐶)/(𝐵 ∗ ln(𝑟))) ln(𝑟)
[2]
𝑁𝑜𝑝𝑡 =ln((−ß)/(𝐵 ∗ ln(𝑟))) ln(𝑟)
[2a]
34
Modelling
Modifications to these formulae [1] and [2] were made to account for the combined effects of N and OM on yield. Two modifications were tested to scale the organic matter (O) addition (1b) and to allow a separate exponent (2b).
𝑌 = 𝐴 + 𝐵 ∗ 𝑟𝑁+𝛼∗𝑂+ 𝐶1 ∗ 𝑁 + 𝐶2 ∗ 𝑂 [1b]
𝑌 = 𝐴 + 𝐵1 ∗ 𝑟1𝑁+ 𝐵2 ∗ 𝑟2(1+𝑂)+ 𝐶 ∗ 𝑁 ∗ (1 + 𝑂) [2b]
Parameters of these curves were derived by fitting eq [1b] or [2b] as appropriate using a genetic algorithm (GA, Charbonneau and Knapp, 1995) to determine the region that contains the global minimum and finding the actual minimum with a simplex search whose apices are initiated with the suite of parameters from the GA search.
Earthworm pot experiments
Experimental microcosms were constructed using polyethene bags and 1 pint (0.57 Litre) plastic drinking cups. Soil was wetted up to 70% of the water holding capacity and a treatment applied, as described below, before 500 g (dry wt.) of soil was added to each polythene bag. A pin was used to perforate the top of each plastic bag to allow the circulation of air. The bag was placed in the plastic drinking cup to ensure at least 10 cm depth of soil for the earthworms to burrow (Lowe and Butt, 2005). The mass of a single earthworm was determined before it was added to each microcosm at the start of the experiment. This stocking density is below the 3–5 adult worms l-1 rate recommended by Lowe and Butt (2005) so it is unlikely that the earthworms were stressed due to a lack of space. Experimental microcosms were arranged in a complete randomised block design in a controlled environment chamber, in constant darkness at 15o C. Earthworms were removed from the microcosms by destructive sampling and thorough mixing of the soil every 2 weeks for the duration of the experiment to ensure that the removal of each earthworm had an equal impact on the soil structure and the position of the food in each microcosm. Earthworms were washed by submerging them in deionised water, blotted dry, their mass determined, and then returned to the same microcosm.
35
We obtained a source of straw from trials carried out at AFBI where the object is to compare the responses of different varieties of cereal to a number of factors, including fungal attack – the recommended list trials at Hillsborough and Crossnacreevy. Samples of straw are retained from these experiments. Four replicate pots were set up, receiving one of five rates of straw (0, 0.4, 0.8 1.2, 1.6 or 2 g pot-1 per fortnight) to pots containing 400 g soil (from Fosters field at Rothamsted). At the end of the experiment the results were analysed by repeated measures REML for the difference in earthworm growth between pots receiving straw without/with fungicide after 2, 4, 6, 8 and 10 weeks.
4. Results
Fosters field experiment at Rothamsted
Crop yields at Fosters
Figure 4.1.1. Yield response of spring barley and winter wheat to N with and without amendment in 2013 in Fosters.
36
Figure 4.1.3. Yield response of winter wheat and winter oats to N with and without amendment in 2015 in Fosters.
Figure 4.1.4. Yield response of spring barley and winter wheat to N with and without amendment in 2016 in Fosters
As expected from prior work (Hoosfield), there were no significant differences between yields receiving amendments and the controls in the first year of the experiment (harvest 2013).
37
Where Nopt exceeds the maximum level of N applied, this maximum has been substituted from Nopt and Yopt calculated on the basis of the maximum application. This was the case for all data from Fosters East (R2, ww) in 2016. Standard errors, where available, are derived from the calculated Nopt, however.
Table 4.1.1. Optimum yield and optimum nitrogen fertilizer requirement under different crops for different years in Fosters. These Nopts are unconstrained in order to calculate the SEs. Yopts in this and subsequent tables are at Nopts constrained to the maximum N level applied
West East
Yopt SE Nopt SE Yopt SE Nopt SE
Spring barley Winter wheat
2013 nil 8.82 0.139 150 23.4 10.12 0.164 277 7.1
ad 8.73 0.039 126 3.8 10.33 0.349 253 20.2
compost 8.7 0.076 108 7.3 9.87 0.168 162 26.1
FYM 8.69 0.071 142 16.9 9.92 0.361 143 27.7
straw 8.58 0.238 152 81 9.55 0.46 220 120
Oil seed rape Spring barley
2014 nil 4.29 0.271 93 12.3 9.0 0.377 75.5 4.74
ad 5.1 0.124 161 30.8 10.5 0.165 110 9.11
compost 5.14 0.129 169 37.7 10.46 0.203 98.1 5.428
FYM 4.99 0.226 108 22.8 10.49 0.48 103 27
straw 5.11 0.122 200 70 10.44 0.05 139 4.3
Winter wheat Winter Oats
2015 nil 12.62 0.823 276 203 10.05 0.164 104 8.2
ad 13.12 0.245 169 38.5 11.23 0.142 93 3.86
compost 14.97 1.687 414 1135 11.24 0.544 203 125
FYM 13.0 0.176 186 37.5 11.44 0.213 263 10.0
straw 13.01 0.216 306 7.0 10.28 0.211 158 19.8
Spring barley Winter wheat
2016 nil 9.53 0.212 149 26.9 11.31 0.132 327 3.4
ad 10.19 0.357 128 28.5 11.98 0.094 320 2.6
compost 10.2 0.323 163 54.4 11.72 0.238 322 6.6
FYM 10.07 0.112 108 3.695 11.33 0.453 309 14.3
straw 9.95 0.162 169 18.1 11.18 0.298 338 6.9
38
The benefits of amending soil were expressed for each crop in each year in a number of ways (i) as the difference (diff) between Yopt with amendment and Yopt without (Yopt_with – Yopt_nil); (ii) as the ratio of Yopt with amendment to Yopt without (Yopt_with/Yopt_nil). The expectation is that this number will be greater than unity; and (iii) the difference between this number and one represents the fractional increase (Yopt_with /Yopt_nil – 1). The values of Yopt used here are calculated from values of Nopt constrained to be no greater than the maximum amount of N applied. Some values of Nopt (Table 4.1.1) are infeasibly large and not permissible under NVZ rules. The values in Table 4.1.2 are representative of practice, therefore the benefits in years 2013 to 2016 averaged across both crops in each year are -0.1, 1, 0.8 and 0.5 t ha-1 respectively.
Table 4.1.2. Benefits of treatments relative to the control for west and east blocks of Fosters.
2013 2014 2015 2016
West
Spring barley Oil seed rape Winter wheat Spring barley
diff -0.167 0.786 0.853 0.532
ad 0.988 1.176 1.063 1.042
compost 0.985 1.202 1.128 1.076
FYM 0.987 1.161 1.053 1.056
straw 0.965 1.192 1.032 1.050
mean 0.981 1.183 1.069 1.056
East
Winter wheat Spring barley Winter oats Winter wheat
diff -0.028 1.407 0.778 0.477
ad 1.031 1.166 1.106 1.068
compost 0.997 1.133 1.090 1.051
FYM 0.996 1.158 1.090 1.049
straw 0.964 1.170 1.025 1.009
39
Table 4.1.3. Statistical significance of the effect of organic amendments and nitrogen on crop yield.
OM OM rate OM rate
within each type of OM
OM and nitrogen
OM and nitrogen rates
Nitrogen rates
2013
Wheat and barley
Grain 0.13 0.743 0.690 0.013 0.694 <0.001
SED 0.279 0.211 0.557 0.249 0.557 0.249
Straw 0.308 0.241 0.807 0.075 0.987 <0.001
SED 0.228 0.172 0.455 0.204 0.455 0.204
1000 Grain weight
0.018 <.001 0.009 0.235 0.414 <0.001
SED 0.695 0.525 11.39 0.622 1.39 0.622
2014
Winter oilseed rape
Seed 0.337 0.664 0.718 0.001 0.170 <0.001
SED 0.250 0.189 0.500 0.224 0.500 0.224
Straw 0.307 0.132 0.345 0.002 0.767 <0.001
SED 0.326 0.246 0.652 0.292 0.652 0.292
1000 Grain weight (g)
0.451 0.967 0.426 0.572 0.391 0.033
SED 0.089 0.067 0.178 0.079 0.178 0.079
Oil content (%)
0.447 0.052 0.666 <0.001 0.048 <0.001
SED 0.344 0.067 0.178 0.079 0.178 0.079
Oil yield (t ha−1)
0.383 0.780 0.786 <.001 0.430 <0.001
SED 0.116 0.088 0.232 0.104 0.232 0.104
Oil yield, 91% (t ha−1)
0.447 0.052 0.666 <0.001 0.048 <.001
SED 0.313 0.236 0.625 0.280 0.625 0.280
Spring barley
Grain 0.253 0.051 0.532 <0.001 0.007 <0.001
SED 0.312 0.236 0.624 0.279 0.624 0.279
Straw 0.765 0.638 0.916 0.026 0.448 <0.001
40 1000 Grain
weight (g)
0.299 0.727 0.872 0.497 0.049 <0.001
SED 0.550 0.416 1.101 0.492 1.101 0.492
2015
Winter wheat
Grain 0.075 0.097 0.385 <0.001 0.159 <0.001
SED 0.265 0.200 0.530 0.237 0.530 0.237
Straw 0.013 0.074 0.276 <0.001 0.276 <.0.001
SED 0.272 0.205 0.544 0.243 0.544 0.243
1000 Grain weight (g)
0.634 0.339 0.458 0.017 0.513 0.095
SED 0.457 0.346 0.915 0.409 0.915 0.409
Winter oats
Grain 0.077 0.403 0.704 <0.001 0.313 <0.001
SED 0.449 0.339 0.898 0.402 0.898 0.402
Straw 0.009 0.564 0.007 <0.001 0.238 <0.001
SED 0.326 0.247 0.652 0.292 0.652 0.292
2016
Winter wheat
Grain 0.002 0.008 0.068 <0.001 0.072 <0.001
SED 0.201 0.152 0.401 0.179 0.401 0.179
Straw 0.004 0.225 0.174 0.022 0.060 <0.001
SED 0.249 0.188 0.498 0.223 0.498 0.223
1000 Grain weight (g)
0.664 0.474 0.054 0.003 0.691 <.001
SED 0.373 0.282 0.746 0.334 0.746 0.334
Spring barley
Grain 0.363 0.685 0.684 <.001 <0.001 <0.001
SED 0.205 0.155 0.409 0.183 0.409 0.183
Straw 0.777 0.727 0.111 0.020 0.548 <0.001
SED 0.198 0.150 0.397 0.178 0.397 0.178
1000 Grain weight (g)
0.141 0.545 0.461 0.022 0.639 0.150
SED 0.407 0.307 0.814 0.364 0.814 0.364
SED: Standard error of difference of means
41
Yields of barley on the Hoosfield experiment at Rothamsted (section 3.1.1.2) were maintained in amended plots, varying much less from year to year than the unamended plots. This is illustrated in Figure 4.1.5 where the effect of amendment is much greater in years when the unamended crop yields poorly. In this experiment, it appears that the amendments are conferring a degree of stability to the yields making the cropping system more resilient to the differences in years.
Figure 4.1.5. Difference in optimum yield betw