Article
Estimating Resident’s Preference of the Land Use
Program surrounding the Forest Park, Taiwan
Chun-Hung Lee, Chiung-Hsin Wang *
National Dong Hwa University, Department of Natural Resources and Environmental Studies Taiwan, ROC. Email: [email protected]
Corresponding: [email protected]
Abstract: This paper aims to build up a preference function to evaluate the public benefits of the type of agricultural farming, biodiversity, water provisions, land use type, ecotourism modes, and a monetary attribute (environmental trust fund and willingness to contribute) associated with an ecosystem service and land use program in a forest park. This study used the choice experiments to build a random utility model, analyze the average preference for the above land use attributes based on the conditional logit and used a latent class model to test the resident’s heterogeneous preferences for land use planning in the forest park. We also estimated the welfare derived from various land use programs. The empirical result had shown that: (1) increasing organic farming area, maintaining the status quo of species biodiversity, increasing the surface water provision, increasing the area of custom flora, increasing the wetland area, and setting up an integrated framework for ecotourism increase the public’s preference for the land use program; (2) we found that farmer and non-farmer haven’t the same land use preferences; (3) the ecotourism development program incorporating biodiversity, organic farming, ethnobotany, and wetland area with integrated ecotourism are more preferred than other land use program scenarios.
Keywords: land use preference; ecosystem service; natural conservation
1. Introduction
Since the report of the Millennium Ecosystem Assessment [1], ecosystem services have been considered the framework for a new science able to uncover the co-evolution of humans and nature [2] and human dependence on ecosystem processes and biodiversity [3]. This framework incorporates ecological, cultural and socio-economic aspects of ecosystems in current conservation policies [4, 5]. Despite the political commitment to the designation of additional nature areas, ecosystems are still deteriorating [6]. These changes have received considerable attention in land use policy, urban economics, and geography literature. These research areas focus on supporting decisions related to land use changes, where a tradeoff has to be made between the benefits of increasing developed environment and protecting or expanding the natural environment [7]. If the benefits of nature conservation or improvements can account for in economic decision-making criteria, policymaking can better optimize social welfare. To bring this trade-off between nature and infrastructural concept contain to a land use program in the forest park, policymaker could increasingly search for information about the policy contribution. Monetary valuation of ecosystem services aims to contribute to this field of research by providing information about the values that society attributes to nature, also taking into account uncertainty about future uses and the location specificity of values [7].
relevant characteristics of both nature areas and the population of beneficiaries, and (b) it should control for spatial variables, such as the size of the area and distance to the respondent’s home [7, 11].
Choice experiments (CE) use survey questionnaires that define hypothetical markets and disclosure the respondent’s preference for landscape preservation and nature development. Besides the respondent’s awareness, attitudes, opinions, and perceptions, CE also measures their willingness to pay (WTP) for an ecosystems’ good or service. Therefore, WTP can be seen as an indicator of the strength of the measured public preferences [7]. In fact, the supply of an ecosystem’s goods and services has spatially heterogeneous and the provision has influenced by landowners' willingness to provide. Therefore, CE also been used to value nature and land use change scenarios [12], such as the relationship between supply and farmer preferences and the welfare in afforestation projects [13] , or estimated the coefficients for the different attributes of land use type and explored marginal willingness to pay (MWTP) for the attributes and welfare changes towards land-use scenarios in Spain [14], or used to develop a generic monetary value function to assess the public benefits of amenities, recreation and biodiversity values associated with land use changes from agricultural land to different types of nature in Belgium [7].
From the above-mentioned research, we know that CE is a better evaluation method for establishing the multi-attribute utility function for natural resources and the environment, and estimating the economic value of environmental resources and goods and services. In recent years, CE has also been applied to nature reserves [15], forest ecosystems, urban land, afforestation projects and ecological compensation projects [13]. However, little attention has given to the relationship between ecosystem service and land use programs based on residents’ willingness and demand for forest parks in Taiwan. Therefore, this study analyzes residents’ preferences for land use planning in a forest park, estimates their MWTP for five land use planning attributes, namely agricultural farming type, biodiversity, water provision, land use type, and ecotourism mode in a community adjacent to the Danongdafu Forest Park (DFP), and considers money associated with an environmental trust fund and labor time. Furthermore, this study also discloses the preference differences between residents with different characteristics, such as farmers and non-farmers. This study also uses a latent class model (LCM) to test the issue of heterogeneous preferences for the land use planning in the forest park. Finally, we disclose the economic values under different scenarios based on land-use management.
2. Materials and Methods
2.1. Study Area
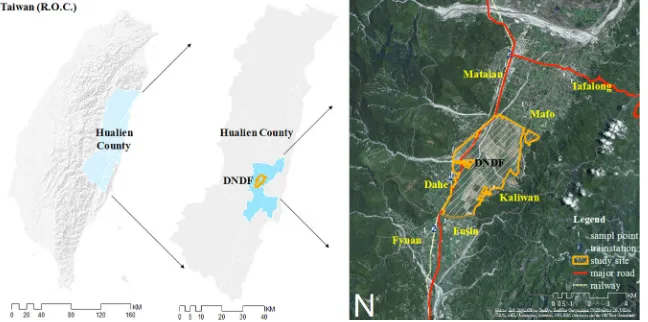
This study chose DFP as its research scope. This park is located in Hualien County, eastern Taiwan. The western part is the Central Mountain Range and the eastern part is the Coastal Mountain Range (Fig. 1). The major land use type in this area is afforestation (i.e. DFP, 1250 ha), followed by agriculture land.
As one of the few remaining forests in the intensively developed lowland areas of eastern Taiwan, Danongdafu Forest Area (DFA) has experienced several times large land cover change because of economic development. For instance, DFA was covered by bush forests interspersed with rivers and ponds before 1895 [16-18]. From 1895 to 1945, sugarcane production became the major landscape and local economic activities in DFA, and DFP was a sugar plantation that established in 1921 [18]. Since 2002 the sugar industry collapsed, DFP started to plant trees according to the guidelines of the “Plain Landscape Afforestation Program” policy [18, 19]. DFP became single-species forests, although the stands of different species are interlaced, forming a mosaic landscape [19]. Since 2007, according to the “extension of the Afforestation Policy” in the Plain Area, DFP has been constructed for developing tourism and developed many additional recreation facilities.
Nowadays, DFP not only faces the forest management also faces the community and tourism development [18-20]. For forest management to be able to deliver such a broad range of ecosystem services, it is necessary to move towards adaptive forest management [19, 21]. The expected values that from stakeholders1 indicated the need for a multi-value approach to sustainable forest
management in DFP, which is also supported by the growing environmental awareness of the public [19].
2.2. Choice Experiment Design
Following Hanley et al.[22], we established the CE attributes and levels based on literature reviews and interviews with focus group discussions (FGDs) such as local residents and experts, including policymakers and scientists (i.e. hydrologists, ecologists and resource management) which have been working in DFP. Therefore, we built up three land use types according to the FGDs. In addition, this study carried out pre-testing from August to September in 2015. After the pretest, minor modifications to the questionnaire were made. The distribution of the final CE questionnaire started in October of 2015.
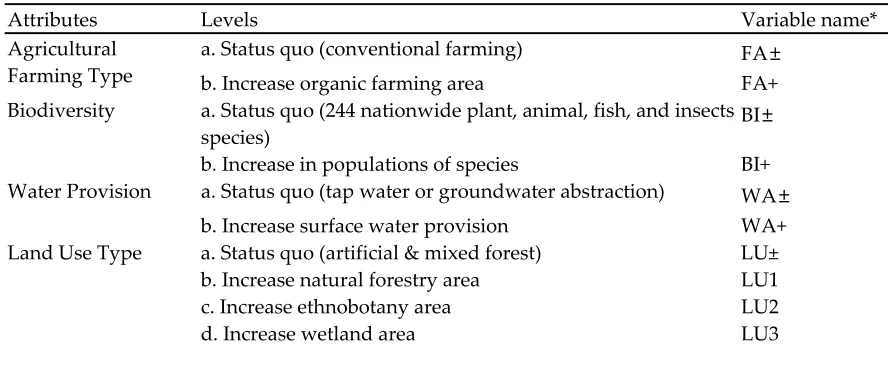
Based on the above discussion, seven characteristics were included as CE attributes in the design: agricultural farming type [23, 24], biodiversity [7, 15, 25], water provision [13], land use type [7, 11, 14, 25, 26], ecotourism mode [14], environmental trust fund, and willingness to work [7, 14, 25, 27], as well as the levels of the attributes in relation to ecosystem services, as shown in Table 1.
Table 1. Attributes and levels of the land use preference in DFP
Attributes Levels Variable name*
Agricultural Farming Type
a. Status quo (conventional farming) FA±
b. Increase organic farming area FA+
Biodiversity a. Status quo (244 nationwide plant, animal, fish, and insects species)
BI±
b. Increase in populations of species BI+
Water Provision a. Status quo (tap water or groundwater abstraction) WA±
b. Increase surface water provision WA+
Land Use Type a. Status quo (artificial & mixed forest) LU±
b. Increase natural forestry area LU1
c. Increase ethnobotany area LU2
d. Increase wetland area LU3
1 The Taiwanese government forestry agency sees the increase in biodiversity through the
increased habitat diversity in the plantations as the main ecosystem service that the plain afforestation program should provide. Increased forest area in the lowland region will also increase
its value for carbon sequestration, ecotourism and scenic services. However, land owners, such as the Taiwan Sugar Cooperation, want to profit from selling forest products, such as timber, small
Attributes Levels Variable name*
Ecotourism Mode a. Status quo (individual tourism) EC±
b. Integrated framework for the ecotourism EC+ Environmental Trust
Fund
a. Status quo (no pay) FUND
b. NT$500/year/person c. NT$1000/year/person d. NT$1500/year/person e. NT$2000/year/person
Willingness to Work a. Status quo (no pay) TIME
b. 6 hours/month/person c. 12 hours/month/person d. 18 hours/month/person e. 24 hours/month/person * The attribute level describes the basic alternative.
2.2.1. Agricultural farming type
“Agricultural farming type” means the method of agriculture in DFP. With the rising awareness of environmental protection and food quality [28, 29], the importance of understanding the farmers’ requirements and willingness to participate in pesticide reduction agri-environmental schemes has been increased [24]. In Taiwan, intensive production has long been the typical agricultural operation mode. Pest and disease attacks constitute one of the biggest sources of risk in agriculture, especially because they are likely to provoke “catastrophic risk” (up to 100 % crop losses) [30]. In order to increase the yield, farmers often apply more chemicals and fertilizers than the farmland requires. Overuse of chemicals and fertilizers cause adverse impacts on the agricultural environment as well as the biodiversity [23]. There is about 50 ha of agricultural fields in DFP, which are available for rent for from the administrator, and the status is conventional farming. Based on the concepts of increasing food quality (i.e. provisioning services) and conservation of biodiversity and habitat quality (i.e. supporting services), we added “increase organic farming area” to test the preference at two levels by understanding the residents’ options (Table 1).
2.2.2. Biodiversity
“Biodiversity” contains variety species of plant and animals in DFP. Birol, et al. [31] measured the benefits of services, not management practices, provided by wetland management, such as biodiversity, water uncovered by reeds, and educational access. Liekens, Schaafsma, De Nocker, Broekx, Staes, Aertsens and Brouwer [7] used a CE to develop a generic monetary value function to assess the public benefits of amenities, recreation and biodiversity values with land use function from different types of nature in Belgium. Since DFP is an afforestation park, and the current status of the homogeneity of plants and species leads to a lack of biodiversity (no endangered species; Ground cover plants: 44 families, and 90 Species; Mammals: two orders, four families, and seven species; Birds: 34 families, and 67 species; Reptiles: four families, and four species; Amphibians: five families, and 12 species; Fish: two families, and two species; and Insects: 4 orders, 14 families, and 62 species). Besides the level of current status, we added “increase in populations of species”in this attribute.
2.2.3. Water provision
or groundwater abstraction. Thus, we added “increase surface water provision” to contribute to provisioning services and regulating services.
2.2.4. Land use type
“Land use type” for future land-use management options of the 50 ha agricultural fields in DFP. García-Llorente, M., et al. pointed out the different land-use management alternatives related to different ecosystem services and values in the Nacimiento watershed in southeastern Spain. Their results indicated that the local population would support the implementation of a new land-use management strategy in the watershed, also showed the most important attributes were river quality and traditional farming, despite lower economic benefits [14]. Consequently, based on the results of FGDs, this study set the current status as artificial & mixed forest, and added “increase natural forestry area” (related to supporting services; restoration of natural habitats), “increasing the ethnobotany area” (such as the aboriginal culture; recovering the landscape for the local, which is occupied by pigeon pea, millet, etc.), and “increase wetland area” (related to regulating services and cultural services; restoration of surface from previous periods) (Table 1).
2.2.5. Ecotourism mode
The research results show that ecotourism could raise the tourists’ utility by providing cultural experience activities; we found the same results for domestic and foreign tourists [33]. Juutinen et al. found integrating travel information on a website and at a travel center can increase preferences and satisfaction significantly [34]. In addition, Lee [20] used a CE model to estimate tourists’ preferences and the values of community ecotourism in DFP. He found the best combinations regarding community ecotourism were small, profound, and experiential activities in the DFP. Indeed, each community around the DFP has its own feature activities, such as agricultural features, cultural traits, ecological activities, local dishes, etc. However, information about these features had not integrated into the tour package for community ecotourism. Therefore, for this attribute of ecotourism mode, we added, “integrate a framework for ecotourism”to test the resident’s opinions.
2.2.6. Environmental trust fund
We use the environmental trust fund (FUND) as a financial attributes to evaluate the resident’s value towards improving environmental quality in DFP. The financial attribute is an important indicator for eliciting respondents’ WTP for valuing the public goods. Liekens Inge used a mandatory annual tax to be paid for the creation and conservation of natural areas in Flanders [7]. Furthermore, García-Llorente et al. used a tax reallocation format as a payment vehicle. The results showed that the monetary attributes could measures and had well understood by the public. García-Llorente et al. found that the WTP variable behaves as expected, even in those areas with low salaries and falling employment [14]. However, the monetary attribute in this study is an annual cost, which contributes to a trust fund for all residents. Moreover, this fund would be spending on the development and maintenance of the chosen alternative only. We added“500”, “1,000”, “1,500”, and “2,000” four levels, and the dollar unit treat as New Taiwan dollars per person in one year” (Table 1).
2.2.7. Willingness to work
levels, including “6 hours per person per month”, “12 per person per month”, “18 hours per person per month”, and “24 hours per person per month” (Table 1).
The first part of the questionnaire includes questions regarding respondents' socio-economic status, including years of birth, education, income, membership in a conservation group, and agricultural land ownership. The second and most important part of the questionnaire contains the CE. It gives information about DFP and choice sets related to the ecosystem services and land use program of the park.
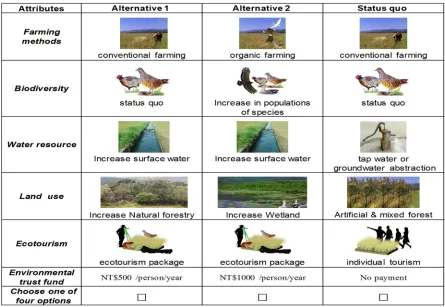
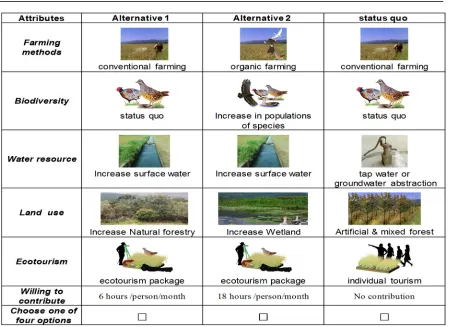
According to the number of attributes and levels of land use, planning gave rise to 320 possible profiles (2×2×2×4×2×5=320). To develop the profiles presented by the respondents to the questionnaire, we applied an orthogonal main effect design and reduced the number of profiles to a level of 25 alternatives [36]. Upon further deleting unreasonable combinations, the total number of choices is 13 after the procedure was repeated three times [34]. Each choice set included two signed alternatives and one status quo in which the levels of attributes refer to the present situation. Finally, we came up with two questionnaire versions, as seen Fig.2 and Fig.3. In a CE, the respondents could choose the listed of alternatives we given. Each alternative were based on the same land use attributes, which contain a financial attribute, but with different values (attribute levels). Usually, respondents are shown two or three alternatives on a choice card and an option that allows them to choose none of the two, this ‘opt-out’ can also represent the current situation or no land use change [7].
Figure 3. An example of the CE questions for willingness to work
2.3 Sample design and data
The CE surveys implemented from October of 2015 to January of 2016. The resident survey conducted in seven rural communities, i.e. Mataian, Tafalong, Mafo, Kaliwan, Dahe, Fyuan, and Fusin. These communities are located in the area surrounding the forest park (see Fig.1). A sample of 656 residents2 (almost 17% of the approximately 3,831 households in these communities) was taken
within the budget and time constraints of the research project. The residents were selected randomly and be contacted by well-trained interviewers in the form of face-to-face interviews.
The respondents’ social-economic background information shows there was an almost even distribution between male and female respondents (Male: 290 people, 44.1%). 87.5% of respondents were married, 49.8% were over 60 years old. 63.7% of respondents' education level were junior high school graduate and below, and 76.6% of respondents' incomes were less than NT$ 20, 000 per month. The respondents’ occupations were agriculture (22.2%), service (21.4%), retired (17.7%), and housewife (17.1%); 66.6% of the respondents own farmland. The average age of the respondents were 43.5 years (STD error is 0.844), and 55.8% of respondents were living in the area more than 41 years. Regarding their relationships with the study area, 88.9% of respondents were not members of the conservation group. 71.8% were not members of the local community organization, and there was an almost even distribution between those joining and not joining the activities of the local community organization (yes: 54.4%).
2 Based on a 95% Confidence Level, and 3.8% level of desired precision, and assuming the
2.4 Theory of preference function and the marginal effect on land use preference
2.4.1. Models
The CE methodology [37-40] are the only methods able to capture both use and non-use values with the ecosystem services. Stated preference methods use survey questionnaires to define hypothetical markets and ask individuals to answer the preferences, such as the opinions of landscape use planning and nature development. In addition, the CE also could measure public’s preference and WTP for a level change of the environmental goods or services [10]. Since the 1990s, CE has become an acceptable method to design of environmental policies or to facilitate consideration of environmental impacts on decision-making [41-43]. CE allow us to evaluate multiple attributes of a landscape, and multi-attribute preference elicitation [44].
In the CE, a set of alternatives has shown to the respondents, who were asked to choose their most preferred alternative. The parameters associated with the assumed distributions are then estimated [45]. Data obtained from the questionnaires were analyzed with CL and LCM. The CL is the basic model used in CE studies, and so it offers a baseline of the attribute and level changes for the preference estimation. Since the CL assumes that the parameters are constant among all individuals, it’s suitable to estimate the average preferences and the average welfare effects [45], assuming the parameters are constant [46]. In the LCM, preference heterogeneity is accounted for by simultaneously in different groups with the behavior and background. Thus, preferences are assumed to be not homogenous groups. The groups can be used to estimate the membership probability. It is suitable to clarify systematic causes of taste variation in a single framework [34]. This method can also find groups of respondents that have different preferences for considered features of ES and land use programs.
According to Lancaster’s theory [47], consumer decisions based on the utility of the attributes; it is the level of preference that a representative respondent gains from an alternative option [48]. The random-utility model accounts for the unobservable elements by adding an error term [49].
U = β X +ε
(1)
where the utility function "U " is partitioned into two parts done systematic and observable vector, "X ", related to alternative "j" and individual "i", which represents a vector about the land use attributes and "β", which is a vector of coefficients associated with the land use attributes and an error term, "ε ".
Following Hausman and Wise [50] the deterministic part of the estimated utility function, the empirical model of land use preference could set a equation as that:
= ASC + + + + 1 + 2 + 3 + +
(2)
An alternative specific constant (ASC) capturing the (systematic) utility of omitted variables is included. The ASC is modeled as a dummy that takes the value 0 if one of the hypothetical alternatives is chosen and 1 if the ‘status quo’ is chosen. Where is the coefficient of the agricultural farming type; is the effect coded variable for agricultural farming type at levels 2; is the coefficient of the biodiversity; is for biodiversity at levels 2; is the coefficient of the water provision; is for water provision at levels 2; are the coefficients of the land use type;
1, 2, and 3 are for land use type at levels 2, 3, and 4 respectively; is the coefficient of the ecotourism mode; is for ecotourism mode at level 2; is the coefficient of the environmental trust fund; and the variable represents the cost attribute.
2.4.2. Welfare measures
attributes were significant for the statistically criterion; if not, no MWTP and MWTW measure can be obtained.
MWTP = -
(3)
MWTW = -
(4)
where "β " is the attribute’s coefficient for the land use preference [22], " " is the marginal utility of the fund attribute [41], and " " is the marginal utility of the time attribute. The value function thereby reveals how the non-market benefits could estimate for the land use characteristics of this design.
2.4.3. Hypothetical land-use management scenarios
For valuation scenarios on the CE model, it just to apply in economic values of land use planning scenarios in Spain’s semi-watershed [14], and marginal willingness to stay (MWTS) of the recreational impact programs in Portugal [26].This study created hypothetical future scenarios based on the information compiled from the questionnaires. We calculated the MWTP and MWTW required to carry out a given land-use management scenario, comparing the utility of any alternative option to the reference alternative (the status quo). The three hypothetical scenarios have chosen as outcomes of the implementation of particular land-use policies are as follows:
• Scenario I-Natural conservation: The wetland area increases in size and a restoration effort have carried out by the surface water. Surface water and biodiversity increase. Land-use is devoted
to ethnobotany and wetland areas. As for the agricultural farming type and ecotourism mode, we maintain the status quo.
• Scenario II-Environmental-friendly agriculture: The organic farming area and surface water provision increase. The organic farming area, biodiversity, surface water, and ethnobotany area
increase. The ecotourism mode retains the status quo.
• Scenario III-Ecotourism development: The ecotourism package is integrated and the healthy environment area increase. The organic farming area and biodiversity increase, and an ecotourism package are integrated. Land-use is devoted to ethnobotany area, wetland area, and
integrated ecotourism. Water provision retains the status quo.
3. Empirical results
3.1. Estimation
Considering the results of the CL model, increasing organic farming area (FA+), increasing surface water provision (WA+), increasing ethnobotany area (LU2), increasing wetland area (LU3) and integrating a framework for the ecotourism (EC+) are significant at the 10% level in the choice of a future land-use management scenarios for both WTP and WTW (Table 2). Moreover, increasing the ethnobotany area is not a significant factor in the choice of a future land-use program for WTW. The log likelihood value indicates that the model fit is acceptable for the land-use preference model. The positive and significant signs of both ASC coefficients, assigned to the status quo option, indicate a negative utility impact on any choice set that differs from the status quo. On the other hand, the negative and significant signs of the fund and time coefficients, assigned to the alternative program, indicate that the respondents are not willing to exert more effort. It is not possible to establish any consensus preferences for increasing the populations of species and increasing natural forestry area (LU1) for either attribute (fund or time) (Table 2).
Attributes & Levels WTP WTW coefficient t-value coefficient t-value
ASC 0.674 4.27*** 0.407 2.67***
FA+ 0.268 3.22*** 0.155 1.87*
BI+ -0.09 -0.76 -0.103 -0.87
WA+ 0.363 4.66*** 0.45 5.8***
LU1 -0.052 -0.42 0.063 0.52
LU2 0.252 2.29** 0.133 1.23
LU3 0.408 2.65*** 0.38 2.52***
EC+ 0.194 3.63*** 0.225 4.25***
FUND -0.00079 -6.18***
TIME -0.07473 -7.10***
Log-likelihood -1,895.60 -1,928.60
Note: ***, **, * ==> Significance at 1%, 5%, 10% level.
Furthermore, to understand the differences between the land use preferences of farmer and non-farmer, we divided the respondents into two groups. As Table 3 shows, increasing the populations of species (BI+), increasing surface water provision and integrating a framework for the ecotourism are positive and significant factors for farmers in the choice of a future land-use management scenario with an environmental trust fund. These factors are also positive and significant for willingness to work. Moreover, increasing the ethnobotany area is a negative and significant factor in the choice of a future land-use program in the farmer group for willingness to work, indicating a negative utility impact. The negative and significant sign of the ASC coefficient, assigned to the status quo option, indicates a positive utility impact on any choice set that differs from the status quo. In addition, the negative and significant signs of the fund and time coefficients, assigned to the alternative program, indicate that farmers are unwilling to exert more effort.
On the other hand, increasing organic farming area, increasing surface water provision, increasing ethnobotany area, increasing wetland area and integrating a framework for ecotourism are positive and significant factors for the non-farmer group in the choice of a future land-use management scenario vis-à-vis the fund and time attributes. Moreover, increasing populations of species is a negative and significant factor for the non-farmer group in the choice of a future land-use management scenario when it comes to the fund and time attributes. In the non-farmer group, the positive and significant signs of both ASC coefficients, assigned to the status quo option, indicate a negative utility impact on any choice set that differs from the status quo. The state of fund and time coefficients are the same as those of the farmer group.
Table 3 The land use preferences among farmers & non-farmers
Attributes & Levels
Farmer (N=146) Non-farmer (N=510)
WTP WTW WTP WTW Coeff. t-value Coeff. t-value Coeff. t-value Coeff. t-value
ASC -0.585 -1.81* -1.139 -3.59*** 1.07 5.79*** 0.843 4.71***
FA+ -0.089 -0.48 -0.176 -0.92 0.379 4.03*** 0.255 2.73***
BI+ 0.472 1.77* 0.675 2.48** -0.253 -1.88* -0.299 -2.24**
WA+ 0.581 3.37*** 0.825 4.62*** 0.304 3.46*** 0.366 4.19***
LU1 0.047 0.17 0.282 0.99 -0.077 -0.55 0.022 0.16
LU2 -0.111 -0.44 -0.449 -1.78* 0.348 2.81*** 0.276 2.24**
LU3 -0.193 -0.61 -0.343 -1.05 0.597 3.34*** 0.575 3.29***
EC+ 0.215 1.82* 0.427 3.66*** 0.203 3.33*** 0.202 3.34***
TIME -0.19 -7.5*** -0.046 -3.9***
Log-likelihood -409.5 -401.2 -1,467.50 -1,491.80
Note: ***, **, * ==> Significance at 1%, 5%, 10% level.
3.2. Welfare Analysis
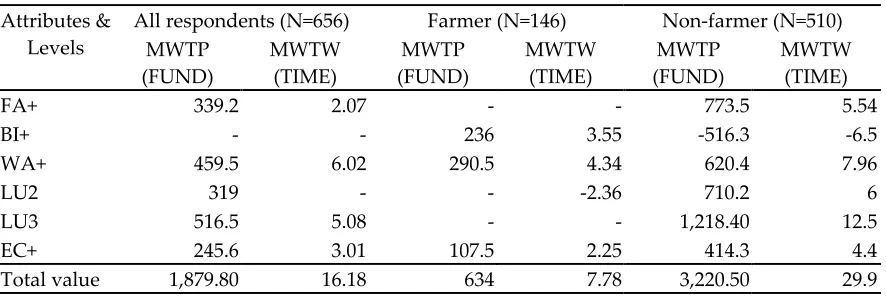
For the welfare analysis of selected scenarios of land-use management in DFP, we can follow the results of eq. (3) and eq. (4) in Table 4 to estimate the MWTP and MWTW for each attribute in a particular scenario (the last row in Table 4). The second column in Table 4 presents the MWTP values for the considered attribute levels, and the third column in Table 4 presents the MWTW values for the considered attribute levels. These calculations are based on the coefficient of the CL model (Table 2) showing the average values of the respondents. Furthermore, we divided the respondents into two groups, farmers and non-farmers. We also analyze the willingness to contribute estimates in relation to the welfares of each group.
Table 4 Willingness to contribute estimates of different groups
Attributes & Levels
All respondents (N=656) Farmer (N=146) Non-farmer (N=510) MWTP
(FUND)
MWTW (TIME)
MWTP (FUND)
MWTW (TIME)
MWTP (FUND)
MWTW (TIME)
FA+ 339.2 2.07 - - 773.5 5.54
BI+ - - 236 3.55 -516.3 -6.5
WA+ 459.5 6.02 290.5 4.34 620.4 7.96
LU2 319 - - -2.36 710.2 6
LU3 516.5 5.08 - - 1,218.40 12.5
EC+ 245.6 3.01 107.5 2.25 414.3 4.4
Total value 1,879.80 16.18 634 7.78 3,220.50 29.9
FUND: NT$ /year/person; TIME: hours/month/person
According to MWTP results of all respondents presented in Table 4, the respondents are willing to pay the highest fee for increasing the wetland area (NT$ 516/year/person), followed by increasing surface water provision, organic farming area, and ethnobotany area. An integrated framework for ecotourism was the lowest (NT$ 245/year/person). The results (Table 4) indicate that farmers were willing to pay the most for increasing the surface water provision (NT$ 290.5/year/person), followed by increasing populations of species while integrating a framework for the ecotourism had the lowest MWTP (NT$ 107/year/person). However, for the non-farmer group, respondents’ highest MWTP was for increasing the wetland area (NT$ 290.5/year/person), followed by increasing the organic farming area, increasing ethnobotany area, and increasing the surface water provision. Finally, increasing populations of species was the most negative and lowest MWTP (NT$ -516.3/year/person).
3.3. Heterogeneity test
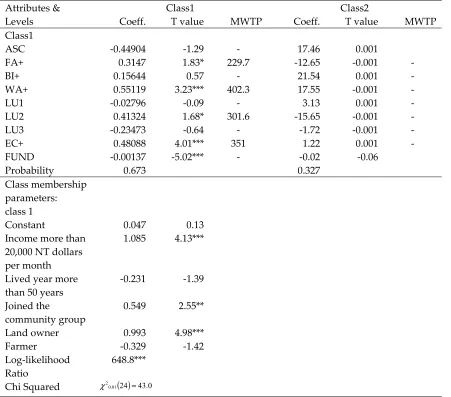
Owing to the respondent’s attitudes and social background may not be homogenous, we incorporated the identified individual-specific characteristics into the LCM to find groups of residents that have different preferences for the considered features of the DFP. Table 5 depicts the results of the LCM analysis with two latent groups. It found out that the respondents’ income [7, 35, 52], duration of residence, membership in the community group [7], land ownership [52, 53] and occupation were significant: [54] The group membership characteristic held or both farmers and non-farmers. However, the income, membership in the community group and land ownership indexes were positive and significant vis-à-vis the fund (MWTP) attribute. As Table 5 shows, the higher income (>NT$ 20,000 per month), joined the community group membership, and the land ownership characterizes in class 1 (probabilities = 0.673), which are. Relatively, the residents contain in class 2 are likely the lower income (< NT$ 20,000 per month), didn’t join the community group and resident who didn’t have the land.
Table 5 Parameter estimates and MWTP values of LCM in DFP
Attributes & Levels
Class1 Class2
Coeff. T value MWTP Coeff. T value MWTP
Class1
ASC -0.44904 -1.29 - 17.46 0.001
FA+ 0.3147 1.83* 229.7 -12.65 -0.001 -
BI+ 0.15644 0.57 - 21.54 0.001 -
WA+ 0.55119 3.23*** 402.3 17.55 -0.001 -
LU1 -0.02796 -0.09 - 3.13 0.001 -
LU2 0.41324 1.68* 301.6 -15.65 -0.001 -
LU3 -0.23473 -0.64 - -1.72 -0.001 -
EC+ 0.48088 4.01*** 351 1.22 0.001 -
FUND -0.00137 -5.02*** - -0.02 -0.06
Probability 0.673 0.327
Class membership parameters: class 1
Constant 0.047 0.13
Income more than 20,000 NT dollars per month
1.085 4.13***
Lived year more than 50 years
-0.231 -1.39
Joined the
community group
0.549 2.55**
Land owner 0.993 4.98***
Farmer -0.329 -1.42
Log-likelihood Ratio
648.8***
Chi Squared
Note: *** ==> Significance at 1% level.
Based on the LCM results, the two groups have different preferences for the land use program characteristics with respect to the coefficients of the attributes are not the same. Furthermore, their positive and significant land use program preferences are increasing the organic farming area, increasing surface water provision, increasing ethnobotany area and integrating a framework for ecotourism. However, in class 2 (probabilities = 0.327) however, that all coefficients were not statistically significant in LCM results at 10%. In class 1, respondents’ MWTP were for the increasing
( )24 43.0 01
. 0
2 =
surface water provision (NT$ 402.3/year/person), followed by integrating a framework for ecotourism (NT$ 351/year/person), increasing ethnobotany area (NT$ 301.6/year/person), and increasing organic farming area (NT$ 229.7/year/person). Therefore, this two group’s characteristics and attributes of the land use program was heterogeneity.
3.4. Welfare changes for hypothetical land-use management scenarios
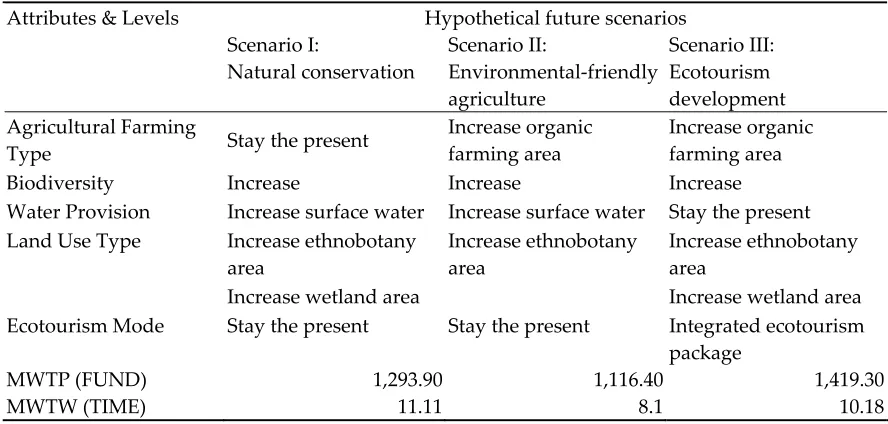
According to the MWTP evaluation results presented in Table 6, scenario III was the most preferred (confidence interval of welfare change at 90% of NT$ 1,419/year/person), followed by the scenario I (confidence interval of welfare change at 90% of NT$ 1,293/year/person), and scenario II (confidence interval of welfare change at 90% of NT$ 1,116/year/person) was the least preferred. However, according to the MWTW evaluation results presented in Table 6. The Scenario I was the most preferred (confidence interval of welfare change at 90% of 11 hours/month/person), followed by scenario III (confidence interval of welfare change at 90% of 10hours/month/person). Scenario II (confidence interval of welfare change at 90% of 8 hours/month/person) was still the least preferred scenario. Obviously, the best land use program on MWTP for the resident was increase organic farming area, increase biodiversity, increase ethnobotany area, increase wetland, and integrated ecotourism package. By the way, the local resident will prefer the natural conservation, which contains increase the biodiversity, water provision, ethnobotany and wetland area for MWTW estimation results. The results could help with the land-use management program in a forest park.
Table 6 Welfare changes from land-use management scenarios
Attributes & Levels Hypothetical future scenarios
Scenario I:
Natural conservation
Scenario II:
Environmental-friendly agriculture
Scenario III: Ecotourism development Agricultural Farming
Type Stay the present
Increase organic farming area
Increase organic farming area
Biodiversity Increase Increase Increase
Water Provision Increase surface water Increase surface water Stay the present Land Use Type Increase ethnobotany
area
Increase ethnobotany area
Increase ethnobotany area
Increase wetland area Increase wetland area
Ecotourism Mode Stay the present Stay the present Integrated ecotourism package
MWTP (FUND) 1,293.90 1,116.40 1,419.30
MWTW (TIME) 11.11 8.1 10.18
FUND: NT$ /year/person; TIME: hours/month/person.
4. Conclusions
demand. The MWTP estimation of conservation policy and river restoration in Spain [14], and the case of Beligiun’s nature development and land use policy [14] also supports our results, which enhancing the function of the wetland land and the water provision were the key factors of land use program in the forest park.
Farmer respondents differ from non-farmers for land use attributes (increasing wetland area, ethnobotany area, organic farming area, and increasing populations of species) but not others (increasing surface water provision and integrating a framework for ecotourism), the results are same as in MWTP and MWTW. Farmers are more likely to focus on the increasing biodiversity, but non-farmers have not mentioned this issue. The case of agri-environmental scheme for afforestation in Germary [14], and environmental stewardship in United Kingdom [55] also indicates the importance of the biodiversity in land use policy[14]. However, the non-farmers seem more likely increasing wetland area, organic farming area, and ethnobotany area in the forest park; this may imply the general local residents would focus on the ecosystem service of the land use program. Similarly results of the nature tourism facility development in Norway [56]. However, farmer and non-farmer respondents are both incorporate the water provision and ecotourism into their land use choices. According to our CE analysis, the respondents have higher MWTP and MWTW for land-use planning in DFP, indicating that land-use management has potential to improve the quality of the park in the future. Increasing wetland area, surface water provision, ethnobotany area, organic farming area, and an integrating framework for ecotourism are the best program for land-use management in the DFP forest park. Under water constraints, this result is similar to the land-use management plans under the ecosystem services framework in the semi-arid mountains in the Nacimiento watershed (south-eastern Spain) [14]. The heterogeneity of land use preferences derived from our empirical investigation supports the need for more integration of agricultural issues with local land-use issues. We found different land use preferences among various resident groups, and therefore raised the preference’s heterogeneity for the community near DFP. In particular, explaining the sources of heterogeneity involves taking socio-economic backgrounds and land use behavior into consideration simultaneously. We found that higher positive preference and WTP on the land use program are affected by higher income, having a farm, and community organization membership. Similarly a previous study focusing on residents of the buffer zone of Chitwan National Park in Nepal and selected vehicle payment (annual membership fee or labor contribution) showed that the average household WTP of the monetary group is consistently higher than that of their neighbors who prefer to contribute labor [35]. A detailed and comprehensive analysis reveals the local residents’ various preferences towards land-use management strategies for community conservation in a forest park. Analyzing residents' heterogeneous preferences for the issues of land use planning in forest parks by combining qualitative and quantitative data would be an interesting topic for future research.
References
1. Assessment), M. M. E., Ecosystems and Human Well-being: Current States and Trends. World Resources Institute: Washington, D.C., 2005.
2. Blondel, J., The 'design' of Mediterranean landscapes: a millennial story of humans and ecological systems during the historic period. Human Ecology 2006, 34, 713-729.
3. Díaz, S.; Fargione, J.; Chapin III, F. S.; Tilman, D., Biodiversity loss threatens human well-being. Plos Biology 2006, 4, 1300-1305.
4. Biodiversity), T. T. E. o. E. a., TEEB for National and International Policy Makers. Earthscan: London and Washington, 2010.
5. Harrison, P. A., Ecosystem services and biodiversity conservation: an introduction to the RUBICODE project. Biodiversity Conservation 2010, 19, 2767-2772.
6. MIRA, I. Milieurapport Vlaanderen; Vlaamse Milieumaatschappij: 2010.
7. Liekens, I.; Schaafsma, M.; De Nocker, L.; Broekx, S.; Staes, J.; Aertsens, J.; Brouwer, R., Developing a value function for nature development and land use policy in Flanders, Belgium. Land Use Policy 2013,
30, (1), 549-559.
8. Johnston, R. J.; Swallow, S. K.; Bauer, D. M., Spatial factors and stated preference values for public goods: considerations for rural land use. Land Economics 2002, 78, (4), 481-500.
9. Arriaza, M.; Ca˜nas-Ortega, J. F.; Ca˜nas-Madue˜no, J. A.; Ruiz-Aviles, P., Assessing the visual quality of rural landscapes. Landscape and Urban Planning 2004, 69, (1), 115-125.
10. Sevenant, M.; Antrop, M., Cognitive attributes and aesthetic preferences in assessment and differentiation of landscapes. Journal of Environmental Management 2009, 90, (9), 2889-2899.
11. Shoyama, K.; Managi, S.; Yamagata, Y., Public preferences for biodiversity conservation and climate-change mitigation: A choice experiment using ecosystem services indicators. Land Use Policy 2013, 34, 282-293.
12. Mallawaarachchi, R.; Morrison, M. D.; Blamey, R. K., Choice modelling to determine the significance of environmental amenity and production alternatives in the community value of peri-urban land: Sunshine Coast, Australia. Land Use Policy 2006, 23, (3), 323-332.
13. Broch, S. W.; Strange, N.; Jacobsen, J. B.; Wilson, K. A., Farmers' willingness to provide ecosystem services and effects of their spatial distribution. Ecological Economics 2013, 92, 78-86.
14. García-Llorente, M.; Martín-López, B.; Nunes, P. A. L. D.; Castro, A. J.; Montes, C., A choice experiment study for land-use scenarios in semi-arid watershed environments. Journal of Arid Environments 2012, 87, 219-230.
15. Cerda, C.; Ponce, A.; Zappi, M., Using choice experiments to understand public demand for the conservation of nature: A case study in a protected area of Chile. Journal for Nature Conservation 2013,
21, (3), 143-153.
16. Chang, T.-Y.; Tsai, B.-W. Indigenous Traditional Territory: Research Report; Council of Indigenous People, Executive Yuan: Taipei, Taiwan, 2003.
17. Hwaung, Y.-H. Hometown of Others: On Displacement and Autonomy Movement of Karowa Indigenous People from the Perspective of Space Hegemony. National Dong Hwa University, Hualien, Taiwan, 2003. 18. Tai, H.-S., Cross-Scale and Cross-Level Dynamics: Governance and Capacity for Resilience in a
Social-Ecological System in Taiwan. Sustainability 2015, 7, (2), 2045-2065.
20. Lee, C.-H., Tourist's Preference toward Community Ecotourism in Forest Park- a Case of Taiwan. In 12th WEAI International Conferences, Singapore, 2016.
21. Messier, C.; Puettmann, K. J.; Coates, K. D., Managing forests as complex adaptive systems: Building resilience to the challenge of global change. Routledge: UK, 2013.
22. Hanley, N.; Mourato, S.; Wright, R. E., Choice Modelling Approaches: A Superior Alternative for Environmental Valuatioin? Journal of economic surveys 2001, 15, (3), 435-462.
23. Chen, Y.-H. Environmentally friendly direct payment policies in Taiwan and Germany; Council of Agriculture, Executive Yuan: 2012.
24. Christensen, T.; Pedersen, A. B.; Nielsen, H. O.; Mørkbak, M. R.; Hasler, B.; Denver, S., Determinants of farmers’ willingness to participate in subsidy schemes for pesticide-free buffer zones—A choice experiment study. Ecological Economics 2011, 70, (8), 1558-1564.
25. Westerberg, V. H.; Lifran, R.; Olsen, S. B., To restore or not? A valuation of social and ecological functions of the Marais des Baux wetland in Southern France. Ecological Economics 2010, 69, (12), 2383-2393. 26. Guimarães, M. H.; Madureira, L.; Nunes, L. C.; Santos, J. L.; Sousa, C.; Boski, T.; Dentinho, T., Using
Choice Modeling to estimate the effects of environmental improvements on local development: When the purpose modifies the tool. Ecological Economics 2014, 108, 79-90.
27. Gibson, J. M.; Rigby, D.; Polya, D. A.; Russell, N., Discrete Choice Experiments in Developing Countries: Willingness to Pay Versus Willingness to Work. Environmental and Resource Economics 2015, 1-25. 28. Šrůtek, M.; Urban, J., Organic Farming A2 - Jørgensen, Sven Erik. In Encyclopedia of Ecology, Fath, B.
D., Ed. Academic Press: Oxford, 2008; pp 2582-2587.
29. Fan, S.; Brzeska, J., Sustainable food security and nutrition: Demystifying conventional beliefs. Global Food Security in press.
30. Lefebvre, M.; Langrell, S. R. H.; Gomez-y-Paloma, S., Incentives and policies for integrated pest management in Europe: a review. Agronomy for Sustainable Development 2015, 35, (1), 27-45.
31. Birol, E.; Karousakis, K.; Koundouri, P., Using a choice experiment to account for preference heterogeneity in wetland attributes: The case of Cheimaditida wetland in Greece. Ecological Economics
2006, 60, (1), 145-156.
32. Spalding, R., Water Management in the High Alpujarra, Granada Province, Andalucía, Spain: Prospects for Sustainability. In II Anglo Spanish Symposium on Rural Geography, University of Valladolid, Spain, 2000.
33. Chaminuka, P.; Groeneveld, R. A.; Selomane, A. O.; van Ierland, E. C., Tourist preferences for ecotourism in rural communities adjacent to Kruger National Park: A choice experiment approach. Tourism Management 2012, 33, (1), 168-176.
34. Juutinen, A.; Mitani, Y.; Mäntymaa, E.; Shoji, Y.; Siikamäki, P.; Svento, R., Combining ecological and recreational aspects in national park management: A choice experiment application. Ecological Economics
2011, 70, (6), 1231-1239.
35. Rai, R. K.; Scarborough, H., Nonmarket valuation in developing countries: incorporating labour contributions in environmental benefits estimates. Australian Journal of Agricultural and Resource Economics 2015, 59, (4), 479-498.
36. Louviere, J. J.; Hensher, D. A.; Swait, J. D., Stated Choice Methods : Analysis and Application. Cambridge University Press: Cambridge, 2000.
Management 1993, 37, (1), 1-22.
39. Maxwell, S., Valuation of rural environmental improvements using contingent valuation methodology: a case study of the Marston Vale Community Forest project. Journal of Environmental Management 1994,
41, (4), 385-399.
40. Breffle, W. S.; Morey, E. R.; Lodder, T. S., Using contingent valuation to estimate a neighbourhood's willingness to pay to preserve undeveloped urban land. Urban Studies 1998, 35, (4), 715-727.
41. Lienhoop, N.; Brouwer, R., Agri-environmental policy valuation: Farmers’ contract design preferences for afforestation schemes. Land Use Policy 2015, 42, 568-577.
42. Birol, E.; Koundouri, P., Choice Experiments Informing Environmental Policy: A European Perspective. Cheltenham: Edward Elgar, 2008.
43. Garrod, K. G.; Willis, G., Economic Valuation of the Environment. Methods andCase Studies. Cheltenham.: Edward Elgar, 1999.
44. Dachary-Bernard, J.; Rambonilaza, T., Choice experiment, multiple programmes contingent valuation and landscape preferences: How can we support the land use decision making process? Land Use Policy 2012,
29, (4), 846-854.
45. Train, K., Discrete Choice Methods with Simulation. second ed.; Cambridge University Press: London, 2009.
46. McFadden, D., Conditional logit analysis of qualitative choice behaviour. In Frontiers in Econometrics, P, Z., Ed. Academic Press: New York, 1974; pp 105-142.
47. Lancaster, K., A new approach to consumer theory. The journal of political economy 1966, 74, 132-157. 48. Markandya, A.; Perelet, R.; Mason, P.; Taylor, T., Dictionary of Environmental Economics. Earthscan
Publications Ltd: UK, 2001.
49. Bateman, I. J.; Carson, R. T.; Day, B.; Hanemann, M.; Hanley, N.; Hett, T.; Jones-Lee, M.; Loomes, G.; Mourato, S.; Özdemiroglu, E.; Pearce, D. W.; Sugden, R.; Swanson, J., Economic valuation with stated preference techniques: a manual. Edward Elgar Publishing Ltd: Northampton, MA, USA, 2002.
50. Hausman, J.; Wise, D., A Conditional Probit Model for Qualitative Choice: Discrete Decisions Recognizing Interdependence and Heterogeneous Preferences. Econometrica 1978, 46, (2), 403-426. 51. Hensher, D.; Rose, J. M.; Greene, W. H., Applied Choice Analysis. A Primer. Cambridge University Press:
UK, 2005.
52. Mulatu, D. W.; van der Veen, A.; van Oel, P. R., Farm households' preferences for collective and individual actions to improve water-related ecosystem services: The Lake Naivasha basin, Kenya. Ecosystem Services
2014, 7, 22-33.
53. Cranford, M.; Mourato, S., Community conservation and a two-stage approach to payments for ecosystem services. Ecological Economics 2011, 71, 89-98.
54. Lizin, S.; Van Passel, S.; Schreurs, E., Farmers’ perceived cost of land use restrictions: A simulated purchasing decision using discrete choice experiments. Land Use Policy 2015, 46, 115-124.
55. Garrod, G.; Ruto, E.; Willis, K.; Powe, N., Heterogeneity of preferences for the benefits of Environmental Stewardship: A latent-class approach. Ecological Economics 2012, 76, 104-111.
56. Lindberg, K.; Veisten, K., Local and non-local preferences for nature tourism facility development.
Tourism Management Perspectives 2012, 4, 215-222.