Article
Multitask Saliency Detection model for SAR Image
and Its Application in SAR and Optical Image Fusion
Chunhui Liu 1,2,*, Yue Qi 2 and Wenrui Ding 1,3
1 Unmanned Systems Research Institute, Beihang University, Beijing 100191, China; [email protected] (W. D.)
2 State Key Laboratory of Virtual Reality Technology and System, Beihang University, Beijing 100191, China; [email protected] (Y. Q.)
3 Collaborative Innovation Centre of Geospatial Technology, Wuhan 430000, China * Correspondence: [email protected]; Tel.: +86-10-8231-7397
Abstract: Saliency detection in synthetic aperture radar (SAR) image is a difficult problem. This paper proposed a multitask saliency detection (MSD) model for the saliency detection task of SAR image. Firstly, we extract four features of SAR image as the input of the MSD model, which include the intensity, orientation, uniqueness and global contrast. Then, the saliency map is generated by the multitask sparsity pursuit (MTSP) which integrates the multiple features collaboratively. Subjective and objective evaluation of the MSD model verifies its effectiveness. Based on the saliency maps of the source images, an image fusion method is proposed for the SAR and color optical image fusion. The experimental results of real data show the proposed image fusion method is superior to the presenting methods in terms of several universal quality evaluation indexes, as well as in the visual quality. The salient areas in the SAR image can be highlighted and the spatial and spectral details of color optical image can also be preserved in the fusion result.
Keywords: synthetic aperture radar; features extraction; saliency detection; image fusion
1. Introduction
1.1. Saliency detection of SAR image
Synthetic aperture radar (SAR) technology is one of the most important advances in the field of remote sensing in recent decades. Among the broad applications of SAR, automatic target recognition (ATR) is hot issue. Conventional target detection algorithms include constant false alarm rate (CFAR) or support vector machines (SVM), etc, where the detector is applied in pixel-by-pixel manner. In recent years, visual saliency detection has been of great research interest. Although many saliency detection models have been proposed in the past few years, they mainly focus on the natural images [1-3] rather than SAR images. Because the SAR images are very different from the visible images in terms of the gray scale feature, some objects such as flat roads, airports and bridges, are bright in natural images but dark in SAR images. This difference makes the classical saliency detection method for natural images not applicable to SAR images, even these methods completely failed in some cases. Figure 1 shows a failure case of the saliency detection for SAR image by the classical Itti’s method [1]. Figure 1(a) is a color image of a runway, and Figure 1(b) is the corresponding SAR image of Figure 1(a) after registration. Figure 1(c) shows the saliency map detected by Itti’s method. As shown in Figure 1(c), the scene surrounding the runway is "highlighted", but the runway itself and the corner reflectors on the runway cannot be detected by Itti’s method. This is because the traditional salieny detection models designed for the SAR images have not taken into account the inherent characteristics of the SAR images, such as intensity, direction and point target, etc. So it is essential to establish saliency detection model designed specifically for the SAR images.
(a)natural image
(b)SAR image
(c)Result by Itti’s model
Figure 1. Failure case of saliency detection of SAR image
Until now, limited number of work has tried to apply saliency detection to SAR images. Amoon et al. [4] introduced it in SAR image ship detection, their method can remove disturbs come from the land. Bo et al. [5] proposed a low-level visual feature based SAR image saliency detection method, which performs well for detecting small objects. Jäger et al. [6] considered the saliency of SAR images from the perspective of entropy and change in the context, while Zhang et al. [7] proposed a self-adaptive neighborhood based SAR image de-speckling method by combining the saliency map and threshold selection.
In the recent research, most scholars start to combine the visual attention model with other methods to enhance the saliency detection result. Dou [8] combines the strength of gradient saliency map and scattering structure features to improve accuracy and efficiency of target detection in SAR images. Wang [9] proposed a new hierarchical saliency filtering method for fast and accurate ship detection in high-resolution SAR images. Song [10] proposed a region- and edge-based convex active contour model, which combines the advantages of a multi-scale saliency detection method to address a target detection problem in a large-scale and high-resolution SAR image automatically.
Generally most methods in the field of saliency detection of SAR images draw on the human visual attention mechanism which is based on the "bottom-up" visual attention framework [1,4-8]. The "bottom-up" mechanism requires that the features of SAR images can be analyzed and extracted firstly. However, the current saliency detection models have not fully analyzed the features of the SAR images. Meanwhile, the cross-feature information has not been well considered, thus a more accurate saliency detection result cannot be obtained by the existing methods.
1.2. SAR and optical image fusion
With the rapid developments in the field of aviation technology, many novel platform, such as unmanned aerial vehicle (UAV), start to play more and more important role in the remote sensing application. The modern airborne surveillance and reconnaissance systems are usually multi-sensor system, which is always consisted of optical camera, infrared camera (IF), synthetic aperture radar (SAR), etc. Due to the all-weather and all-time ability, SAR imaging system can provide much complementary information to optical images. SAR and optical image fusion can combine information from each source images of the same scene into one single image to obtain data that is more useful than that from the individual source image. It also can reduce imprecision and uncertainty in the spatial properties and maintain completeness of the spectral information.
For the SAR imaging system, we mainly focus on the areas where more salient target may exsit in SAR images. For the optical and SAR image fusion, the more salient the area in the SAR image is, the higher proportion of the area should be integrated into the fusion result. The areas where ambient or less salient object exists have no necessity to be fused into the image. Thus, introducing the saliency information of the source images into the fusion procedure can hopefully enhance the fusion performance in SAR and optical image fusion.
methods are the intensity–hue–saturation (IHS) and its variants [11,12], and the principal component analysis (PCA) [13], etc. The other category is the transformed domain based methods, which achieve the fusion procedure with certain frequency or time–frequency transforms. The most popular transform domain based methods are based on the multi-scale transforms. The commonly used multi-scale transforms include various pyramids [14], discrete wavelet transform (DWT) [15], contourlet [16], etc. Recently, sparse representation (SR) and its variants [17-20] have produced state-of-the-art results in multi-sensor image fusion, which exploit the self-similarity properties of natural images.
However, most of the existing image fusion methods are less use of the salient information. Although some of the methods based on multi-resolution analysis (MRA) [21] have used the saliency information to develop the fusion strategy, they mainly depend on the "regional segment" of the source image based on the saliency map. This lead to the fact that obvious "block effect" appears on the fusion result, and the relationship between saliency information and the fusion procedure is separated. Therefore, an effective integration of the saliency information and the image fusion need to be explored in SAR and optical image fusion.
1.3. Our work
In this paper, we present a multitask saliency detection (MSD) model based on multitask sparse pursuit (MTSP) [22] which treat saliency detection as a sparsity pursuit problem and integrate multiple types of features for detecting saliency collaboratively. Before that, the four features of the SAR image are extracted which include the intensity, orientation, uniqueness and global contrast. All these feature maps are constructed and normalized as the input of the MTSP model, which can integrate multiple visual features and cross-feature information into a unified inference procedure. Then a more accurate and reliable saliency detection result can be provided for the further application of the saliency map.
Based on the saliency information of the SAR image obtained by MSD model, we develop a fully automatic SAR and optical image fusion method with saliency preserving. Firstly, we build up the fusion gradient field for the source images based on structure tensor. Then, a normalized weight is assigned to each pixel in the source images according to the saliency maps of the source images. At last, the variational optimization problem is solved to obtain the fusion result closest to the source image in the sense of the weighted gradient. We test this fusion procedure on the application of SAR and color optical image fusion. The experimental results show that our method allows the spatial and spectral details of optical image data to be preserved and to better characterize the salient areas in the source images.
In Section 2, the proposed MSD model is described in detail. The procedure of SAR and optical image fusion is introduced in Section 3. In Section 4, we compare the saliency detection and fusion results obtained by our method with that of existing methods. Discussion and conclusions are presented in Section 5 and Section 6, respectively.
2. Multi-task Saliency Detection Model for SAR image
2.1. Model overview
Figure 2. Workflow of the Multitask Saliency Detection Model
2.2. Features extraction
As the basis of the proposed saliency detection model, how to extract the four typical features of the SAR image is a key issue. The mathematical expression and its corresponding calculation method of these features is introduced as follow.
(1) Intensity feature
The intensity feature is firstly produced by the gray level co-occurrence matrix (GLCM) [21] which describes how often on gray level appears in a specified spatial relationship with another
gray level. The entry at
( )
i j, of the GLCM indicates the number of occurrences of the pair of gray.After construction of GLCM, we choose the entropy measure of GLCM intensity descriptor. Entropy measures the randomness of the elements of the co-occurrence matrix. It is maximum when elements in the matrix are equal, while is equal to 0 if all elements are different.
( )
(
)
2 log
K K
ij ij
i i
intensity
Entropy p p
C N Entropy
= −
=
(1)
wherepijrepresents the elements of the co-occurrence matrix andKis the number of gray levels
used to reduce the size of the matrix, which is set 16 in our experiment,N
( )
• is the normalizationoperator andCintensityis the intensity feature map.
(2) Orientation feature
The orientation feature is obtained from the source images using 2D Gabor filters [23], which are the product of a cosine grating and a 2D Gaussian envelope and can be expressed as follow:
(
)
2 2
2 1
, , , , , exp exp
2
i i i
k
x y ix
H x yθ λ α β π θ θ π θ
παβ α β λ
= − +
(2)
where
α
andβare the standard deviation on the X axis and Y axis of the Gaussian functionrespectively,θkandλ denotes the phase and wavelength of Sine wave.θk,xθkandyθkare calculated
(
)
( )
( )
( )
( )
1 , 1, 2,
cos sin sin cos k k k k k k k
k k n
n
x x y
y x y
θ θ π θ θ θ θ θ = − = = + = − + (3)
Whenθkis selected as different value,the Gabor filters onn different directions can be
obtained. We setn=4to get four orientation feature maps on the orientations of0o,45o,90o
and
135o.
The final orientation feature map can be obtained by the linear sum of the four feature maps
( )
Ori
F θ , as follow:
{0 ,45 ,90 ,135o o o o}
(
( )
)
Orientation Ori
C N F
θ∈ θ
= ⊕ (4)
whereCOrientationdenotes the final orientation feature map,⊕denotes the linear addition operation on
the corresponding pixels of the four feature maps .
(3) Uniqueness feature
According to the characteristics of SAR imaging system, some targets such as the corner reflector object formed as the point targets which are very sparse in the SAR images. We believe the
point targets are very unique, so we can use pixel frequency to represent the uniqueness feature of
the image. We compute the 98th percentile of the SAR image which is present as
98
Z . In a search
region of3 3× ,if more than 6 pixels have greater values thanZ98, all of the pixels in the region will
be retained, otherwise the region will be filled with black. Through normalized operation, the
uniqueness feature mapCUniquenesscan be obtained.
(4) Global contrast feature
Global contrast feature can be defined as the difference between a region (pixel) and the whole
image. For the pixelI x y
( )
, , its global contrast feature map can be quantified as follow:( ) ( )
( )
( )
( )
( )
( )
( )
(
)
1 , , , , , , ,0 , , ,
i N j M
Global contrast
val x y I x y I x y
N M val x y val x y g x y
val x y
C N g x y
α α ∈ ∈ = − × ≥ = < =
(5)whereg x y
( )
, denotes the global contrast at location( )
x y, ,αis a parameter that can be adjustedartificially (we set it as the mean value of the entire image pixel ) andCGlobal contrastis the final global
contrast feature map.
2.3. Generation of saliency map
The MTSP method [22] treats the saliency detection as a sparsity pursuit problem and integrates multiple types of features for detecting saliency collaboratively. Since the cross-feature information has been well considered, such a joint inference scheme can produce more accurate and reliable results than the models of producing the saliency maps individually.
The MTSP can be seen as a multitask generalization of the low-rank representation (LRR).
MTSP seeks a jointly sparse matrixEby solving the following convex optimization problem:
1 1 2,1 ,..., 1 ,...,E min
. . , 1,
K K
K i
Z Z i
E
i i i i
Z E
s t X X Z E i K
λ ∗ = + = + =
(6)where •∗denotes the matrix nuclear norm, parameterλ >0is balance factor and •2 1,is the2 1,norm
( )
(
)
22 1= ,
i j
E ,
E j i (7)whereE j i
( )
, is the( )
j i, th entry ofE. AndXidenotes theith type of feature.In Eq.(6),Eiis theith saliency feature (hereK=4) and they are Cintensity,COrientation,CUniquenessand
global contrast
C for SAR image.E=
[
E E1; ; ;2 EK]
denotes the joint matrix by vertically concatenating1 2 K
E, ,E E together along the column. The non-salient and salient targets are identified byX Zi i
andZi, respectively. Since the columns in different matrices with the same index correspond to the
same image patch, this technique is also to encourage different features to produce consistent saliency maps. In this way, the cross-feature information is naturally modeled such that the multiple features will take effects collaboratively.
Problem (5) is convex and can be optimized, and it can be converted into the following equivalent problem: 1 1 1 2,1 ,..., 1 ,..., ,...,E min s.t.
= , 1, , .
K K K K i J J i Z Z E
i i i i
i i
J E
X X Z E
Z J i K
λ ∗ = + = + =
(8)This problem can be solved with the ALM method [22], and the optimization procedure is listed as follow:
Input: Data matrices
{ }
Xi and parameterλ(we setλ=0.05in our implementation).While not converged do
Step 1: Fix the others and updateJ1, ,J2JKby
2 * 1 1 arg min 2 i
i J i i
F
W
J J J Z
μ μ
= + − +
Step 2: Fix the others and updateZ1, ,Z2ZKby
(
)
TT i i i
i i i i i
X Y W
Z M X X E J
μ
−
= − + +
where
(
)
1
1
K T
i i
i
M= +I
= X X −Step 3: Fix the others and updateE=
[
E E1; ; ;2 EK]
by2 2,1 1 arg min 2 F E
E λ E E G
μ
= + −
whereGis formed by vertically concatenating the matricesXi−X Zi i+Yi μ,i=1, , Ktogether
along column.
Step 4: Update the multipliers
(
)
(
)
i i i i i i
i i i i
Y Y X X Z E
W W Z J
μ μ
= + − − = + −
Step 5: Update the parameterμby
(
10)
min ,10
μ= ρμ
where the parameterρ decides the convergence speed. It is set asρ =1.1in our experiments.
Step 6: Check the convergence condition:Xi−X Zi i−Ei →0and Zi− →Ji 0,i=1, , . K
end while
LetE*=
{
E1*, , EK*}
be the optimal solution to problem (5). We quantify the response of thesparse matrices as follow to obtain a saliency value forith patchPi:
( )
*( )
2 1
:,
K
i j
j
S P E i
=
=
(9)where E*j
( )
:,i 2denotes the2norm of theith column of*
j
E . The final saliency map is synthesized
by the saliency values of each patch (from Equation (9)).
3. SAR and optical image fusion guided by saliency map
For the SAR and color optical image fusion application, we design the practical fusion procedure which integrates the saliency information of the source images, as shown in Figure 3.
Figure 3. Fusion procedure of the SAR and color optical image
Firstly, the color optical image is firstly transformed from RGB color space to IHS color space by IHS transform as following Equation:
(
)
1
2
1 2 1
2 2
1 2
1 3 1 3 1 3 1 6 1 6 2 6
1 2 1 2 0
tan
I R
v G
v B
H v v
S v v
−
= −
= = +
(10)
whereI denotes intensity, H denotes hue andSdenotes saturation. The hue componentH and
saturation componentSare preserved for the inverse IHS transform in the final step, and the
intensity componentIis used to fuse with SAR image.
We adopt the variational model [24] to perform the image fusion progress, which can preserve the salient information and enhance the contrast for visualization. The saliency map of SAR image
is obtained by the proposed MSD model described above, which is normalized asS1. The saliency
map of optical image is obtained by a fast and efficient saliency detection model-GBVS method
[25], which is normalized asS2. The saliency mapsS1andS2are adopted to guide the fusion
progress which critical point is to construct the target gradientV which should reflect the salient
features of the source image as much as possible.
( )
( )
( )
( )
( )
( )
( )
( )
1
1 2 2
1 2
2
2 2 2
1 2 , w , , , , w , , ,
S x y x y
S x y S x y
S x y x y
S x y S x y
=
+
=
+
(11)
We construct the weighted structure tensor [26] as follow:
( )
2 2 2 2 w w , w wk k k
k k
k k
k k k
k k
k k
I I I
x x y
C x y
I I I
x y y
∂ ∂ ∂ ⋅ ∂ ∂ ∂ = ∂ ∂ ∂ ⋅ ∂ ∂ ∂
(12)whereC x y
( )
, denotes the weighted structure tensor andIkdenotes thekth source image.The target gradientV x y
( )
, at pixel( )
x y, is constructed by eigen-decomposition onC x y( )
, . Thesquare root of the maximum eigen-value ofC x y
( )
, is the magnitude of gradient and correspondingeigen-vector is the direction respectively. To make the orientation ofV to agree with that of the
gradient of the average of all inputs, the following expression of the target gradient is presented:
( )
, sign wk( )
, k( )
,k
V x y = λ θ+ ⋅ ⋅+ θ+⋅ x y ∇I x y
(13)whereλ+is the maximum eigenvalue ofC x y
( )
, andθ+is the corresponding eigenvector.The fusion resultIf
( )
x y, can be found by minimizing the following optimization problem [27]:( ) ( )
( )
[
]
2
min , ,
s.t. , 0, 255
f
f
I x y V x y dxdy
I x y
Ω∇ −
∈
(14)Such a function as Equation (14) can be solved by the iterative steps as follow:
( )
( )
(
( )
( )
)
( )
(
(
( )
)
)
1 2
1 2
, = , 1 4 , div ,
, max 0, min 255, ,
t t t
f f f
t t
f f
I x y I x y I x y V x y
I x y I x y
+ + + Δ − = (15)
Based on the equations above, the fused intensityIfcan be obtained. Finally, the fusion result is
obtained by performing inverse IHS transform of the originalH channel,Schannel of the color
optical image and newI channel—the fused intensityIf . The final fusion result in RGB color space
could be calculated by following equations:
1 2 1 2 cos( ) sin( )
1 3 1 6 1 2
1 3 1 6 2
1 3 2 6 0
f
v S H
v S H
R I G v B v = ⋅ = ⋅ = − − (16)
4. Experimental Results
4.1. Study region and dataset
altitude of 3000m. A SAR imaging system and a CCD camera are mounted together on the UAV, which formed a multi-sensor system. The study region locates in an urban area in central plains of
China. Figure 4 shows the study region and corresponding flight course.
Figure 4. Study region and flight course.
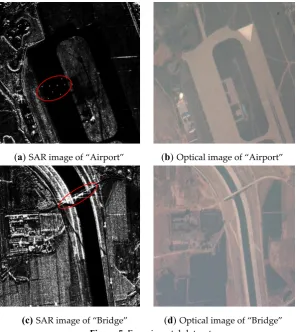
Two sets of co-registered SAR and color images are used to evaluate the proposed mode, which are shown in Figure 5.
(a)SAR image of “Airport”
(b)Optical image of “Airport”
(c)SAR image of “Bridge”
(d)Optical image of “Bridge” Figure 5. Experimental dataset.
We validated the proposed MSD model on the saliency detection of SAR images. After that, the SAR and optical image fusion by the proposed fusion procedure in Figure 3 is also tested.
4.2. Validation on saliency detection of SAR images
The proposed MSD model is compared with four existing saliency detection methods, which are selected as benchmarks, i.e., the CFAR [28] approach and three saliency-based approaches, namely SoP [29], PCT [30], and PR [31]. CFAR is the conventional method of target detection in SAR images. A threshold is calculated by the false alarm rate of statistical distribution and applied to the image to obtain the detection result. However, if a target in the SAR image has similar intensity level as its surroundings, CFAR leads to high false-alarm rate. SoP is a SAR image saliency detection algorithm that considers the local, global saliency information and the statistical distribution of SAR images. PCT is a bottom-up attention model based on pulsed Hebbian neural networks, which is directly applied to ship detection in SAR images. PR is a new approach for saliency detection of SAR image based on the idea of pattern recurrence which quantifies the saliency of a local patch by how well it can be reconstructed from patches in the background.
Figure 6 and Figure 7 show the saliency detection results of CFAR, SoP, PCT, RP and the proposed method applied to the SAR images in Figure 5(a) and Figure 5(c). The corresponding original SAR image is also given in Figure 6 and Figure 7 as reference.
(a) original SAR image of “Airport” (b) result of CFAR method (c) result of SoP method
(a) original SAR image of “Bridge” (b) result of CFAR method (c) result of SoP method
(d) result of PCT method (e) result of RP method (f) result of proposed model Figure 7. Saliency detection result of “Bridge”.
For the case of Figure 5(a), main challenge for all the saliency detection methods is detecting the corner reflectors on the runway of the airport. All the methods that considered the local information work well in that regard, including CFAR, SoP and the proposed model. Among the three methods, the proposed MSD model can detect the salient area comprehensively and accurately. By contrast, the CFAR and SoP methods can only detect the local salient information such as edges or lines. The proposed method works better in terms of detection the salient areas of the background. This is exactly the strengths of proposed method that integrates the four typical features of SAR image. In contrary, the PCT and RP methods that only consider the global information fail to detect the detail information such as the corner reflectors and result in worse detecting performance than the proposed model.
The salient areas of Figure 5(c) include the bridge and its surrounding building areas, thus this case concentrates on testing the global saliency detecting ability of the five methods. The CFAR and SoP methods failed in this case, because both the two methods focus on the calculation of local intensity and the detecting results seems not comprehensive. In comparison, the other three saliency detectors, the PCT, RP, and the proposed methods have better detecting performance. Compared to the PCT and RP methods, the saliency map generated by the proposed method agrees better with our expectation.
In summary, the major advantage of the proposed MSD model would be both global and local saliency detection of the input image which is due to well integration of multiple features as well as the utility of the cross-feature information. Such advantage is more important for SAR images as it usually involves unknown size target or point target, and it is stressed by the above results.
As a quantitative evaluation, we compared the saliency detection results using the proposed method with respect to human-annotated “ground truth”. For example, in Figure 3(a) and Figure 3(c), the corner reflectors and the vehicles on the bridge are first isolated by the red circles. Within each red circle, a threshold is applied to further label out pixels that are considered “target pixels”.
We define probability of detectionPdat pixel level as the ratio between the number of detected pixels
defined as the ratio between the number of falsely detected pixels versus the total number of pixels detected.
(a) ROC curvesPdversusPfaof the “Airport” (b) ROC curvesPdversusPfaof the “Bridge”
Figure 8. ROC curves of the saliency detection results.
Figure 8 plots the receiver operating characteristic (ROC) curves [27] of each case shown in Figure 6 and Figure 7. The proposed MSD saliency detector performs much better than standard
CFAR-based detector. In Figure 8(a), at the false-alarm ratioPfa= 21%, the detection ratioPdof
proposed method is 95%, while for CFAR, it is aboutPd= 64%. In Figure 8(b), the false-alarm ratioPfa
of proposed method is 29% at the detection ratioPd = 99%, while it isPfa =78% for CFAR. We can
draw the conclusions that the proposed method obtains much better performance than the classical CFAR method in the ability of saliency detection.
4.3. Validation on SAR and optical image fusion
The proposed fusion method is compared with four fusion methods, including principal component analysis (PCA) [13], discrete wavelet transform (DWT) [15], non-sampled contourlet transform (NSCT) [16] and joint sparse representation (JSR) [17]. PCA is a spectral transformation that has been widely employed for pan-sharpening. DWT is developed by setting different fusion rules for combining the coefficients of low frequency and high frequency sub-bands of the two source image separately in discrete wavelet domain, but it sometimes produces Gibbs effect in some degree. NSCT is a multiple resolution analysis method which introduces has shift invariant property, and has been applied for remote sensing image fusion in recent years. JSR is a novel image fusion method, by which source image is represented with the common and innovation sparse coefficients based on joint sparse representation. The experiment results are shown in Figure 9 and Figure 10.
(d) result of NSCT method (e) result of JSR method (f) result of proposed model Figure 9.Fusion result of “Airport”.
(a) original SAR image of “Bridge” (b) result of PCA method (c) result of DWT method
(d) result of NSCT method. (e) result of JSR method (f) result of proposed model Figure 10. Fusion result of “Bridge”.
As shown in Figure 9 and Figure 10, the spectral characteristics of the optical images have been distorted by PCA and NSCT methods, and this may cause the wrong interpretation of the target information. The fusion results by DWT method result in many speckle noises, though it can preserve the salient area in SAR image, especially the corner reflectors in Fig9(c). The results produced by JSR method contain detail spectrum information of the optical image and preserve the features of SAR image as much as possible, but it still introduces some speckle of SAR image. Comparing to the four fusion methods above, our proposed fusion method presents the best visual quality. Through visual observation, we can find that the fusion result by our method includes clear spatial information of the SAR image in the salient area with less speckle noise in non-salient area.
spatial similarity between the fused image and the SAR image, and the higher the value of sCC, the better the spatial similarity. The Quantitative results are reported in Table 1 and Table 2.
Table 1. Quantitative fusion results of “Airport”.
Dataset Metrics Methods
PCA DWT NSCT JSR Proposed
Figure 3. (a)and (b)
ERGAS 48.7851 3.9215 4.5212 3.3678 3.3426
SAM(°) 5.1458 2.9743 4.8911 0.1524 0.1926
RMSE
R 92.9372 26.7938 24.2016 15.3362 0.7312
G 91.0427 19.6666 24.2567 16.2526 0.5196
B 91.7178 21.1328 24.2563 19.7323 0.4239
Avr 91.8992 22.5310 24.2382 17.1070 0.5582
sCC
R 0.01314 0.0711 0.02627 0.1282 0.1274
G 0.05618 0.0825 0.02816 0.0526 0.1612
B 0.01624 0.0989 0.03625 0.1356 0.1891
Avr 0.02852 0.0841 0.0302 0.1055 0.1592
Table 2. Quantitative fusion results of “Bridge”.
Dataset Metrics Methods
PCA DWT NSCT JSR Proposed
Figure 3. (a)and (b)
ERGAS 7.6482 23.584 3.7182 3.8153 2.4451
SAM(°) 6.9974 4.3086 0.24431 0.2209 0.3467
RMSE
R 79.2344 43.5674 21.8714 18.634 14.551
G 75.2026 43.7683 21.2292 18.928 14.724
B 72.5521 43.7042 21.3347 18.327 14.462
Avr 75.663 43.68 21.4784 18.63 14.579
sCC
R 0.06696 0.40236 0.3838 0.2313 0.1112
G 0.01879 0.22361 0.2072 0.1452 0.1314
B 0.06003 0.15325 0.2896 0.1951 0.1525
Avr 0.04859 0.25974 0.29353 0.1905 0.1317
As shown in Table 1 and Table 2, the proposed method yields the best values of all of the spectral evaluation indices, except in the case of SAM values. This illustrates that the fused image produced by the proposed method has better maintained the spectral information of the optical image. From Figure 7 and Figure 8, we can also find that the proposed method does best in keeping the color information compared to the other four methods. We consider the low SAM values
obtained for the results of JSR method to be due to the joint sparse decomposition and our method
It can be seen from Table 1 and Table 2 that the proposed fusion method can provide the fusion result of better spectral and spatial qualities. Therefore, we can conclude that the proposed fusion method can maintain the feature of the salient region in the SAR images while preserving the color information of the optical image.
5. Discussion
Our work aims at giving a deep insight of the saliency information of SAR image and providing a possible application of the saliency map in the SAR and optical image fusion. Our results confirm that the proposed multitask saliency detection (MSD) model is accurate and effective for detecting the saliency of SAR image. Due to the efficient integrity of the multiple features of SAR image, the detecting ability of the MSD model is far better than the state-of-the-art methods. For the SAR and optical image fusion, based on the saliency map detected by MSD model, excellent fusion performance is obtained by the proposed variational fusion method.
Most existing saliency detection methods are local or global only, much less introducing the consideration of multiple features. Due to the characteristic of SAR images such as intensity concentration, the unknown size of target, full of speckle noise, etc, our method takes into account the typical features related to the areas of potential target before saliency detection. It makes the saliency maps generated by the MSD model more comprehensively covering the salient information of SAR image.
As mentioned in the introduction part, existing image fusion methods have not well used the salient information of the source images, especially in SAR and optical image fusion. The proposed fusion method can effectively integrate the saliency information into the fusion progress. The salient and non-salient areas can be preserved as much as possible in the fusion results and both subjective and objective evaluation verifies this point.
However, the computational complexity of the MSD model is relatively high, especially for real-time applications. It makes the MSD method more suitable for SAR image post-processing. One subject that remains to be explored is to find more features which can express the characteristic of SAR image for more specific applications, such as target recognition. In addition, the saliency map obtained by the MSD model is only tested on the image fusion experiment, other types of experiments adopted the saliency result need to be conducted.
6. Conclusions
A multitask saliency detection (MSD) model for SAR image is proposed which adopts the generic model of multitask sparsity pursuit (MTSP). Four features of synthetic aperture radar (SAR) image is extracted which include the intensity, orientation, uniqueness and global contrast. We establish the mathematical expressions and calculation method of the four features which can be the input of the MTSP. The saliency map of the SAR image can be obtained from the solution of the MTSP. Through subjective and objective comparison with several state-of-the-art saliency detecting methods, we can conclude that our proposed MSD model has better saliency detecting ability than the presenting methods.
We test the saliency detection result on SAR and optical image fusion application and proposed an image fusion method which guided by saliency maps. Due to introducing the salient information of the source images into the fusion procedure, the different features of the both the SAR and optical images can be maintained effectively. Accuracy assessment for real data shows a great potential of proposed fusion method. Future research can be directed towards to conducting more experiments of source data with various geographical features to adequately test the MSD model and the image fusion procedure. To well exploit the target information of the SAR image as the feature of the MSD model may also be worth investing effort.
Author Contributions: C. L. performed the experiments and wrote the main part of the manuscript. Y. Q. wrote the abstract, introduction and conclusions. W. D. revised the manuscript.
Conflicts of Interest: The authors declare no conflict of interest.
References
1. Itti, L.; Koch, C.; Niebur, E. A model of saliency-based visual attention for rapid scene analysis. IEEE Trans. Pattern Anal. Mach. Intell. 1998, 20, 1254–1259.
2. Hou, X.; Zhang, L. Saliency detection: A spectral residual approach. In Proceedings of the 2007 IEEE Computer Society Conference on Computer Vision and Pattern Recognition (CVPR2007), Minneapolis, Minnesota, USA, 18-23 June 2007; pp. 1–8.
3. Guo, C.; Ma, Q.; Zhang, L. Spatio-temporal saliency detection using phase spectrum of quaternion Fourier transform. In Proceedings of the 2008 IEEE Computer Society Conference on Computer Vision and Pattern Recognition (CVPR2008), Anchorage, Alaska, USA, 24-26 June 2008; pp. 1–8.
4. Amoon, M.; Bozorgi, A.; Rezai-rad, G. New method for ship detection in synthetic aperture radar imagery based on the human visual attention system. Journal of Applied Remote Sensing 2013, 7, 071599–071599. 5. Bo, H.; Gu, H.Y; Sun, Q. Visual Attention Based SAR Image Small Target Detection. Journal of
Computational Information Systems 2013, 9, 179–186.
6. Jäger, M.; Hellwich, O. Saliency and salient region detection in SAR polarimetry. In Proceedings of the IEEE International Geoscience and Remote Sensing Symposium (IGARSS2005), Seoul, Korea, 25–29 July 2005; pp. 2791–2794.
7. Zhang, X.H.; Meng, H.Y.; Ma Z.F.; Tian X.L. SAR image despeckling by combining saliency map and threshold selection. International Journal of Remote Sensing 2013, 34, 7854–7873.
8. Dou, F.; Diao, W.; Sun, X. Aircraft recognition in high resolution SAR images using saliency map and scattering structure features. In Proceedings of the 2016 IEEE International Geoscience and Remote Sensing Symposium (IGARSS2016), Beijing, China, 10-15 July 2016; pp. 1575-1578.
9. Wang, S.G.; Wang, M.; Yang, S.Y. New Hierarchical Saliency Filtering for Fast Ship Detection in High-Resolution SAR Images. IEEE Transactions on Geoscience & Remote Sensing 2017, 55, 351-362.
10. Song, T.; Yi, S. Fast and Accurate Target Detection Based on Multiscale Saliency and Active Contour Model for High-Resolution SAR Images. IEEE Transactions on Geoscience & Remote Sensing 2016, 54, 1-16. 11. Choi, M. A new intensity–hue–saturation fusion approach to image fusion with a tradeoff parameter. IEEE
Transactions on Geoscience and Remote Sensing 2006, 44, 1672–1682.
12. Chien, C.L.; Tsai W.H. Image Fusion With No Gamut Problem by Improved Nonlinear IHS Transforms for Remote Sensing. IEEE Transactions on Geoscience and Remote Sensing 2014, 52, 651–663.
13. Shahdoosti, H.R.; Ghassemian, H. Combining the spectral PCA and spatial PCA fusion methods by an optimal filter. Information Fusion 2016, 27, 150–160.
14. Xu, H.; Wang Y.; Wu Y.; Qian Y. Infrared and multi-type images fusion algorithm based on contrast pyramid transform. Infrared Physics & Technology 2016, 78, 133–146.
15. Khan, M.M.; Chanussot, J.; Condat, L.; Montavert, A. Indusion: Fusion of multispectral and panchromatic images using the induction scaling technique. IEEE Geoscience & Remote Sensing Letters 2008, 3, 105–108. 16. Huang, H.D; Wang, B.; Zhang L.M. A new method for remote sensing image fusion based on
nonsubsampled contourlet transform. Journal of Fudan University (Natural Science) 2008, 47, 124–128. 17. Yu, N.; Qiu, T.S.; Bi, F.; Wang, A. Image Features Extraction and Fusion Based on Joint Sparse
Representation. IEEE Journal of selected topics in signal processing 2011, 5, 1074–1082.
18. Goferman, S.; Zelnik-Manor, L.; Tal, A. Context-aware saliency detection. IEEE Transactions on Pattern Analysis and Machine Intelligence 2012, 34, 1915–1926.
19. Itti, L.; Koch, C.; Niebur, E. A model of saliency-based visual attention for rapid scene analysis. IEEE Transactions on Pattern Analysis and Machine Intelligence 1998, 20, 1254–1259.
20. Liu, C.H.; Qi, Y.; Ding, W.R. Airborne SAR and optical image fusion based on IHS transform and joint non-negative sparse representation. In Proceedings of the 2016 IEEE International Geoscience and Remote Sensing Symposium (IGARSS2016), Beijing, China, 10-15 July 2016; pp. 1575-1578.
22. Lang, C.Y.; Liu, G.C.; Yu, J.; Yan, S.C. Saliency Detection by Multitask Sparsity Pursuit. IEEE Transactions on Image Processing 2012, 21, 1327-1338.
23. David, A. Computer Vision—A Modern Approach. Pearson Education, British,2002.
24. Socolinsky D.A. A variational approach to image fusion, Doctoral thesis, The Johns Hopkins University, USA, 2000.
25. Schölkopf, B; Platt, J; Hofmann, T. Graph-Based Visual Saliency. Advances in Neural Information Processing Systems 2006, 19, 545-552.
26. Piella, G. Image fusion for enhanced visualization: A variational approach. International Journal of Computer Vision 2009, 83, 1-11.
27. Hong, R.C.; Wu X.Q.; Wang, C. Multi-focus image fusion with salience preserving. Journal of University of Science & Technology of China 2008, 38, 1173-1179.
28. Gao, G. A parzen-window-kernel-based CFAR algorithm for ship detection in SAR images. IEEE Geoscience and Remote Sensing Letters 2011, 8, 557-561.
29. Huang, X.; Huang, P.; Dong, L.; Song, H. Saliency Detection Based on distance between patches in Polarimetric SAR Images. In Proceedings of the 2014 IEEE International Geoscience and Remote Sensing Symposium (IGARSS2014), Quebec, Canada, 13–18 July 2014; pp. 4572–4575.
30. Yu, Y.; Wang, B.; Zhang L. Hebbian-based neural networks for bottom-up visual attention and its applications to ship detection in SAR images. Neurocomputing 2011, 74, 2008–2017.
31. Wang, H.; Xu, F.; Chen, S. Saliency Detector for SAR Images Based on Pattern Recurrence. IEEE Journal of Selected Topics in Applied Earth Observations & Remote Sensing 2016, 1–6.
32. Rahmani, S.; Strait, M.; Merkurjev, D.; Moeller, M.; Wittman, T. An adaptive IHS PAN-sharpening method. IEEE Geosci. IEEE Geoscience & Remote Sensing Letters 2010, 7, 746–750.
33. Alparone, L.; Baronti, S.; Garzelli, A.; Nencini, F. A global quality measurement of PAN-sharpened multispectral imagery. IEEE Geoscience & Remote Sensing Letters 2004, 1, 313–317.
![Figure 1. Failure case of saliency detection of SAR image Amoon et al. [4] introduced it in SAR image ship detection, their method can remove disturbs come from the land](https://thumb-us.123doks.com/thumbv2/123dok_us/1002055.1600033/2.595.86.518.71.225/figure-failure-saliency-detection-introduced-detection-method-disturbs.webp)