Relationship between water-permeability coefficient and pore-structure indicators
of cementitious materials
Yuya Sakaia
a Institute of Industrial Science, The University of Tokyo, 4-6-1 Komaba, Meguro, Tokyo 153-8505,
Japan, [email protected]
Abstract
To understand the relationship between water permeability and the pore structure of cementitious materials, literature that studied both water permeability and the pore structure are reviewed, and their correlation is studied. Although the majority of this data is for cement paste, mortar, concrete, and cemented soil are also included. Based on this study, it is established the determination coefficient between water permeability and the total pore volume is very low; however, those between water permeability and the critical, threshold, and median pore diameters, respectively, are moderate. On the other hand, the threshold pore diameter, derived based on the percolation theory, exhibits a very high determination coefficient. The calculated water permeability, using the Katz and Thompson equation, agrees with the reported water permeability quantitatively to a certain level, but is overestimated.
Key words: Pore structure, water permeability, cement paste, mortar, concrete, cemented soil
1. Introduction
Most of the deterioration phenomena in concrete structures, including freezing and thawing, rebar corrosion, alkali silica reactions, etc., are caused by water penetration into concrete. Hence, the evaluation of the resistance against water mobility in concrete is critical. Water permeability is one of the indicators of water mobility; however, its evaluation is not easy. For example, for very dense concrete, water permeability evaluation is time consuming, even requiring few weeks at times [1]. This is not preferable because the cement paste matrix may change during this period due to hydration or leaching. Applying high pressure to the permeating water can reduce the time required for this test, but it may increase the risk of water leakage [2]. If water permeability is correlated with another property, such as the pore structure, this difficult test is not required. Moreover, this can be beneficial for numerical simulation because researchers are trying to develop numerical simulations that simulate the pore structure based on the mix design [3, 4], and this relationship is important for estimating the water permeability based on the pore structure. Thus far, several researchers have studied the relationship between water permeability and the pore structure; the relationship between water
Mercury Intrusion Porosimetry (MIP)
permeability and the total pore volume or the pore volume of a certain pore-size range [5-9] or critical pore diameter [10-15], have been reported. Others have used the critical pore diameter [16], median pore diameter [17], or threshold pore diameter [18] as indicators of the pore structure. In these researches, most of the pore-structure indicators in each paper showed good correlation with the water permeability. This is because each research used only their data or few additional data from other researches. As a result, the pore-structure indicator that governs water permeability or the indicator that should be used to estimate water permeability, is not yet clear. It is also important to understand the water permeation phenomena in concrete. With numerical simulation, the water permeability can be accurately calculated based on the simulated pore structure, if their relationship is established. Furthermore, as mentioned earlier, it is difficult to perform the water permeability test appropriately. However, once the relationship between the pore structure and water permeability is understood, the water permeability can be estimated by pore-structure analysis, and the result can be used for validating the appropriateness of the test, by comparison.
In this research, by reviewing literature that studied both water permeability and the pore structure of cementitious material, the pore-structure indicator that exhibits the best correlation with water permeability was studied. In addition, the applicability of the Katz-Thompson model [19, 20] to the water permeability of cementitious material was studied because the applicability of this model to cementitious material is still being debated [11, 13, 15, 21].
2. Literature Reviewing
Li et al. [6], and Reinhardt and Gaber [12] reported only the derivative curves, and pore-structure indicators, other than the critical pore diameter, could not be calculated; therefore, their data was not used. On the other hand, Tatekawa et al. [24] reported the pore-size distribution as the derivative curves, but in their case, the intrusion steps were clear and the data could be converted into cumulative curves for obtaining the pore-structure indicators. The data reported by Goto and Roy [28] could also be converted into cumulative curves, but the obtained maximum cumulative pore volume did not agree with the reported total pore volume and the partial pore volume could not be obtained; therefore, their data was not used in this paper. Research that measured the water permeability of a specimen with intentional damage [29] was not included because the effect of the damage on the water permeability may be predominant rather than the pore structure, and this is not within the scope of this paper. Some studies used SEM [30] and X-ray CT [7] to measure the pore-size distributions, and compared them with the water permeability; however, the scale of the pore size obtained by MIP is different and comparison becomes difficult; therefore, such data were not used in this study.
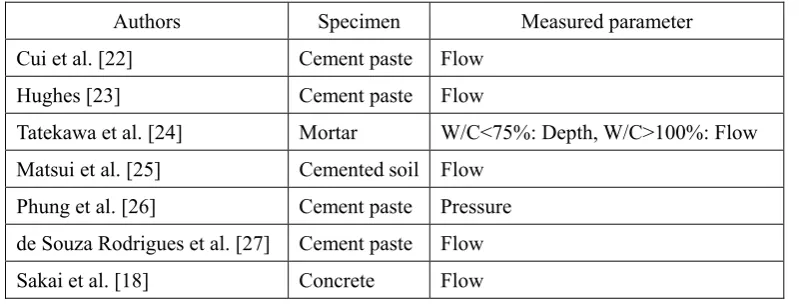
In Table 1, the parameters measured in the water permeability test are also shown. “Flow” indicates the amount of penetrated water from one side and was measured by applying pressure on the other side. “Pressure” indicates the pressure change, and was monitored, while by applying constant flow. “Depth” indicates the penetrated depth, and was measured, when water was forced into dry specimens. In this paper, the reported values are used as such. Sakai et al. [18] have not published the obtained pore size distribution, but it is as indicated in Figure 1.
Table 1 List of literature used in this study
Authors Specimen Measured parameter
Cui et al. [22] Cement paste Flow
Hughes [23] Cement paste Flow
Tatekawa et al. [24] Mortar W/C<75%: Depth, W/C>100%: Flow Matsui et al. [25] Cemented soil Flow
Phung et al. [26] Cement paste Pressure de Souza Rodrigues et al. [27] Cement paste Flow
Pore diameter (nm) Cu m ulativ e v olu m e o f in truded m ercu ry (m l/g) ■ ▲ ◆ × (a)
Pore diameter (nm)
Cu m ulativ e v olu m e o f in truded m ercu ry (m l/g) (b) N40-1 N55-1 N70-3 N70-1 ■ ▲ ◆× FB40-1 FB55-1 FC55-1 FB70-3
Pore diameter (nm)
Cu m ulativ e v olu m e o f in truded m ercu ry (m l/g) (c) ■ ▲ ◆× BB40-1 BB70-3 M55-2 H55-2
Fig. 1 Cumulative pore-size distribution measured by Sakai et al. [18]
3. Methodology
The water-permeability coefficient and pore-structure indicators from the reviewed literature were read using the GSYS software (Japan Charged-Particle Nuclear Reaction Data Group, Japan), and their relationships were examined. As indicators, the total-pore volume, and the critical, threshold, and median pore diameters were considered. The total pore volume and median pore diameter were defined as the maximum cumulative intruded mercury volume, and the corresponding pore diameter, when half the total pore volume was intruded by mercury, respectively. The critical pore volume was defined as the corresponding pore diameter, when the derivative of the pore-size distribution reached a maximum. The definition of the threshold pore diameter has not yet been established [31]; however, in this research, it was defined as the intersection point between the tangential line of the mutational point of the curve slope and the pore-diameter abscissa [11]. Furthermore, we examined the threshold pore diameter defined by Sakai et al. [22] based on the percolation theory, assuming that a connected path was formed, when the volume of intruded mercury reached 16% of the cement paste volume [33, 34], wherein the corresponding pore size was the threshold pore diameter. Katz and Thompson [19, 20] and Thompson et al. [35] proposed the following equations for calculating the permeability coefficient of a porous rock sample using the critical pore diameter, based on the percolation theory:
𝑘 ∙ ∙ 𝑑 , (1)
∙ 𝜑 ∙ 𝑆 𝑑 , (2)
where σ is the conductivity of rock saturated with brine solution having a conductivity σ0, dc is the critical pore diameter, dmaxe is the electrical conductivity characteristic dimension that produces the maximum conductance (dmaxe = 0.34 × dc for a very broad pore-size distribution), and S(dmaxe) is the fractional volume of the connected pore space involving pores > dmaxe. The permeability calculated using Eq. 1 was compared with the reported water permeability.
In some reports, darcy, m/s, or cm/s was used as the unit of water permeability, and these were converted to m2, in this paper. m/s was converted to m2 by multiplying by the water viscosity (0.001 Pa·s) and dividing by the water weight per unit volume (9800 N/m3). Some reports used cc/g or ml/g for the pore volume, and these were converted into the pore volume per unit volume by multiplying with the bulk density, which was calculated using the following equations:
𝜑 𝜑 ∙ 𝜌 , (3)
𝜌 , (4)
where ρa is the bulk density, ρt is the true density, and φm is the total pore volume per unit mass. ρt was assumed to be 2.7 g/cm3 and 2.5 g/cm3 for cement paste and mortar, respectively.
amount of cement and water per sand volume of 1 m3. In this case, the weight of the cement paste was calculated by adding the weight of cement and water, and the volume of the cement paste was calculated, assuming a bulk density of 2 g/cm3, for calculating the volume fraction of cement paste in cemented soil.
For comparing the correlations, the determination coefficients were calculated assuming an exponential approximation because all the indicators showed the highest correlation, when an exponential approximation was assumed. In the reviewed literature, the total pore volume was measured by performing MIP or measuring the saturated and oven-dried weights; however, as the latter was employed only in few studies, in this paper, the former was used for comparison.
4. Results
Figures 2–6 depict the comparison between the water permeability and pore-structure indicators. The broken lines in the figures are the regression lines, assuming an exponential approximation. Figure 2 shows the relationship between the total pore volume and water permeability; the determination coefficient was very low at 0.12. Here, data, other than the cement paste, include the effect of sand; hence, the comparison is not fair. However, omitting these data increased the determination coefficient only to 0.16. Therefore, the total pore diameter has low correlation with the water permeability.
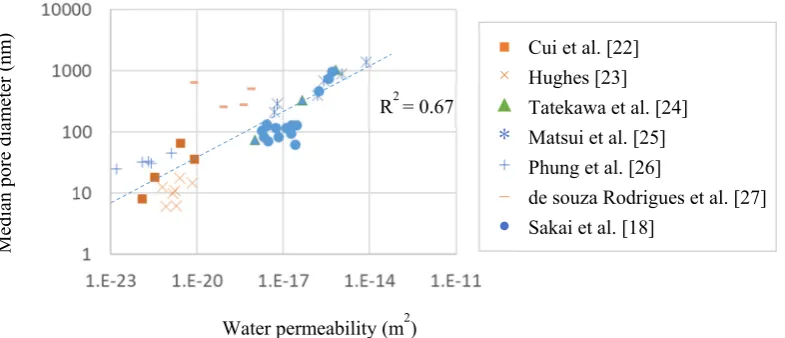
Figures 3–5 compare the water permeability and the critical, median, and threshold pore diameters, respectively. Among them, the critical pore diameter showed the highest determination coefficient at 0.73, whereas those of the median and threshold pore diameters were lower at 0.67 and 0.63, respectively. As mentioned earlier, many researchers have the used critical pore diameter, when discussing the relationship between the pore structure and water permeability, and this was proved to be appropriate. Figure 6 shows the relationship between the water permeability and threshold pore
Water permeability (m2)
To
tal po
re vo
lu
m
e (
m
l/
ml)
■ ×
▲
*
+
‒
●
Cui et al. [22] Hughes [23] Tatekawa et al. [24] Matsui et al. [25] Phung et al. [26]
de souza Rodrigues et al. [27] Sakai et al. [18]
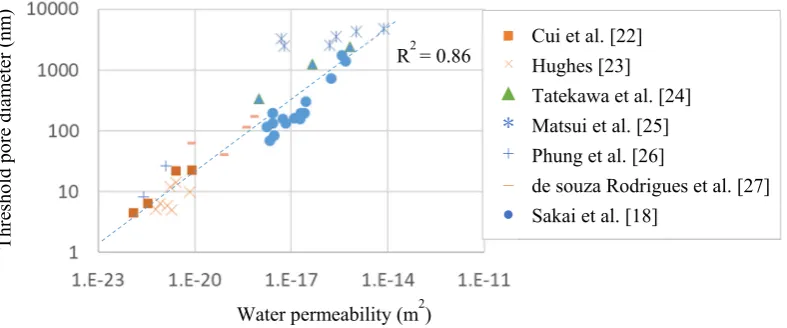
diameter, obtained by a method based on the percolation theory; the determination coefficient was very high at 0.86, indicating that there is strong correlation between them.
Water permeability (m2)
Critical pore
di
am
eter (nm
)
Fig. 3 Relationship between water permeability and the critical pore diameter R2 = 0.73
Cui et al. [22] Hughes [23] Tatekawa et al. [24] Matsui et al. [25] Phung et al. [26]
de souza Rodrigues et al. [27] Sakai et al. [18]
■ ×
▲
*
+
‒
●
Water permeability (m2)
Median pore di
am
eter (nm
)
Fig. 4 Relationship between water permeability and the median pore diameter
■ ×
▲
*
+
‒
●
Cui et al. [22] Hughes [23] Tatekawa et al. [24] Matsui et al. [25] Phung et al. [26]
de souza Rodrigues et al. [27] Sakai et al. [18]
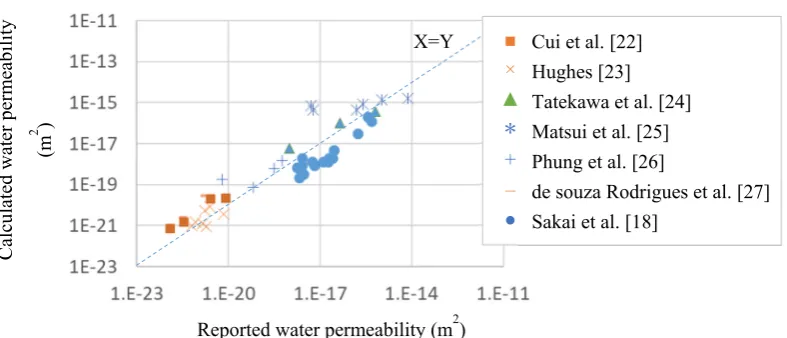
Figure 7 depicts the comparison between the water permeability calculated using the Katz-Thompson equation and the measured results. Although the equation overestimates, the values agree quantitatively to a certain degree, even when no adjustment factor is included. El-Dieb and Hooton [13] also reported that the calculation overestimates. Therefore, if some variation is permitted, the Katz-Thompson model can estimate the water permeability quantitatively without an adjustment factor.
Water permeability (m2)
Thre
sh
old
p
ore
diam
eter (nm
)
Fig. 5 Relationship between water permeability and the ordinary threshold pore
■ ×
▲
*
+
‒
●
Cui et al. [22] Hughes [23] Tatekawa et al. [24] Matsui et al. [25] Phung et al. [26]
de souza Rodrigues et al. [27] Sakai et al. [18]
R2 = 0.63
Water permeability (m2)
Thre
sh
old
p
ore
diam
eter (nm
)
Fig. 6 Relationship between water permeability and the threshold pore diameter obtained based on the percolation theory
■ ×
▲
*
+
‒
●
Cui et al. [22] Hughes [23] Tatekawa et al. [24] Matsui et al. [25] Phung et al. [26]
de souza Rodrigues et al. [27] Sakai et al. [18]
On the other hand, Figure 8 shows the relationship between the measured and calculated water permeability, using the following regression equation. This regression equation was obtained from Figure 6 and is used for calculating the water permeability, using the threshold pore diameter derived based on the percolation theory.
k 2 𝑑 . , (5)
where dthp is the threshold pore diameter derived based on the percolation theory.
Figure 8 shows that using Eq. 5, we can evaluate the water permeability of various cementitious material, such as cement paste, mortar, concrete, and cemented soil, more accurately than the
Katz-Reported water permeability (m2)
Calcu
lated
wat
er p
erm
eab
ility
(m
2 )
Fig. 7 Relationship between the reported and calculated water permeability using Eqs. 1 and 2
X=Y ■
×
▲
*
+
‒
●
Cui et al. [22] Hughes [23] Tatekawa et al. [24] Matsui et al. [25] Phung et al. [26]
de souza Rodrigues et al. [27] Sakai et al. [18]
Reported water permeability (m2)
Calcu
lated
wat
er p
erm
eab
ility
(m
2 )
Fig. 8 Relationship between the reported and calculated water permeability using Eq. 5
X=Y ■
×
▲
*
+
‒
●
Cui et al. [22] Hughes [23] Tatekawa et al. [24] Matsui et al. [25] Phung et al. [26]
Thompson equation. Therefore, even though the Katz-Thompson equation can estimate the water permeability with a certain accuracy, Eq. 5 provides higher accuracy, as per Figure 8. Therefore, the results indicate that for calculating the water permeability based on the pore structure, the threshold pore diameter can be derived based on the percolation theory and converted to water permeability using Eq. 5. However, in the method proposed by Sakai et al. [28] for obtaining the threshold pore diameter, when the porosity of the cement paste portion is less than 16%, the threshold pore diameter cannot be obtained. This is because the pore is judged to be discontinuous, according to the general percolation theory [29]. We can use the Katz-Thompson equation, but as per Figure 7, this equation overestimates when the water permeability is small; therefore, this equation is unsuitable for estimating the water permeability in this region. Thus, calculation using the critical diameter can be a possible option and the following is the regression equation:
k 2 𝑑 . , (6)
where dcr is the critical pore diameter.
Another problem in the method proposed by Sakai et al. [28] for obtaining the threshold pore diameter is that although the percolation threshold was assumed to be 16%, it is not clear whether this value is optimum because the threshold can deviate from 16%, depending on the conditions [29]. Bentz et al. [32] performed numerically simulated cement hydration and reported that the percolation threshold was 18%. By optimizing the percolation threshold, the correlation between water permeability and the threshold pore diameter can be improved. In either case, the high correlation indicates that water permeability in cementitious materials is likely to be governed by the threshold pore diameter derived based on the percolation theory.
5. Conclusion
Acknowledgments
This study was supported by JSPS KAKENHI, grant number 18K13809.
References
[1] A.S. El-Dieb, R.D. Hooton, Water-permeability measurement of high performance concrete using a high-pressure triaxial cell, Cem Concr Res. 25(6) (1995) 1199‒1208.
[2] G.W. Scherer, J.J. Valenza, G. Simmons, New methods to measure liquid permeability in porous materials, Cem Concr Res. 37(3) (2007) 386‒397.
[3] K. Maekawa, T. Ishida, T. Kishi, Multi-Scale Modeling of Structural Concrete: Integrated Material and Structural Mechanics, Taylor & Francis 2008.
[4] C. Pignat, P. Navi, K. Scrivener, Simulation of cement paste microstructure hydration, pore space characterization and permeability determination, Mater. Struct. 38(4) (2005) 459‒466. [5] B. Miloud, Permeability and porosity characteristics of steel fiber reinforced concrete, AJCE 6(4) (2005) 317‒330.
[6] K. Li, M. Stroeven, P. Stroeven, L.J. Sluys, Investigation of liquid water and gas permeability of partially saturated cement paste by DEM approach, Cem Concr Res. 83 (2016) 104‒113. [7] M.A.B. Promentilla, S.M. Cortez, R.A.D. Papel, B.M. Tablada, T. Sugiyama, Evaluation of Microstructure and Transport Properties of Deteriorated Cementitious Materials from their X-ray Computed Tomography (CT) Images, Materials (Basel, Switzerland) 9(5) (2016) 388.
[8] Z. Yu, C. Ni, M. Tang, X. Shen, Relationship between water permeability and pore structure of Portland cement paste blended with fly ash, Constr Build Mater. 175 (2018) 458‒466.
[9] T.C. Powers, Structure and Physical Properties of Hardened Portland Cement Paste, J Am Ceram Soc. 41(1) (1958) 1‒6.
[10] B.K. Nyame, J.M. Illston, Relationships between permeability and pore structure of hardened cement paste, Mag Concrete Res. 33(116) (1981) 139‒146.
[11] M.R. Nokken, R.D. Hooton, Using pore parameters to estimate permeability or conductivity of concrete, Mater Struct. 41(1) (2007) 1.
[12] H.W. Reinhardt, K. Gaber, From pore size distribution to an equivalent pore size of cement mortar, Mater Struct. 23(1) (1990) 3.
[13] A.S. El-Dieb, R.D. Hooton, Evaluation of the Katz-Thompson model for estimating the water permeability of cement-based materials from mercury intrusion porosimetry data, Cem Concr Res. 24(3) (1994) 443‒455.
[15] B.J. Christensen, T.O. Mason, H.M. Jennings, Comparison of measured and calculated permeabilities for hardened cement pastes, Cem Concr Res. 26(9) (1996) 1325‒1334.
[16] L. Bágel, V. Živica, Relationship between pore structure and permeability of hardened cement mortars: On the choice of effective pore structure parameter, Cem Concr Res. 27(8) (1997) 1225‒ 1235.
[17] D.M. Roy, Relationships Between Permeability, Porosity, Diffusion and Microstructure of Cement Pastes, Mortar, And Concrete At Different Temperatures, MRS Proceedings 137 (1988) 179.
[18] Y. Sakai, C. Nakamura, T. Kishi, Evaluation of mass transfer resistance of concrete based on representative pore size of permeation resistance, Constr Build Mater. 51 (2014) 40‒46.
[19] A.J. Katz, A.H. Thompson, Quantitative prediction of permeability in porous rock, Phys Rev B 34(11) (1986) 8179‒8181.
[20] A.J. Katz, A.H. Thompson, Prediction of rock electrical conductivity from mercury injection measurements, Journal of Geophysical Research: Solid Earth 92(B1) (1987) 599‒607.
[21] E.J. Garboczi, Permeability, diffusivity, and microstructural parameters: A critical review, Cem Concr Res. 20(4) (1990) 591‒601.
[22] L. Cui, J.H. Cahyadi, Permeability and pore structure of OPC paste, Cem Concr Res. 31(2) (2001) 277-282.
[23] D.C. Hughes, Pore structure and permeability of hardened cement paste, Magazine of Concrete Research 37(133) (1985) 227-233.
[24] T. Tatekawa, K. Ueno, R. Chikamatsu, Water tightness of low-strength anti-washout under water mortar, Annual Conference of Japan Society of Civil Engineers, 2005.
[25] H. Matsui, K. Horikoshi, K. Higaki, H. Ishii, Permeability of Cement-treated Soil used for a Cutoff Wall, Report of Taisei Technology Center (2009) 1-4.
[26] Q.T. Phung, N. Maes, D. Jacques, G. De Schutter, G. Ye, Effects of W/P ratio and limestone filler on permeability of cement pastes, International RILEM Conference on Materials, Systems and Structures in Civil Engineering, 2016.
[27] C. de Souza Rodrigues, K. Ghavami, P. Stroeven, Porosity and water permeability of rice husk ash-blended cement composites reinforced with bamboo pulp, J Mater Sci. 41(21) (2006) 6925‒ 6937.
[28] S. Goto, D.M. Roy, The effect of w/c ratio and curing temperature on the permeability of hardened cement paste, Cem Concr Res. 11(4) (1981) 575‒579.
[30] J. Hu, P. Stroeven, Application of image analysis to assessing critical pore size for permeability prediction of cement paste, Image Analysis & Stereology 22(2) (2011)135‒139.
[31] H. Ma, Mercury intrusion porosimetry in concrete technology: tips in measurement, pore structure parameter acquisition and application, J Porous Mat. 21(2) (2014) 207‒215.
[32] Y. Sakai, C. Nakamura, T. Kishi, Threshold pore radius of concrete obtained with two novel methods, in: D. Bjegović, H. Beushausen, M. Serdar (Eds.) RILEM International workshop on performance-based specification and control of concrete durability, Zagreb, Croatia (2014). [33] H. Scher, R. Zallen, Critical Density in Percolation Processes, J ChemPhys. 53(9) (1970) 3759‒3761.
[34] D.P. Bentz, E.J. Garboczi, Percolation of phases in a three-dimensional cement paste microstructural model, Cem Concr Res. 21(2) (1991) 325‒344.
[35] A.H. Thompson, A.J. Katz, C.E. Krohn, The microgeometry and transport properties of sedimentary rock, Adv Phys. 36(5) (1987) 625‒694.
![Fig. 1 Cumulative pore-size distribution measured by Sakai et al. [18]](https://thumb-us.123doks.com/thumbv2/123dok_us/996366.1599359/4.595.145.425.113.695/fig-cumulative-pore-size-distribution-measured-sakai-et.webp)