Article
An Overall Assessment of JPSS-2 VIIRS Radiometric
Performance Based on Pre-launch Testing
Hassan Oudrari 1,*, Jeff McIntire 1, Xiaoxiong Xiong 2, James Butler 2, Qiang Ji 1,, Thomas Schwarting 1, and Amit Angal1
1 Science Systems and Applications, Inc., Lanham, MD 20706, USA 2 NASA Goddard Space Flight Center, Greenbelt, MD, 20771 USA
* Hassan Oudrari, [email protected]; Tel.: +1-301-867-2094; Fax: +1-301-867-2151.
Abstract: The Visible Infrared Imaging Radiometer Suite (VIIRS) on-board the second Joint Polar Satellite System (JPSS) completed its sensor level testing in February 2018. The JPSS-2 (J2) mission is scheduled to launch in 2022, and will be very similar to its two predecessor missions, the Suomi National Polar-orbiting Partnership (SNPP) mission, launched on 28 October 2011, and JPSS-1 (renamed NOAA-20) launched on 18 November 2017. VIIRS instrument has 22 spectral bands covering the spectrum between 0.4 and 12.6 m: 14 reflective solar bands (RSB), 7 thermal emissive bands (TEB), and one day-night band (DNB). It is a cross-track scanning radiometer capable of providing global measurements through observations at two spatial resolutions, 375 m and 750 m at nadir for the imaging bands and moderate bands, respectively. This paper will provide an overview of J2 VIIRS characterization methodologies and calibration performance during the pre-launch testing phases performed by the National Aeronautics and Space Administration (NASA) VIIRS Characterization Support Team (VCST) to evaluate the at-launch baseline radiometric performance and generate the parameters needed to populate the sensor data record (SDR) Look-Up-Tables (LUTs). Key sensor performance metrics include the signal to noise ratio (SNR), radiance dynamic range, reflective and emissive bands calibration performance, polarization sensitivity, spectral performance, response versus scan-angle (RVS), and scattered light response. A set of performance metrics generated during the pre-launch testing program will be compared to both the SNPP and JPSS-1 VIIRS sensors.
Keywords: JPSS; SNPP; VIIRS; Pre-launch; Radiometry; Performance; Calibration; Spectral.
1. Introduction
The Visible Infrared Imaging Radiometer Suite (VIIRS) instrument onboard the second Joint Polar Satellite System (JPSS-2 or J2) was built by Raytheon Space and Airborne Systems (SAS) (El Segundo, California), and has completed its sensor level testing to assess its radiometric, spectral and spatial performance.
This VIIRS instrument is the third flight unit of its series, and its design is very similar to the previous missions, the Suomi-National Polar-Orbiting Partnership (SNPP) and JPSS-1 which were launched on October 28, 2011 and November 18, 2017, respectively. Both SNPP and JPSS-1 VIIRS have been collecting high quality remote sensing data [1-4], and have contributed not only to the continuity of the climate data record initiated by other spaceborne Earth observing instruments, but have also supported many crucial environmental, economic and scientific applications [5-8]. In addition to J2, the JPSS program is expected to launch two more VIIRS instruments in the next decade, JPSS-3 (J3) and JPSS-4 (J4).
The main objectives of this paper are to describe key J2 VIIRS radiometric and spectral performances of interest to the large scientific community using VIIRS products. All of the calibration and characterization results are based on the data analysis accomplished by the NASA VIIRS Characterization Support Team (VCST), working closely with other teams, including government, academia and sensor vendor teams. Our assessments will provide a concise and clear overview of the J2 VIIRS radiometric and spectral performance based on pre-launch testing, with a very brief description of the methodologies adopted to generate these assessments. Comparison to previous instruments is an area of high interest, shedding light on areas that have major performance differences (i.e. sensor anomalies), as well as presenting the magnitude of the expected impact and adopted mitigation approaches.
J2 VIIRS design and testing program will be presented in Section 2. The summary of VIIRS pre-launch testing and sensor performance will be presented in Section 3 for all the reflective solar bands (RSB) and thermal emissive bands (TEB), focusing on key performance metrics such as the signal-to-noise (SNR), dynamic range, polarization sensitivity, relative spectral response (RSR), and scattered light contamination which will be addressed as stray light and near field response (NFR). A summary and conclusion of J2 VIIRS pre-launch radiometric and spectral performance as well as future performance enhancements will be presented in the last section, Section 4.
2. J2 VIIRS Sensor Design and Testing Program
The VIIRS sensor is a scanning radiometer designed to study Earth surface and atmospheric variables as well as imagery, and provides moderate-resolution, radiometrically accurate images of the globe daily: once in a day-mode for all VIIRS bands and once in night-mode for twelve bands (M7, M8, M10-M16, I4-I5 and DNB).
2.1. Sensor Design and Improvements
M8-M13 and I3-I4, and the longwave infrared (LWIR) having bands M14-M16 and I5. The DNB is located on a separate focal plane based on CCD technology.
The VIIRS operates in a polar, sun-synchronous orbit with a nominal altitude of 828 km at an inclination angle of approximately 98 degrees relative to the equator (1:30 PM local equatorial crossing time, ascending node) [9,10]. The moderate resolution bands (M-bands), and imaging resolution bands (I-bands) have a spatial resolution at nadir of ~750 m and ~375 m respectively, while the ground swath is ~3040 km. Each M-band and I-band has 16 and 32 detectors respectively, aligned parallel to the direction of spacecraft motion to image the Earth with footprints adjacent to each other.
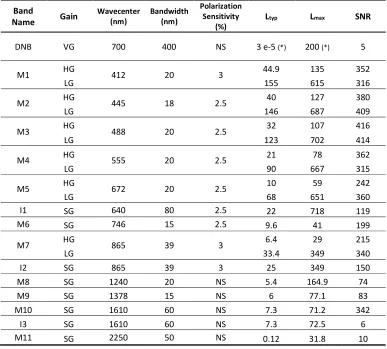
Table 1a. VIIRS RSB bands characteristics and key requirements.
Band
Name Gain Wavecenter (nm) Bandwidth (nm)
Polarization Sensitivity
(%) Ltyp Lmax SNR
DNB VG 700 400 NS 3 e-5 (*) 200 (*) 5
M1 HG 412 20 3 44.9 135 352
LG 155 615 316
M2 HG 445 18 2.5 40 127 380
LG 146 687 409
M3 HG 488 20 2.5 32 107 416
LG 123 702 414
M4 HG 555 20 2.5 21 78 362
LG 90 667 315
M5 HG 672 20 2.5 10 59 242
LG 68 651 360
I1 SG 640 80 2.5 22 718 119
M6 SG 746 15 2.5 9.6 41 199
M7 HG 865 39 3 6.4 29 215
LG 33.4 349 340
I2 SG 865 39 3 25 349 150
M8 SG 1240 20 NS 5.4 164.9 74
M9 SG 1378 15 NS 6 77.1 83
M10 SG 1610 60 NS 7.3 71.2 342
I3 SG 1610 60 NS 7.3 72.5 6
M11 SG 2250 50 NS 0.12 31.8 10
Notes:
*: DNB Ltyp is defined as Lmin and radiance units are in Wm-2sr-1
The units of spectral radiance for Ltyp, Lmax are Wm-2sr-1μm-1
Dual-gain M-bands have two entries, one for high-gain (HG) and one for low-gain (LG)
The SNR at typical radiance (Ltyp) is the minimum (worse-case) required SNR that applies at the end-of-scan
Table 1b. VIIRS TEB bands characteristics and key requirements.
Band
Name Gain Wavecenter (nm) Bandwidth (nm) T
typ (K)
Tmax (K)
NEdT
(K)
I4 SG 3740 380 270 353 2.5 M12 SG 3700 180 270 353 0.396
M13 HG 4050 155 300 343 0.107
LG 380 634 0.423
M14 SG 8550 300 270 336 0.091 M15 SG 10763 1000 300 343 0.07
I5 SG 11450 1900 210 340 1.5 M16 SG 12013 950 300 340 0.072
Notes:
Dual-gain M-bands have two entries, one for high-gain (HG) and one for low-gain (LG) The NEdT (at Ttyp) is the maximum (worse-case) required NEdT that applies at the end-of-scan
SG: Single Gain
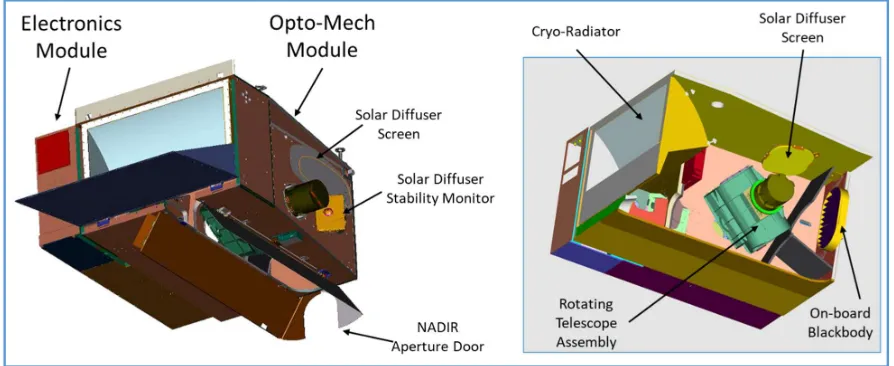
Currently there are three VIIRS flight units with nearly identical designs. SNPP and J1 VIIRS sensors are operating on-orbit, while J2 VIIRS has just completed its sensor level testing. All VIIRS instruments have similar on-board calibrators [10]: a Spectralon® solar diffuser (SD) to calibrate the RSB, a solar diffuser stability monitor (SDSM) to track the SD spectral degradation, a V-groove blackbody (BB) to calibrate the TEB, and a space view (SV) to be used for background subtraction (Figure 1).
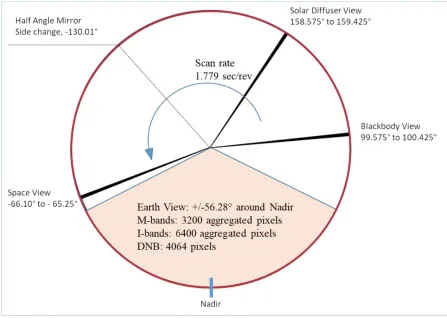
Figure 2 describes the four viewing sectors from a full VIIRS scanning rotation (~1.78 second), starting with the Earth View, then the 3 calibration views when looking at the on-board calibrators: the blackbody, the solar diffuser and the space view. The graph shows also the angle where the HAM changes side since it rotates at half the speed of the telescope, and this angle position is located between the SD and the SV. During on-orbit operations, VIIRS TEB calibration is performed per scan while the RSB calibration is performed once per orbit over the south-pole when the SD is fully illuminated by the Sun. The SV position is the area where the RTA is looking at deep-space to collect dark offset values for each scan.
Figure 2. VIIRS scanning diagram showing the Earth View and scan angles when looking at the on-board calibrators, as well as when the HAM changes side.
2.2.Sensor Testing Program and Improvements
a. Sensor Testing Description:
compliance with performance requirements, and to populate the look-up-tables for on-orbit calibration and operation. Lessons-learned from the testing of the previous two flight units were implemented to enhance efficiency of the testing program, while generating all necessary performance data for each band, detector, gain stage, HAM side, electronic side, and instrument temperature.
All J2 VIIRS baseline testing was completed successfully without any major issue. In the ambient environment, key performance data collected included polarization, response versus scan-angle, relative spectral response (VisNIR bands and DNB), stray light contamination, and near field response, while key performances in Thermal Vacuum (TV) environment cover RSB and TEB calibration, radiometric stability, gain transition, relative spectral response (bands on the two cold focal planes, SMWIR and LWIR). Spatial performance measurements were also assessed in ambient and TV, but these performances will be presented in a separate paper.
Measurements collected during TV testing at three (3) temperature plateaus (instrument temperature), cold, nominal and hot, cover a large range of on-orbit conditions, and will be extensively used in numerous areas, such as the sensor requirements verification, the generation of on-orbit calibration LUTs used by the SDR algorithm, the tuning of various modules that constitute the sensor model, and the investigation of anomalies discovered during the performance testing that were expected to affect instrument performance once on-orbit.
Two decisions were made upfront as soon as there were enough and consistent measurements to ensure better understanding of the sensor radiometry. The first decision was to set electronics side A as the primary electronics, even though both sides revealed quit similar performance. The second decision was to set the cold focal plane operating temperature set point. Special testing was completed to confirm that the cold FPA (CFPA) temperature of 82K will be sufficient to ensure a proper cryo-cooler margin at the end of life. These decisions will define how the instrument will be operated on-orbit, and therefore drove the sensor TV testing procedures and configurations.
b. Sensor Improvements:
While designing an instrument strict engineering processes are followed to ensure high quality performance on-orbit. However, it is very common in the space industry to face unexpected marginal performances or even issues that could hamper the data quality. In the case of VIIRS series, SNPP, J1 and J2, while no severe issues were encountered, multiple areas where modifications were necessary to enhance instrument performance were identified. In some cases, the lower than expected performance was due to component manufacturing issues, but in some other cases the design was modified to achieve the desired quality.
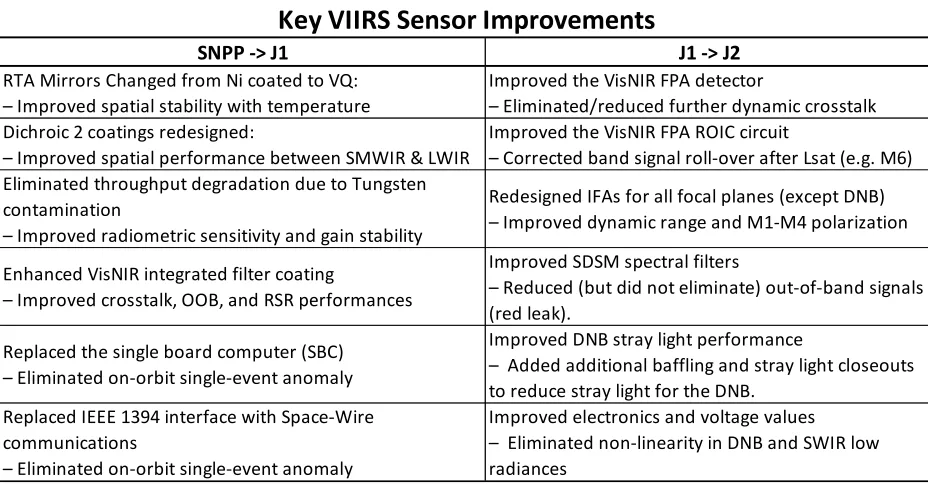
Table 2. Key VIIRS sensor improvements based on lessons learned from previous flight units.
3. J2 VIIRS Pre-Launch Performance
A brief description of J2 performance testing and assessment will be presented in this section as performed by the VCST, focusing on the radiometric and spectral testing. Most of J1 performance assessments will be compared to the sensor requirements and to previous VIIRS sensors, SNPP and/or J1. A short overview of the data analysis methodologies will be presented for key performance metrics, which are very similar among all three sensors.
Because of the huge amount of test data collected during J2 VIIRS testing, we have limited our analysis by focusing on a few key performance metrics, including the radiometric calibration (RSB and TEB), dynamic range, SNR, noise equivalent temperature difference (NEdT), polarization sensitivity, RSR, RVS, NFR and scattered light. Most of the calibration performances derived from TV testing are from nominal temperature plateau, which is the closest to the expected on-orbit conditions.
3.1 RSB Radiometric Calibration
The reflective solar bands calibration was performed at three instrument temperatures, and for each gain stage, detector, HAM side, and electronic side. Two reference light sources were used in this testing, the 100-cm diameter spherical integrating source (SIS100) and the three mirror collimator (TMC) SIS (very bright source), to calibrate all RSB. Only the SIS100 is traceable to the National Institute of Standards and Technology (NIST) and has a radiance monitor to correct for signal fluctuations and drifts. SIS100 measurements are used to cross-calibrate the TMC SIS over the radiance region of overlap between the two sources. The TMC SIS is used only for M1-M3 low gain (LG) as the SIS100 is not bright enough to cover the full dynamic range of these bands. In addition, the space view source (SVS)
SNPP -> J1 J1 -> J2
RTA Mirrors Changed from Ni coated to VQ: – Improved spatial stability with temperature
Improved the VisNIR FPA detector
– Eliminated/reduced further dynamic crosstalk Dichroic 2 coatings redesigned:
– Improved spatial performance between SMWIR & LWIR
Improved the VisNIR FPA ROIC circuit
– Corrected band signal roll-over after Lsat (e.g. M6) Eliminated throughput degradation due to Tungsten
contamination
– Improved radiometric sensitivity and gain stability
Redesigned IFAs for all focal planes (except DNB) – Improved dynamic range and M1-M4 polarization
Enhanced VisNIR integrated filter coating
– Improved crosstalk, OOB, and RSR performances
Improved SDSM spectral filters
– Reduced (but did not eliminate) out-of-band signals (red leak).
Replaced the single board computer (SBC) – Eliminated on-orbit single-event anomaly
Improved DNB stray light performance
– Added additional baffling and stray light closeouts to reduce stray light for the DNB.
Replaced IEEE 1394 interface with Space-Wire communications
– Eliminated on-orbit single-event anomaly
Improved electronics and voltage values – Eliminated non-linearity in DNB and SWIR low radiances
was used to collect the dark offset needed to generate the background corrected detector response or digital number (dn) as:
L = c0+ c1·dn + c2·dn2 (1)
where c0, c1, and c2 are the calibration coefficients.
Instead of fitting to Eq. (1) directly, the attenuator approach previously described in [9] was used to mitigate the impact of the source instability on VIIRS calibration accuracy. The radiance measurements were performed with and without an attenuator screen inserted into the optical path. The attenuator screen is an opaque plate with small holes to allow a fraction of light through (transmittance of ~56%). The time between attenuator in and out is very short to minimize the effect of source instability on the measurements.
Consequently, the ratio of the detected spectral radiances with and without the attenuator is equal to the attenuator transmittance (τ), as:
21 2 1 0 2 1 2 1 0 / / / / out out in in dn c c dn c c dn c c dn c c
, (2)where dnin and dnout denote the dn with and without the attenuator, respectively. A 3-sigma outlier rejection criteria is used during the calculation.
To facilitate the data regression, Eq. (2) is rewritten as:
ℎ (𝜏 − 1) + (𝜏 𝑑𝑛 − 𝑑𝑛 ) + ℎ (𝜏 𝑑𝑛 − 𝑑𝑛 ) = 0 (3)
where ℎ = 𝑐 𝑐⁄ , and ℎ = 𝑐 𝑐⁄
The model parameters , ℎ , and ℎ are determined through a non-linear least-square process, and the linear coefficient or gain is determined by inverting Eq. (1) and averaging over the selected source levels:
2 2 0
1
out out h dn
dn h L c
(4)
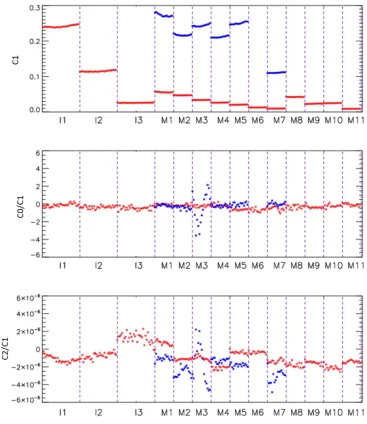
Figure 3 shows the detector based calibration coefficients, c1, c0/c1, and c2/c1, at Nominal temperature plateau. Similar to J1 and SNPP VIIRS RSB calibration, the c0/c1 coefficient is very small and is on the order of 10-1, except for M3 band where it varies between 2 and -4. This M3 behavior is associated with the uncertainties from TMC calibration. The c2/c1 coefficients are also very small for all bands and gain stages, reflecting excellent linearity of the VIIRS radiometric response, in general on the order of 10-6. Few bands, M2, M3 and M7 are showing slightly large detector-to-detector c2/c1 variability, but this is expected to have small effect on the calibration performance.
Figure 3. J2 VIIRS RSB calibration coefficients derived for each band and detector (32 detectors for I-bands, and 16 detectors for M-bands) at Nominal temperature plateau. Red and blue color represent
a. SNR Calculation and Performance
The detector SNR was calculated for each SIS100 radiance level by dividing the sample averaged dn over scans by the standard deviation as:
𝑆𝑁𝑅 = ∑ ∑ . (5)
where M, N are the total number of samples and scans respectively. This approach was more accurate than the one based on scan averaging because of the large SIS-100 spatial non-uniformity in the scan direction.
To facilitate the computation of the SNR at any radiance level and to smooth out the variability in the SNR over radiance levels, the SNR is fit to the following mathematical form:
2 2 1 0 kL k L k
L SNR
, (6)
where ki are the fitting coefficients. This equation is used to derive the SNR at any radiance and verify requirement compliance at Ltyp.
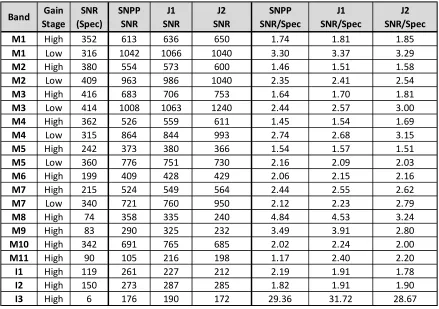
Table 3. J2 VIIRS SNR (at Ltyp) for RSB, and comparison to sensor specification, SNPP and J1. The ratio between measured performance and specification (Spec) is also shown.
b. Dynamic Range
J2 VIIRS radiometric dynamic range was verified to ensure compliance with sensor requirements. These results are shown in Table 4, as well as a comparison to J1 and SNPP performance. It is clear that all bands have achieved compliance with good margins. Band M8 was not compliant for both previous instruments, but is now compliant for J2 with a very small margin (~1%). The highest margin is shown for M5, at about 40%. It is worth noting that since SNPP suffered from the RTA mirror coating degradation on-orbit [12], therefore decreasing the radiometric sensitivity for some bands from their pre-launch measurements. SNPP bands in the near infrared and short-wave infrared saw a large increase in their dynamic range during the first year after SNPP launch. This variation in the sensor sensitivity allowed SNPP M8 and I3 dynamic range to become compliant shortly after launch. The mirror coating degradation issue was eliminated for both J1 and J2 VIIRS sensors; hence, the dynamic range was quite stable since J1 mission launch, and it is expected to be very stable for J2 VIIRS as well. For the dual gain bands, the high gain Lsat shown in Table 4 represents the radiance transition (Ltrans) from high gain to low gain. The requirement for Ltrans is to be within +50% above high gain Lmax for bands M1-M5 and
Band Gain Stage SNR (Spec) SNPP SNR J1 SNR J2 SNR SNPP SNR/Spec J1 SNR/Spec J2 SNR/Spec
M1 High 352 613 636 650 1.74 1.81 1.85
M1 Low 316 1042 1066 1040 3.30 3.37 3.29
M2 High 380 554 573 600 1.46 1.51 1.58
M2 Low 409 963 986 1040 2.35 2.41 2.54
M3 High 416 683 706 753 1.64 1.70 1.81
M3 Low 414 1008 1063 1240 2.44 2.57 3.00
M4 High 362 526 559 611 1.45 1.54 1.69
M4 Low 315 864 844 993 2.74 2.68 3.15
M5 High 242 373 380 366 1.54 1.57 1.51
M5 Low 360 776 751 730 2.16 2.09 2.03
M6 High 199 409 428 429 2.06 2.15 2.16
M7 High 215 524 549 564 2.44 2.55 2.62
M7 Low 340 721 760 950 2.12 2.23 2.79
M8 High 74 358 335 240 4.84 4.53 3.24
M9 High 83 290 325 232 3.49 3.91 2.80
M10 High 342 691 765 685 2.02 2.24 2.00
M11 High 90 105 216 198 1.17 2.40 2.20
I1 High 119 261 227 212 2.19 1.91 1.78
I2 High 150 273 287 285 1.82 1.91 1.90
M7. As shown in Table 4, all dual gain bands are compliant with this requirement, with margin values between 7% (M3) and 36% (M1).
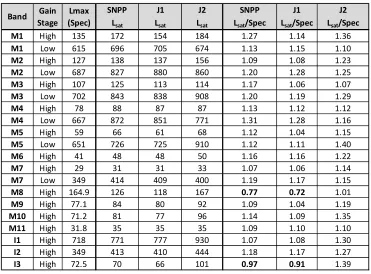
Table 4. J2 VIIRS Lsat values for RSB, and comparison to sensor specification, SNPP and J1. The ratio between measured performance and specification (Spec) is also shown. For dual gain bands, the Lsat of
high gain stage represents the transition radiance (Ltrans), from high to low gain.
d. RSB Calibration Uncertainties
The top level requirement for VIIRS RSB requirements is to limit the absolute radiometric calibration uncertainty to 2% of the reflectance when viewing a uniform scene at Ltyp. This uncertainty analysis was completed based on contributors which have been constrained by sensor-level requirements while others are based on the sensor vendor allocations. A process was developed to combine all uncertainty estimates has shown that the spectral reflectance accuracy (2 %) was met for all RSB except M1 (2.40%)[13], primarily due to the on-orbit calibration uncertainty introduced by the SDSM filter red leak. This M1 non-compliance is expected to vary on-orbit because of the SD’s degradation. However, the monthly lunar calibrations planned post-launch provide a reliable validation therefore mitigating the uncertainties associated with the SDSM. [14]
Band StageGain (Spec)Lmax SNPPL
sat
J1 Lsat
J2 Lsat
SNPP Lsat/Spec
J1 Lsat/Spec
J2 Lsat/Spec
M1 High 135 172 154 184 1.27 1.14 1.36
M1 Low 615 696 705 674 1.13 1.15 1.10
M2 High 127 138 137 156 1.09 1.08 1.23
M2 Low 687 827 880 860 1.20 1.28 1.25
M3 High 107 125 113 114 1.17 1.06 1.07
M3 Low 702 843 838 908 1.20 1.19 1.29
M4 High 78 88 87 87 1.13 1.12 1.12
M4 Low 667 872 851 771 1.31 1.28 1.16
M5 High 59 66 61 68 1.12 1.04 1.15
M5 Low 651 726 725 910 1.12 1.11 1.40
M6 High 41 48 48 50 1.16 1.16 1.22
M7 High 29 31 31 33 1.07 1.06 1.14
M7 Low 349 414 409 400 1.19 1.17 1.15
M8 High 164.9 126 118 167 0.77 0.72 1.01
M9 High 77.1 84 80 92 1.09 1.04 1.19
M10 High 71.2 81 77 96 1.14 1.09 1.35
M11 High 31.8 35 35 35 1.09 1.10 1.10
I1 High 718 771 777 930 1.07 1.08 1.30
I2 High 349 413 410 444 1.18 1.17 1.27
While it is important to describe how the reflective bands are calibrated pre-launch and post-launch to fully understand the VIIRS calibration performance, this paper is solely focused on pre-launch performance, and we will summarize the radiometric uncertainty of J2 VIIRS sensor against three key radiometric specifications: 1) the radiometric response uniformity, 2) the characterization uncertainty, and 3) the radiometric stability.
1) Radiometric Response Uniformity
The radiometric response uniformity (RRU) assesses the ability of the sensor calibration to eliminate detector-to-detector stripping in the Earth scene imagery. The detector RRU requirement is defined as follows:
𝑅𝑅𝑈 =| 〈 〉| <1
where d is the detector in the band, 𝐿 is the detector radiance, and 〈𝐿〉 is the band-averaged radiance. RRU is derived for each source radiance level for all RSB, and is required to be less than unity between Lmin and 0.9Lmax.
RRU derived from J2 TV testing was observed to be generally consistent over the whole dynamic range for most cases. J2 RRU derived at Ltyp was seen to comply with the specification (<1). However, many non-compliances were observed as we go further away from the calibration tie-point (on-orbit SD radiance). While the source non-uniformity could be a major contributor to these RRU non-compliances, it is important to know that both previous VIIRS sensors, SNPP and J1, had comparable RRU limitations, at either ends of the dynamic range. It is also important to indicate that since this requirement is relative to a very small value of NEdL (excellent noise performance), there was a general agreement to set these non-compliances at low risk for the on-orbit data products.
2) Radiometric Characterization Uncertainty
3) Radiance Stability
The VIIRS RSB are calibrated on-orbit using SD views once per orbit, and it is known that the instrument temperature varies over the orbit when the instrument goes through the day and night sides of the Earth. It is therefore important to characterize the system’s response as a function of the temperature, time and voltage, and to verify if the instrument complies with stability requirement of 0.3% over 90 min (one orbit). The stability testing is performed during the transition between the three temperature plateaus (thermal stability), at each plateau (temporal stability), and during sensitivity testing with respect to a typical BUS voltage profile (voltage stability).
For these tests, the SIS-100 is used at a single radiance level, four (4) 200W lamps, and a drift-corrected radiance is used to derive the instrument gain which was monitored throughout the duration of the test. In the case of the VisNIR bands, the response change is correlated with the VisNIR FPA temperature and in the case of Short Wave Infrared (SWIR) bands it is correlated with the Opto-Mechanical Module (OMM) temperature.
The stability analysis results from all temperature plateaus and transitions have shown excellent J2 VIIRS stability performance as a function of temperature, time and voltage (much smaller than 0.3%), and very similar to SNPP and J1 sensors. Typically, the VIIRS temperature varies by only 2 to 3 degrees Kelvin within one orbit and hence the stability criterion is expected to be met with very large margins if the instrument performs as expected on orbit. These measurements will be used to derive the temperature-dependent coefficients needed in the on-orbit operational processing.
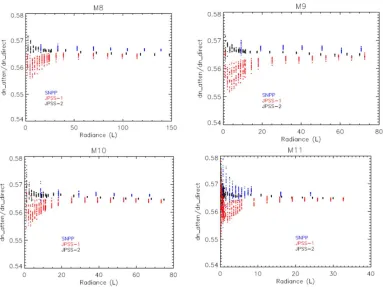
e. SWIR Linearity at low radiance
Figure 4. Comparison of J2, J1 and SNPP SWIR (M8-M11) non-linearity as shown by the ratio of sensor
response value (dn) for attenuator in and out measurements.
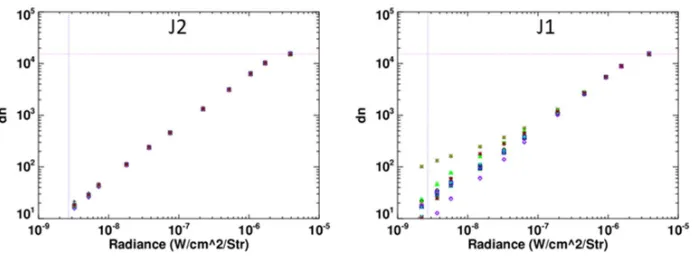
f. DNB Spatial Performance and Linearity Issue
J1 VIIRS data analysis showed a larger than expected non-linear response at low radiances values for the DNB high gain A and B (HGA, HGB) aggregation modes 21 to 32 (edge of scan). The mid-gain stage also showed non-linearity features, but to a much lower extent. This DNB non-linearity issue was caused by two incorrect biases set in the focal plane interface electronics, and were both corrected in the J2 VIIRS sensor.
Figure 5 shows the DNB response (dn) for HGB in aggregation mode 32 (most affected), and also provides a good representation of the non-linearity improvement for J2 compared to J1 DNB. Similar improvement was also observed for all other aggregation modes. SNPP DNB has similar non-linearity performance as J2 DNB, therefore it is not shown in Figure 5.
Figure 5. DNB HGB response (dn) as a function of radiance in aggregation zone 32 from J2 and J1 TV testing. The 16 DNB detectors are represented by different symbols.
3.2 Thermal Emissive Bands (TEB) Calibration
In total, four (4) blackbody sources were used during pre-launch radiometric testing. VIIRS thermal band calibration is referenced to the blackbody calibration source (BCS), a NIST traceable source, with an uncertainty less than 0.06K at 10 μm and 300 K. Since the BCS maximum temperature is 345K and this temperature range was inadequate to calibrate M13 low gain, an additional high temperature blackbody, the three mirror collimator (TMC) blackbody was used outside of the TV chamber, with a maximum temperature of about 763 K. In addition, a cold BB source (controlled at ~90 K) was used to simulate the deep space view (used for background subtraction), and was located inside the thermal vacuum chamber. The fourth blackbody source was the OBC, located in the VIIRS instrument and described in Section 2.
The radiometric testing for the thermal bands can be divided into two parts: performance and stability. For the performance testing, the sources (either internal or external) were cycled through a series of discrete temperature levels; for stability testing, the source temperatures remained fixed while the instrument conditions were varied. The performance tests were used to determine the calibration coefficients relating the detector response to the radiance and to derive a number of performance metrics, such as the NEdT, the absolute radiometric difference (ARD), the radiometric characterization uncertainty and the radiometric response uniformity. The BCS and TMC were cycled through their respective temperature ranges, while the OBC was fixed at 292 K.
The instrument stability was tested as a function of time (at each plateau), temperature (during transitions between plateaus), and with respect to a typical BUS voltage profile (variation over one orbit).
The radiance reaching the detector is the sum of the source radiance and contributors along the optical path (i.e. the RTA, HAM, and aft optics). The path difference radiance between the two sources (BCS and SV) is calculated as:
RTA RTA HAM RTA SV BCS BCS BCS BCSBCS L L
RVS RVS L RVS L
1 . (7)
The reflectance factors represent the total reflectance of the RTA mirrors. The RVS is the scan-angle dependent relative reflectance of the HAM. The temperature of each source is determined from one or more thermistors, and the radiances of the sources are determined via Planck’s law convolved over the actual VIIRS RSR of each spectral band over the extended band-pass.
The path difference radiance is modeled as a quadratic polynomial in the offset corrected digital response, or
2 2 1
0 cdn c dn
c
L
. (8)
The retrieved EV radiance for the BCS is determined by inverting Eq. (7), or
RTA RTA HAM RTA BCS SV BCS BCS BCS BCS retBCS L L
RVS RVS RVS RVS dn c dn c c L
1 2 2 10 . (9)
The TEB radiometric calibration coefficients were determined for all detectors, HAM sides, electronics sides and temperature plateaus [16]. This analysis has shown TEB performing as expected, with radiometric fitting dominated by the linear term (gain), while both offset and non-linear term are very small, on the order of 10-1 and less than 10-7 respectively.
a. NEdT performance
The radiometric sensitivity was determined by fitting the SNR to the path difference source radiance, and is computed via the equation below:
T L SNR L T L NEdL NEdT BCS
(10)
specification with good margins. Similar performance was observed for all detectors within a band, while data from three temperature plateaus has shown a small dependence of NEdT to sensor temperature. Overall, J2 TEB performance is in general comparable to J1 and SNPP. The smallest and greatest NEdT margins were observed for M14 (84%) and I4 (676%) respectively. Detector noise variability is very small for all bands, unlike the other previous instruments where a few out-of-family detectors were observed, such as M12 detector 1 for SNPP; and M15 detector 4 and M16B detector 5 for J1.
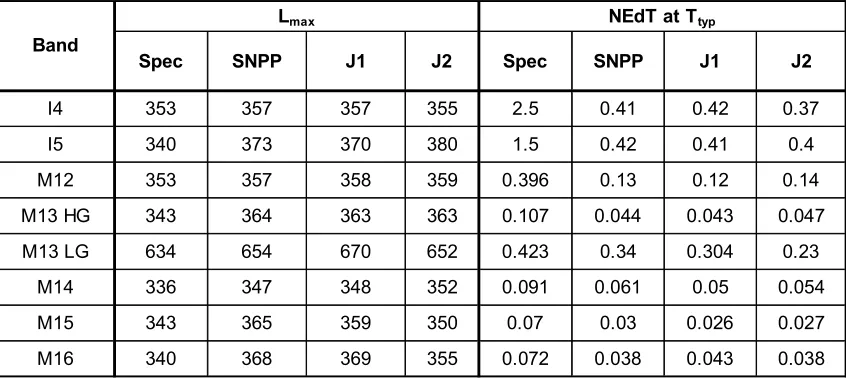
b. Dynamic Range
Table 5 shows the J2 maximum temperature derived at nominal plateau and comparison to the specification and previous VIIRS sensors, J1 and SNPP. All bands have saturation values above the specified Lmax, and comparable to J1 and SNPP. For J2 and J1, digital saturation occurred first for all bands, while for SNPP two bands, M12 and I4, exhibit analog saturation before digital saturation. While M13 low gain saturation was not observed in TV testing (due to source limitations), the data from ambient testing has shown saturation for this band to be about 652 K, 670 K and 654 K, for J2, J1 and SNPP VIIRS respectively. On-orbit M13 LG is expected to saturate within a couple of degrees of the ambient-derived saturation values. The overall analysis of thermal data collected in TV are showing J2 TEB saturation values are consistent over electronics sides and temperature plateaus, and the variation range is limited to within 3 K.
Table 5. J2 VIIRS Lmax and NEdT performance for TEB derived in TV at nominal plateau, and comparison to J1 and SNPP as well as the specification. The temperature saturation for M13 LG was derived from ambient testing.
Spec SNPP J1 J2 Spec SNPP J1 J2
I4 353 357 357 355 2.5 0.41 0.42 0.37
I5 340 373 370 380 1.5 0.42 0.41 0.4
M12 353 357 358 359 0.396 0.13 0.12 0.14
M13 HG 343 364 363 363 0.107 0.044 0.043 0.047
M13 LG 634 654 670 652 0.423 0.34 0.304 0.23
M14 336 347 348 352 0.091 0.061 0.05 0.054
M15 343 365 359 350 0.07 0.03 0.026 0.027
M16 340 368 369 355 0.072 0.038 0.043 0.038
Band
c. Radiometric Response Uniformity (striping)
Similar to RSB, the RRU represents the detector-to-detector uniformity (or striping) and is quantified by the following equation:
𝑅𝑅𝑈 =| 〈 〉| (11)
where the average EV retrieved radiance, 〈𝐿 〉, is over all detectors in a band and NEdL is derived from Eq. (10). The sensor specification is met if the RRU is less than unity within the radiance range from Lmin to 0.9Lmax.
Figure 6 shows the detector-to-detector striping performance represented by the RRU metric as a function of scene temperature for all emissive bands. We can easily see that the risk of striping increases with temperature for all TEB bands, because the deviation of the detector retrieved radiance from the band average increases with temperature while the NEdL levels off. Results derived per HAM side, electronics side and temperature plateau have shown some performance variations, with RRU for some bands reaching up to 1.5 at highest temperatures (larger than 320 K). We should also emphasize the difficulty to meet this requirement for both J1 and SNPP since VIIRS TEB have a very good noise performance (stringent requirement).
Figure 6. J2 maximum RRU (right panel) as a function of source (BCS) temperature and comparison to J1 (left panel), shown for all TEB, HAM 0, and nominal plateau (RRU is compliant if less than unity).
d. Absolute Radiometric Difference (Uncertainty)
BCS BCS ret BCS L L L
ARD100
(12)
The band averaged ARD for J2 TEB derived at nominal plateau are shown in Table 6. As expected, the ARD results show excellent performance for all TEB, meeting specification with quite good margins under all conditions. Table 6 also shows the temperature errors associated with the ARD values. These temperature errors represent a good reference for science community providing products based on the temperature measurement generated through VIIRS calibration algorithm. Overall, J2 ARD and temperature error estimates are showing full compliance, and in general TEB performance is similar to or better than J1 and SNPP.
Table 6. J2 Band averaged ARD (%) at specified temperature as well as temperature error for all TEB at nominal plateau and for HAM side A. Comparison to J1 is also shown.
Temp (K) I4 I5 M12 M13 M14 M15 M16A M16B
J2 ~ ~ ~ ~ 1.48 0.18 0.15 0.15
J1 ~ ~ ~ ~ 0.68 0.29 0.17 0.25
J2 ~ ~ 0.34 1.50 0.15 0.05 0.00 0.01
J1 ~ ~ 7.60 2.95 0.11 0.07 0.08 0.04
J2 0.45 0.02 ~ ~ ~ ~ ~ ~
J1 0.48 0.10 ~ ~ ~ ~ ~ ~
J2 ~ ~ 0.21 0.31 0.10 0.08 0.02 0.03
J1 ~ ~ 0.24 0.15 0.08 0.05 0.04 0.04
J2 ~ ~ 0.31 0.35 0.16 0.09 0.05 0.05
J1 ~ ~ 0.25 0.17 0.11 0.06 0.03 0.04
J2 ~ ~ 0.30 0.39 0.17 0.08 0.02 0.04
J1 ~ ~ 0.27 0.18 0.09 0.05 0.03 0.03
Temp (K) VIIRS I4 I5 M12 M13 M14 M15 M16A M16B
J2 ~ ~ ~ ~ 0.508 0.293 0.241 0.235
J1 ~ ~ ~ ~ 0.200 0.080 0.070 0.100
J2 ~ ~ 1.101 0.926 0.198 0.137 0.144 0.126
J1 ~ ~ 1.010 0.710 0.040 0.020 0.030 0.020
J2 0.348 0.311 ~ ~ ~ ~ ~ ~
J1 0.130 0.050 ~ ~ ~ ~ ~ ~
J2 ~ ~ 0.129 0.514 0.12 0.102 0.145 0.113
J1 ~ ~ 0.050 0.040 0.040 0.030 0.040 0.030
J2 ~ ~ 0.085 0.642 0.112 0.103 0.17 0.125
J1 ~ ~ 0.060 0.050 0.070 0.040 0.030 0.040
J2 ~ ~ 0.097 0.77 0.122 0.113 0.197 0.142
J1 ~ ~ 0.080 0.080 0.080 0.040 0.040 0.040
267 270 310 340 230 190 340
ARD Performance (%)
Temperature Error (K)
190
230
267
270
3.3 Other Performance Characterization
J2 VIIRS testing program included intensive testing in ambient and TV to characterize the instrument and provide valuable inputs needed to build and validate a sensor model which make it possible to understand and simulate VIIRS sensor performance under various conditions and to support the investigation of anomalies and issues. Some of these key metrics that are important include the sensor polarization sensitivity, relative spectral response, response versus scan-angle, near field response and stray light contamination.
a. Polarization Sensitivity
J2 VIIRS polarization sensitivity was characterized in ambient using an integrating sphere combined with a sheet polarizer at eleven different scan angles in the 400 to 900 nm range covering all VisNIR bands (M1-M7, I1-I2) [17]. The sheet polarizer was mounted on a rotary stage and was rotated in 15 degree increments from 0 to 360 degrees. Additionally, a long wavelength spectral blocking filter was placed in the optical path during the M1-M3 testing to eliminate near infrared out-of-band (OOB) contributions. Using a Fourier series, the polarization sensitivity was derived for all VisNIR bands, detectors, HAM sides, and eleven scan angles (-55, -45, ,-37, -30, -20, -15, -8, 4, 22, 45, 55). Only the zeroth and second order terms derived from the Fourier transform have non-negligible values, which is an indication of the high quality polarization measurements.
Figure 7: VIIRS polarization factor (HAM A) per band and detector, across scan angles (symbols), for J2 (bottom), J1 (middle) and SNPP (top). The horizontal red lines represent the polarization requirements.
b. Relative Spectral Response (RSR)
Figure 9. Full M1 RSR (in-band and OOB) comparison between J2, J1 and SNPP.
Table 7. J2 Spectral performance summary based on RSR Version 1 data set. Bold, shaded and underlined cells represent J2, J1 and SNPP performance non-compliances respectively.
c. Response Versus Scan-angle (RVS)
The RVS testing was performed during the summer of 2016 under ambient conditions using the SIS 100 for the RSB, and the laboratory ambient blackbody (LABB) and the OBC for the TEB. J2 VIIRS RVS testing was very similar to the previous sensor build, and only a brief description is included here. VIIRS was placed on a rotating table with the scan plane perpendicular to gravity. This allowed the instrument
Center Tolerance Bandwidth Tolerance Lower Limit Upper Limit Lower Limit Upper Limit
I1 641.3 640 6 79.4 80 6 592.7 689.7 565 715 0.05 0.5
I2 868.0 865 8 38.8 39 5 835.4 898.5 802 928 0.19 0.7
I3 1613.5 1610 14 61.6 60 9 1550.3 1687.3 1509 1709 0.39 0.7
I4 3760.0 3740 40 383.9 380 30 3490.3 4040.2 3340 4140 0.17 0.5
I5 11495.8 11450 125 1727.1 1900 100 10475.5 12701.1 9900 12900 0.14 0.4
M1 411.6 412 2 19.2 20 2 397.1 424.8 376 444 0.15 1.0
M2 445.1 445 3 17.0 18 2 434.2 457.1 417 473 0.20 1.0
M3 488.5 488 4 19.9 20 3 475.9 501.7 455 521 0.17 0.7
M4 555.6 555 4 21.3 20 3 542.0 569.1 523 589 0.18 0.7
M5 671.6 672 5 20.9 20 3 651.5 694.0 638 706 0.34 0.7
M6 747.6 746 2 14.8 15 2 736.7 758.7 721 771 0.24 0.8
M7 868.5 865 8 38.5 39 5 836.3 898.5 801 929 0.19 0.7
M8 1242.0 1240 5 20.3 20 4 1226.2 1257.2 1205 1275 0.20 0.8
M9 1382.8 1378 4 15.2 15 3 1370.0 1398.5 1351 1405 0.37 1.0
M10 1613.9 1610 14 62.6 60 9 1549.7 1688.5 1509 1709 0.37 0.7
M11 2251.7 2250 13 47.9 50 6 2206.5 2294.7 2167 2333 0.27 1.0
M12 3689.2 3700 32 193.3 180 20 3529.2 3874.7 3410 3990 0.32 1.1
M13 4019.2 4050 34 154.9 155 20 3866.5 4173.8 3790 4310 0.35 1.3
M14 8576.1 8550 70 348.8 300 40 8233.2 8924.9 8050 9050 0.36 0.9
M15 10674.1 10763 113 938.5 1000 100 10033.5 11347.6 9700 11740 0.19 0.4
M16A 11939.2 12013 88 922.7 950 50 11298.6 12651.1 11060 13050 0.25 0.4
M16B 11945.6 12013 88 929.9 950 50 11298.7 12657.8 11060 13050 0.24 0.4
M16 11942.3 12013 88 924.8 950 50 11298.6 12656.5 11060 13050 0.24 0.4
DNBMGS 694.2 700 14 383.3 400 20 482.3 908.4 470 960 0.14 0.1
DNBLGS 702.0 700 14 374.5 400 20 488.0 904.7 470 960 0.04 0.1
to view external sources by rotating the instrument while keeping the illumination level constant. Data taken at twelve angles-of-incidence (AOI) were used to fit the RVS function, which is a quadratic polynomial in AOI, after correcting for source drift and background radiances [21,22].
Figure 10 shows J2 band-average RVS functions for HAM side A and comparison to J1. The variation in the RSB RVS for M1-M11 and I1-I3 is generally small (left and middle plots) and similar to SNPP and J1, varying by less than 1.5 % (M1 has the largest variation) over the full operational AOI range of 28.6° to 60.2°. All RSB had maximum uncertainties lower than 0.05% which was determined here as the average fitting residuals [22], much lower than the RVS uncertainty target of 0.3%. Our analysis has shown that J2 VIIRS RVS differences between HAM sides are very small for all bands. This is an improvement upon J1 VIIRS RVS where four bands (M1, M2, M7 and I2) have shown large RVS differences between HAM sides.
The J2 band averaged RVS for the MWIR bands (M12-M13 and I4) and the LWIR bands (M14-M16 and I5) are plotted in the middle and right panels of Figure 10 respectively. The MWIR RVS is generally small varying by less than 0.5 % over the full AOI range, comparable to SNPP and J1. In contrast, the LWIR RVS changes by up to 10 %, 6%, and 3% for M14, M15 and M16 respectively, over the range of AOI. All of these J2 RVS results are consistent with both J1 and SNPP. The TEB RVS maximum uncertainty was propagated through a least squares fitting routine, which provides estimates of the uncertainty on the fitting coefficients as well as covariances. This uncertainty was lower than 0.2 % (target value), except in few angles for two bands, I4 and I5, where the maximum uncertainty reached 0.26% and 0.23% respectively. Overall, J2 RVS performance is comparable to both J1 and SNPP performance.
e. Near-Field Response (NFR)
Figure 11. Measured NFR for band M5 (672 nm) detector 8 as a function of scan angle, using J2 data (blue line), J1 data (red line), and SNPP data (black line)
Table 8. The summary of J2 band average NFR performance and comparison to J1 and SNPP. A ratio Lscat/Lspec of less than unity indicates compliance with scatter requirements.
f. Stray Light Response (SLR)
The far field stray light testing was performed using a radiometrically calibrated 1000 W studio lamp, and is defined as the light originating from the region between 4 and 62.5 degrees from the sensor boresight. During this testing, the VIIRS telescope was staring at a cavity type blackbody while the lamp was moved through 33 equally distanced hemispherical positions around the instrument to evaluate the angular stray light distribution. The lamp positions covered roughly equally divided annulus out to 62.5 degrees off nadir to simulate the earthshine reaching VIIRS detectors at J2 on-orbit operating altitude. In order to get better representation of the stray light contamination as seen on-orbit, the measured instrument response was scaled by the ratio of the studio lamp irradiance and a model of bright cloud irradiance.
While using a bright cloud, the VIIRS far-field stray light assessments should represent a worst-case scenario for VIIRS on-orbit measurements. The measured instrument response at each lamp position was weighted by the corresponding annulus, then aggregated over all positions to estimate the total stray
Lspec Lscat / Lspec Lspec Lscat / Lspec Lspec Lscat / Lspec
M1 412 6 162 2.77E-03 0.39 4.68E-03 0.37 0.45 0.34
M2 445 6 180 2.22E-03 0.45 3.95E-03 0.42 0.40 0.46
M3 488 6 160 2.00E-03 0.5 3.33E-03 0.36 0.32 0.43
M4 555 6 160 1.31E-03 0.47 2.25E-03 0.48 0.22 0.55
M5 672 6 115 8.70E-04 0.63 9.55E-04 0.67 0.10 0.67
M6 746 12 147 1.31E-03 0.12 1.08E-03 0.13 0.10 0.20
M7 865 6 124 5.16E-04 0.9 6.63E-04 0.83 0.06 0.62
M8 1240 6 57 9.47E-04 0.62 4.92E-04 0.65 0.05 0.57
M9 1378 NA NA NA NA NA NA NA NA
M10 1610 6 86.1 8.48E-04 0.76 1.03E-03 0.38 0.07 0.94
M11 2250 6 1.2 1.00E-03 0.42 6.03E-06 0.63 0.001 0.47
M12 3700 3 0.3 1.67E-03 0.64 4.78E-04 0.87 4.78E-04 0.62
M13 4050 3 1.7 1.86E-03 0.63 3.15E-03 0.47 3.15E-03 0.49
M14 8550 NA NA NA NA NA NA NA NA
M15 10763 3 12.5 7.75E-04 1.25 6.69E-03 0.66 9.69E-03 0.31
M16 12013 3 11.3 7.92E-04 1.26 8.95E-03 0.56 8.95E-03 0.48
J2
Band
Center Wavelength
(nm)
Angular Separation
(mrad)
Lbright
light contribution from the specified worse-case scenario. These measurements were derived at nadir and at the edge-of-scan to obtain stray light estimates at different scan angles.
Table 9 shows the estimated J2 VIIRS far field stray light input factors for each RSB: the dnspec, the dnstray, and the ratio dnstray/dnspec. The sensor test data analysis showed all RSB meet the stray light requirement with large margins at the beginning of life (dnstray/dnspec); margins are between 50 % (M7) and 91 % (I3). Furthermore, test results indicate that the stray light rejection is comparable between J2, J1 and SNPP. A noticeable difference is that the stray light in SNPP is much stronger along track than along scan direction; whereas in J1 and J2, the stray light is more evenly distributed over all angles. Another difference is that band M11 is compliant for J2 and J1 because of the Ltyp requirement change, from 0.12 (SNPP) to 1.0 Wm-2sr-1μm-1 (J1 and J2).
Table 9. Summary of J2 VIIRS stray light performance, and the ratio of measured stray light to requirement (1% Ltyp). The comparison to J1 and SNPP stray light performance is also shown.
4. Summary
The pre-launch testing program has provided a complete and comprehensive test data set needed to characterize and calibrate the J2 VIIRS sensor. Comprehensive radiometric performance was presented in this paper based on the NASA VCST data analysis effort, with support from sensor vendor and other government teams. All of J2 VIIRS 22 spectral bands have shown very good performance in all testing configurations and environments. The key radiometric performance metrics discussed included SNR, dynamic range, NEdT, gain transition, response versus-scan, relative spectral response, and scattered light. In general J2 VIIRS was comparable to J1 and SNPP VIIRS, and issues observed in J1, such as the polarization non-compliance (M1-M4) and non-linearity in the DNB and SWIR bands were corrected in J2 VIIRS, except M1 polarization which was improved but still not compliant. It was also observed that J2 VIIRS’s many non-compliances are due to design or sources limitations, and most of them are
dnspec dnstray dnstray / dnspec dnspec dnstray dnstray / dnspec dnspec dnstray dnstray / dnspec
M1 1444.1 44.9 17.02 2.58 0.15 7.84 2.42 0.31 8.04 2.23 0.28
M2 1526.1 40 9.39 2.53 0.27 9.03 2.68 0.3 8.97 1.83 0.20
M3 1563.5 32 8.81 2.56 0.29 8.12 2.89 0.36 9.53 1.84 0.19
M4 1510.7 21 7.53 2.39 0.32 7.5 2.96 0.39 7.96 1.58 0.20
M5 1265.7 10 5.06 2.38 0.47 4.69 2.57 0.55 4.59 1.43 0.31
M6 1088.9 9.6 8 3.62 0.45 7.22 2.95 0.41 6.91 2.25 0.32
M7 833.2 6.4 6.87 4.06 0.59 6.27 3.29 0.52 6.45 3.19 0.50
M8 353 5.4 1.45 0.77 0.53 1.82 0.44 0.24 1.33 0.49 0.37
M9 262.9 6 2.44 0.92 0.38 2.41 0.36 0.15 1.80 0.59 0.33
M10 165.7 7.3 3.55 1.3 0.36 3.44 0.22 0.06 2.90 0.28 0.10
M11 56.4 1 0.11 0.42 3.77 1.15 0.09 0.08 1.18 0.15 0.13
I1 1341.3 22 1.02 0.26 0.26 0.94 0.31 0.33 0.89 0.32 0.33
I2 833.2 25 2.51 0.39 0.15 2.12 0.31 0.15 2.15 0.36 0.16
I3 165.7 7.3 3.19 0.79 0.25 3.92 0.24 0.06 2.84 0.27 0.09
common to all VIIRS units (J2, J1 and SNPP) with some variations due to testing configurations. Once all data analyses were reviewed, a series of inputs were generated to populate the on-orbit SDR algorithm, such as the calibration coefficients and the RSR LUTs. Based on these results, J2 VIIRS instrument is expected to provide high quality data products post-launch, comparable to the previous two sensors or better, in support of various science disciplines and applications.
Acknowledgments
The authors of this paper would like to thank the VIIRS team members from Raytheon, NOAA, Aerospace Corporation, NASA Science Team, and University of Wisconsin team for their valuable contributions to VIIRS testing and performance verification effort. We also want to thank James McCarthy of Stellar Solutions as well as previous VCST members for their valuable support to the VIIRS program and to the pre-launch calibration and characterization effort.
Authors’ Contributions:
The co-authors have all provided valuable contributions to this paper as follows:
Oudrari, H: Was the lead author who provided the outline of the paper, contributed to the introduction, the sensor design and the sensor testing, and the compilation of the final paper.
McIntire, J: Provided the thermal emissive bands performance assessment, the response versus scan-angle performance, and the polarization sensitivity assessment.
Xiong, X.: Provided contribution to the sensor design and testing description, and the review of the paper at multiple phases to enhance quality and consistency.
Butler, J.: Provided the contribution to the sensor design and testing description, and the review of the paper at multiple phases to enhance quality and consistency.
Ji, J.: Provided the reflective solar bands performance, the stray light performance, and near field performance assessments.
Schwarting, T.: Provided the relative spectral response assessments, and contributions to the near field response performance and DNB calibration.
Angal, A.: Provided contributions to the reflective solar bands performance, and the editing of the manuscript’s plots and tables.
Conflict of Interest:
The authors declare no conflict of interest.
The founding sponsors had no role in the design of the study; in the collection, analyses, or interpretation of data; in the writing of the manuscript, and in the decision to publish the results
References
1. Xiong, X.; Butler, J.; Chiang, K.; Efremova, B.; Fulbright, J.; Lei, N.; McIntire, M.; Oudrari, H.; Wang, Z.; Wu, A. Assessment of S-NPP VIIRS On-Orbit Radiometric Calibration and Performance. Remote Sens. 2016, 8(2), 84, doi:10.3390/rs8020084.
2. Cao, C.; Blonski, S.; Wang, W. Progress in the calibration/validation of VIIRS on Suomi NPP and J1. IEEE International Geoscience and Remote Sensing Symposium (IGARSS), Beijing, 2016, pp. 2937-2940.
3. Cao, C.; De Luccia, F.J.; Xiong, X.; Wolfe, R.; Weng, F. Early On-Orbit Performance of the Visible Infrared Imaging Radiometer Suite Onboard the Suomi National Polar-Orbiting Partnership (S-NPP) Satellite. IEEE Trans. Geosci. Remote Sens. 2013, 52, 1142-1156.
4. Blonski, S.; Cao, C. Suomi NPP VIIRS Reflective Solar Bands Operational Calibration Reprocessing. Remote Sens. 2015, 7, 16131-16149.
5. Liu, Y.; Yu, Y.; Yu, P.; Göttsche, F.M.; Trigo, I.F. Quality Assessment of S-NPP VIIRS Land Surface Temperature Product. Remote Sens. 2015, 7, 12215-12241.
6. Wang, W.; Jiang, L.; Liu, X.; Son, S.; Sun, J.; Shi, W.; Tan, L.; Mikelsons, K.; Wang, X.; Lance, L. VIIRS ocean color products: A progress update. Proc. IEEE International Geoscience and Remote Sensing Symposium (IGARSS), Beijing, 2016, pp. 5848-5851.
7. Román, M.O.; Wang, Z.; Sun, Q.; Kalb, V.; Miller, S.D.; Molthan, A.; Schultz, L.; Belle. J.; Stokes, E.C.; Pandey, B.; Seto, K.C.; Hall, D.; Oda, T.; Wolfe, R.E.; Lin, G.; Golpayegani, N.; Devadiga, S.; Davidson, C.; Sarkar, S.; Praderas, C.; Schmaltz, J.; Boller, R.; Stevens, J.; Ramos González, O.M.; Padilla, E.; Alonso, J.; Detrés, Y.; Armstrong, R.; Miranda, I.; Conte, Y.; Marrero, N.; MacManus, K.; Esch, T.; Masuoka, E.J.; NASA's Black Marble nighttime lights product suite. Remote Sensing of Environment 2018, 210, pp. 113–143.
8. Jackson, J.M.; Liu, H.; Laszlo, I.; Kondragunta, S.; Remer, L.A.; Huang, J.; Huang, H. Suomi‐
NPP VIIRS aerosol algorithms and data products. Journal of Geophysical Research, Atmosphere 2013, 118(22), pp. 12,673-12,689.
10. Oudrari, H.; McIntire, J.; Xiong, X.; Butler, J.; Ji, Q.; Schwarting, T.; Lee, S.; Efremova, B. JPSS-1 VIIRS radiometric characterization and calibration based on pre-launch testing. Remote Sensing 2016, 8(1), pp. 41.
11. Joint Polar Satellite System (JPSS) VIIRS SDR Algorithm Theoretical Basis Document (ATBD), Goddard Space Flight Center, Greenbelt, MD, USA, 2011.
12. De Luccia, F.; Moyer, D.; Johnson, E.; Rausch, K.; Lei, N.; Chiang, K.; Xiong, X.; Fulbright, J.; Haas, E.; Iona, G. Discovery and characterization of on-orbit degradation of the visible infrared imaging radiometer suite (VIIRS) rotating telescope assembly (RTA). Proc. SPIE 2012, 8510, 85101A.
13. Joint Polar Satellite System (JPSS) J2 VIIRS Reflective Solar Bands - Performance Verification Report (PVR), Goddard Space Flight Center, Greenbelt, MD, USA, 2018.
14. Xiong, X.; Fulbright, J.; Wang, Z.; Butler, J. An overview of S-NPP VIIRS lunar calibration. IEEE InternationalGeoscience and Remote Sensing Symposium (IGARSS), 2015, Italy, pp. 3910–3913.
15. Schwarting, T.; McIntire, J.; Oudrari, H.; Sun, C.; Xiong, X. Pre-Launch Radiometric Calibration of the SNPP and JPSS-1 VIIRS Day/Night Bands. CALCON, Logan (Utah), 2016.
16. McIntire, J.; Moyer, D.; Oudrari, H.; Xiong, X. Pre-launch radiometric characterization of JPSS-1 VIIRS thermal emissive bands. Remote Sens. 2016, 8(1), pp. 47.
17. Moyer, D., J. McIntire, J. Young, J. K. McCarthy, E. Waluschka, X. Xiong, and F. J. De Luccia, "JPSS-1 VIIRS Prelaunch Polarization Testing and Performance," IEEE Trans. Geosci. Remote Sens. 2017, 55(5), pp. 2463-2476.
18. McIntire, J.; Young, J. B.; Moyer, D.; Waluschka, E.; Oudrari, H.; and Xiong, X. Analysis of JPSS J1 VIIRS Polarization Sensitivity Using the NIST T-SIRCUS. Proc. SPIE 2015, San Diego California, 9607, 960713.
19. Waluschka, E.; McCorkel, J.; McIntire, J.; Moyer, D.; McAndrew, B.; Brown, S.W.; Lykke, K.; Young, J.B.; Fest, E.; Butler, J.; Wang, T.R.; Monroy, E.O.; Turpie, K.; Meister. G.; Thome, K.J. J1 VIIRS polarization narrative: testing and performance. Proc. SPIE 2015, San Diego, California, 9607, 960712.
21. McIntire, J.; Moyer, D.; Chang, T.; Oudrari, H.; Xiong, X. Pre-Launch JPSS-2 VIIRS Response versus Scan Angle Characterization. Remote Sens. 2017, 9(12), 1300.
22. Moyer, D.; McIntire, J.; Oudrari, H.; McCarthy, J.; Xiong, X.; De Luccia, F JPSS-1 VIIRS Pre-Launch Response Versus Scan Angle Testing and Performance. Remote Sens. 2016, 8(2), 141.
23. Schwarting, T.; McIntire, J.; Oudrari; H.; Xiong, X. VIIRS pre-launch near field response characterization. Proc. SPIE, San Diego, California, 2017, 10402, 104021L.
24. Joint Polar Satellite System (JPSS) J2 VIIRS Product Requirement Document (PRD), Goddard Space Flight Center, Greenbelt, MD, USA, 2016.