Large Eddy & Interface Simulation (LEIS) of Disturbance
Waves and Heat Transfer in Annular Flows
Junfeng Yang1*, Chidambaram Narayananand2 and Dajmel Lakehal2
1
Department of Chemical Engineering, Imperial College London, London SW7 2AZ, UK
2
ASCOMP GmbH, Technoparkstrasses 1, 8005 Zürich, Switzerland
Corresponding Author: Junfeng Yang
Corresponding Author Email Address: [email protected]
Corresponding Author Telephone: +44(0)774 1595 467
Colloquium for the research topic: Thermal-Hydraulics and Core Physics
Abstract: A numerical method for forced convective boiling in an annulus needs to be developed in order to elucidate the reason for nucleation enhancement by disturbance waves. We first developed a numerical strategy to model the development of disturbance waves in annular flows where the highly turbulent gas core flow drives the laminar liquid flow upwards using advanced CFD tool TransAT. In which, the interface tracking method (e.g.
water. And it was found no disturbance waves occurred at liquid film Reynolds number lower than the critical value, 225.
Keywords: disturbance wave, annular flow, heat transfer, Large Eddy Simulation.
1.
Introduction
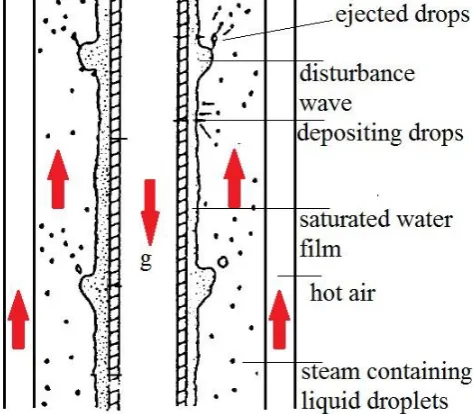
Annular two-phase gas-liquid (or vapour-liquid) flow occurs in a wide range of industrial equipment (boilers, condensers, pipelines, etc.) and is characterized by the presence of a thin, wavy liquid film driven along the wall by the shear force exerted by the gas (or vapor) phase in the core [1]. The film/core interface is covered by a complex pattern of waves. These waves are typically of two main types, namely ripples which are of small amplitude and cover the whole film surface and disturbance waves. The disturbance waves have the amplitude of the order of 5-6 times the mean film thickness and travel along the interface at much higher velocity than do the ripples [2]. Calculation of the mean heat transfer coefficient in annular flow based on mean film thickness and mean interfacial shear stress gives rise to a gross over-prediction of the coefficient [3] and it is evident that the intermittent nature of annular flow (and in particular the influence of disturbance waves) needs to be taken into account. Moreover, the experiments observed that nucleate boiling occurred in the disturbance wave itself and was suppressed in the substrate regions [4]. Possible explanations of this behavior include the following: Reduction of pressure in the wave region [5]; Decrease of saturation temperature induced by pressure reduction [6]; Bubble entrainment in waves [7]. The aim of present work attempts to improve fundamental understanding of the evolution of disturbance wave and its influence on the heat transfer and nucleate boiling in a steam-water annular flow using Large Eddy & Interface Simulation (LEIS) method.
combined with a scale-resolving turbulence simulation technique (e.g. Large Eddy Simulation) was employed to capture dominant turbulence and interfacial scales. The method involves
filtering continuity and Navier-Stokes equations a-priori defined for the one-fluid formulation.
And a direct phase change model was employed to predict the mass transfer rate of saturated water caused by the local temperature gradients. Then, the mass- and heat- transfer processes in the non-boiling annular flow was investigated to provide insight into the temperature gradient underneath the wave region. The modeling results are indicative and showing that disturbance waves trigger the locally overheated zones that could play key roles in activating the nucleation boiling sites. Furthermore, the characteristics of disturbance wave and its inception criteria have been studied and compared to those obtained from literature reports.
The rest of this paper is organized as follows. In Section 2, we present the details of our model. A discussion of our numerical results is provided in Section 3. Finally, Section 4 is devoted to concluding remarks.
2.
Numerical Experiment
2.1 Target experiment setup
Figure 1 The schematic of disturbance wave in the annulus.
In the experiment, the wall heat flux was adjusted to create fully developed nucleate boiling in the liquid film. The total mass flux and mass quality were also adjusted to obtain a range of liquid film Reynolds number (100-800).
2.2 Governing Equations
To predict the transient turbulent interfacial flow field accurately, the one-fluid formulation coupled with a wall-resolved Large Eddy Simulation (LES) approach is employed within the Finite Volume Method framework [9]. The governing equations of a mixture of two incompressible phases consist of two continuity equations, Eq. 1 for the mass of mixture and Eq. 2 for the phase marker function, and a single set of momentum and energy equations, Eqs. 3 and 4, respectively. The filtered governing equations solved herein can be written as follows:
(1) (2)
(3)
(4)
between carrier (gas) and dispersed (water) phases. ρ, Cp and λ are the density, heat capacity and thermal conductivity of the mixture that are linked directly to the property of each phase
(the subscripts, L and G denoting the phase index for liquid phase and gas phase, respectively)
and updated using . And is the volumetric heat source. More details of levelset function and mass transfer term, , in Eq. 2 can be found in Section 2.3.
On the right-hand-side of the filtered momentum equation (Eq. 3), the term
refers the surface tension force, with σ for the surface tension coefficient of taking the value of
0.05497 N/m for steam-water at 393 K, κ for the surface curvature, n standing for the normal
vector to the interface, and δ(ϕ) for a smoothed Dirac delta function centred at the interface. g
is the gravitational body force. The subscripts, i, j and k are the vector components in the ith, jth
and kth directions, respectively. The viscous stress tensor is written as:
(5)
where μ is the molecular viscosity of the mixture.
The unknown term, , is the sub-grid scale stress defined as . In the
present case, an eddy viscosity approach was chosen to the model the sub-grid stress tensor
such that with being the sub-grid scale turbulent viscosity. Here, is the
mean rate-of-strain tensor for the resolved scales defined by:
(6)
The Subgrid-scale (SGS) eddy viscosity, , that was modeled by wall-adapting local
eddyviscosity (WALE) method [10] given as below.
(7)
where the SGS model constant and Cs is set equal to 0.08 that yields
satisfactory results for turbulent multiphase flows [11]. Δ is the local grid size. The operator
is defined as:
(8)
(9)
where, and is the Kronecker symbol.
2.3 The level-set method and phase change model
In order to track the interface evolution of multiphase flow and update the mixture properties, the level-set method [12] is employed in the present work. The Level Set approach consists in solving a level-set advection equation, see Eq. 2, to track the interface on a fixed Eulerian grid.
The level-set function, , is a smooth signed-distance function referring to the shortest
distance to the front. The original level-set advection equation was extended with a source term to take into account the phase change due to the heat transfer, see the term on the right hand side of Eq. 2. The total velocity component in the convection term of Eq. 2 can be computed as
, where ucell is the cell centre velocity field, is the interfacial velocity due to
the mass transfer across the phase interface . is defined as the difference between the
inverse of fluid density across the interface , and is normal vector to the interface.
The exact location of the interface corresponds to the zero level of .
To update material properties like density, viscosity, heat capacity and thermal conductivity,
a Heaviside function is introduced defined by
(10)
A modified Heaviside function denoted by is employed to smooth the physical
properties (density, thermal conductivity, heat capacity and molecular viscosity) across a
numerically diffused interface thickness of 2ε.
(11)
where defined by
(12)
The interfacial mass transfer rate, , due to the heat and mass transfer process, e.g. evaporation, is activated only in the cells containing the interface and directly related to the local temperature field. Its formulation is given by
(13)
where T is the temperature, Tsat the saturation temperature of water phase, λ the thermal
conductivity, L the latent heat of phase change. The Dirac delta function reads:
(14)
Substituting Eq. 14 into the Eq. 13, one can see that the numerically diffused interface thickness determined by the local grid refinement affects the mass transfer rate directly.
Therefore, the mesh size gradient was specified near the wall region to enhance the mesh resolution and the accuracy of local mass transfer term.
2.4 Numerical model setup
Figure 2 Procedure of CFD modelling of non-boiling heat transfer in disturbance wave using TransAT software.
The whole simulation procedure includes 3 steps: coarse grid simulation solving Eqs. 1&3 for a turbulent single phase flow, medium grid simulation solving Eqs. 1-4 for two-phase flow with the heat transfer process, and fine grid simulation solving the same equations as the previous step but a much finer grid, see the flow chart in Fig. 2. The method of interpolating coarse gird onto fine grid has been widely investigated and found the maximum error of extrapolated values is less than 1% [14]. It is therefore valuable to adopt this method for the present study.
Ideally, the whole annulus 0.79 m long needs to be considered. This will extremely increase the computing load. Therefore, part of the annulus was extracted for the present simulation,
see Fig. 3. The computing domain is a block with dimension 2πh×h×πh in x-, y- and z-
direction. The hydraulic diameter, h, equals 6 mm for the current annulus system. The left/right,
front/back boundary condition were defined as periodic. The top and bottom surfaces were specified as the solid walls which have equal heat flux in/out respectively.
Figure 3 Computational domain and the boundary conditions (vertical annulus shown horizontally for diagrammatic purposes).
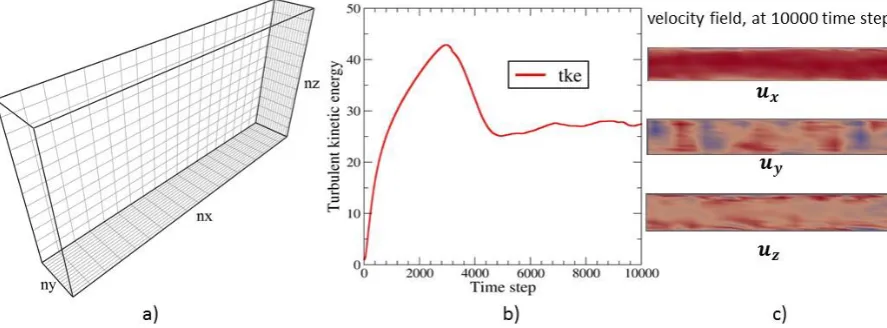
Figure 4 a) Coarse grid (nx×ny×nz = 20×16×13) simulation setup; b) history of absolute
turbulent kinetic energy averaged over the domain; c)the velocity contours on a slice in the
middle of the domain at 10 000 time step.
the domain versus the flow time history. Once the curve oscillates around a mean value, turbulence has developed. After around 4 000 time steps, the history of absolute turbulent kinetic energy curve becomes flat, which reflects a fully development turbulent flow in the computing domain (to the level possible on such a coarse grid), see Fig. 4b). The velocity contours showing highly turbulent bulk flow along the annulus vertical center plane at 10 000 time steps was displayed in Fig. 4c).
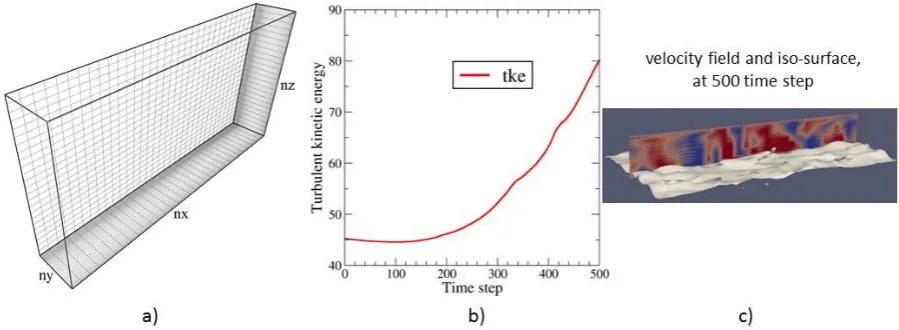
Figure 5 a) Medium grid (nx×ny×nz = 33×37×25) simulation setup; b) history of turbulent kinetic energy; velocity contour and steam/water interface (vertical annulus shown
horizontally for diagrammatic purposes) at 500 time step
Second, re-do all the setup on a medium grid in which the number of cells was doubled in each direction, see Fig. 5a). Then initialize the flow by the results (pressure and velocity field) of the coarse grid simulation. Meanwhile, patch a liquid (saturated water in the present study) film with certain thickness above the bottom wall and let the liquid film develop by the interfacial friction forced generated by the high speed bulk steam flow. After around 500 time steps, the initial condition of the wavy interface was generated, see Fig. 5c). The time history of turbulent kinetic energy curve for the system was given in Fig. 5b).
a) b)
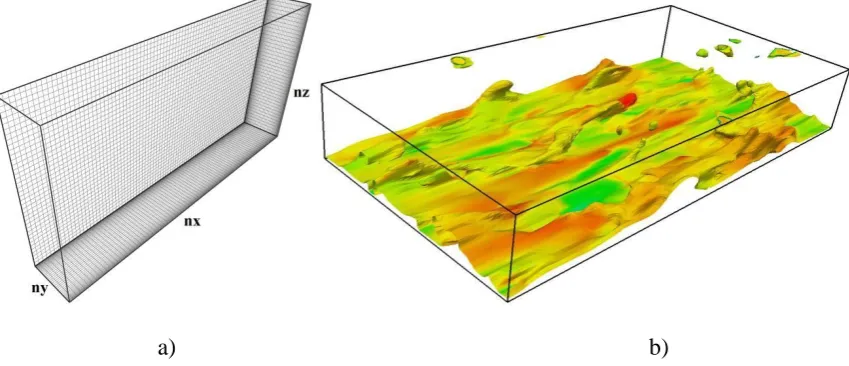
Figure 6 a) Fine grid (nx×ny×nz = 81×100×40) simulation setup: non-boiling heat transfer,
b) the iso-surface of
steam/water interface colored by velocity magnitude at 10 000 time
steps (vertical annulus shown horizontally for diagrammatic purposes).
The implicit unsteady simulation was run on the fine grid simulation for 3 s flow time with an adaptive time step. The computing domain was split into 4 sub-blocks and the parallel calculation conducted on 4-CPUs took total 384 CPU hours. The SIMPLE algorithm was
used for pressure-velocity coupling and the HLPA scheme [15] was used to discretize the convection terms in the energy and momentum equations. The QUICK scheme [16] was employed for the level set equation.
3.
Modeling Results and Discussion
3.1 Disturbance wave characteristics
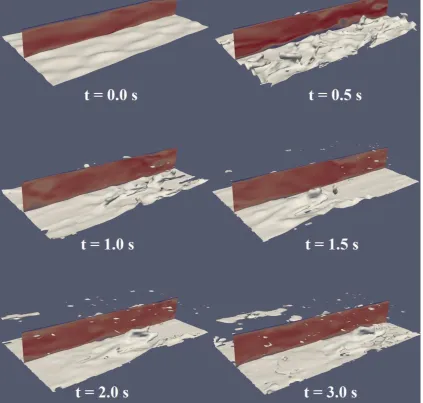
entrained droplets tended to coalescence and form relatively large liquid masses accumulating near the upper wall. The velocity contours clearly show relatively faster moving steam flow (red color) in the core region and lower velocity (blue color) near the wall region.
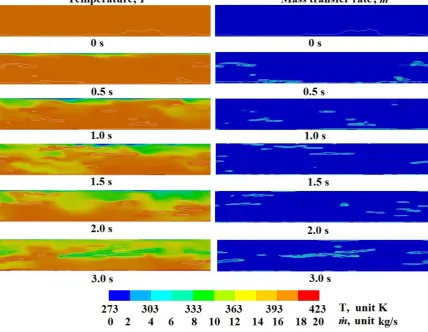
As the wall heat flux was imposed on the inner wall, the instantaneous contours of temperature and mass transfer rate along the annulus vertical center plane were recorded, see Fig. 8. The liquid film was heated up by the hot wall surface gradually, as shown by high temperature region (more strongly colored, i.e. red) adjacent to the bottom wall. Note that the temperature contours showed the fluids near the inner wall have a relatively higher temperature than those at the outer wall region. This was because the same amount of negative heat flux was imposed on the outer wall to balance out the positive heat flux imposed on the inner wall. In addition, the nucleate boiling in liquid film observed in the experiment has not been taken into account in the present the CFD simulation to avoid the numerical uncertainties caused by the nucleate boiling model itself. The heat transfer from liquid phase to steam phase was therefore under-predicted, resulting in the higher temperature in the liquid field compared to the steam phase. The contours of mass transfer rate revealed that the higher the temperature of liquid field, the faster the phase transfer. That was because the mass transfer rate is temperature dependent.
Figure 7 Instantaneous velocity contour (vertical center plane) and steam/water interface
(grey sheet) for condition: Reynolds number of steam, ReG = 36 000, Reynolds number of
saturated water, ReLF = 350, without wall heat flux (vertical annulus shown horizontally for
Figure 8 Predicted contours for instantaneous temperature and mass transfer rate along the
annulus vertical center plane for conditions: Reynolds number of steam, ReG = 36 000,
Reynolds number of saturated water, ReLF = 350 wall heat flux 100.0 kW/m2. The white curves
in the contour represent the steam/water interface (vertical annulus shown horizontally for diagrammatic purposes).
c)
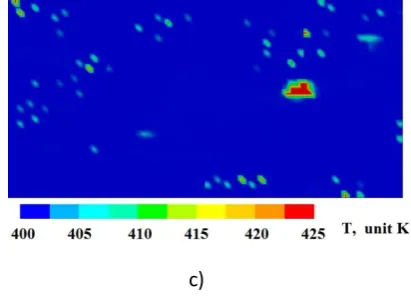
Figure 9 Predicted a) liquid film thickness, b) wall temperature profile along the annulus vertical center plane at different time instants conditions, and c) instantaneous wall surface
temperature distribution: Reynolds number of steam, ReG = 36 000, Reynolds number of
saturated water, ReLF = 350, wall heat flux 100.0 kW/m2.
To investigate the influence of disturbance waves on heat transfer, the evolution of the wall temperature profile along the annulus vertical center plane was presented in Fig. 9b). At the early stage (0-0.5s), the conduction heat transfer from the wall surface to adjacent liquid phase just started and thus wall surface exhibited a more or less uniform temperature distribution. If superimposing the transient wave profile and wall temperature curve, one can clearly see the
temperature spikes (Twall >> Tsat) tend to appear at the tail of waves at different time transients.
This temperature spikes indicated the locally hot ‘spots’ (see Fig. 9c)) appeared at the upstream of wave and potentially triggered the nucleation boiling sites. This finding is consistent with
the experimental observation by Barbosa et al. 2003 [4] in which the activate nucleation sites
are usually induced by the passage of the waves.
3.2 Critical Reynolds number of liquid film
Many experimental researches reported that the inception of disturbance wave takes place
only when the Reynolds number of liquid film, ReLF (defined as , is higher than
critical value, e.g. Ishii and Grolmes [17], 340; Asali et al. [18], 480; Owen [19], 410; Azzopardi
[20], 170; Barbosa et al. [4], 166. No disturbance waves were observed at ReLF lower than those
of the cases. Numerical prediction on this critical ReLF would be very valuable in terms of CFD
been conducted over the ReLF ranges (117-750). The basic model setup and geometry were taken as same as those described in Section 2.4. Although no mass flux boundary condition was used in the present simulation, the initial mass flux of saturated water entering the annulus can be adjusted by varying the initial thickness and velocity of water layer patched above the bottom
wall. The mass flux of saturated water, L, was selected as 0.0195 kg/m2-s, 0.039 kg/m2-s, 0.065
kg/m2-s and 0.13 kg/m2-s, which corresponds closely to the ReLF, 117, 225, 390 and 790,
respectively. A constant mass flux of steam phase, 25 kg/m2-s was used throughout this
investigation, which corresponds to a Reynolds number, ReG = 36 000.
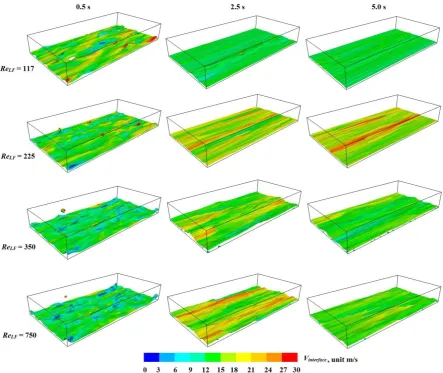
Figure 10 The transient iso-surface of steam/water interface under flow conditions of different
ReLF with fixed ReG = 36 000. The iso-surfaces are colored by interfacial velocity magnitude
and vertical annulus is shown horizontally for diagrammatic purposes.
low ReLF (117) condition. Whereas for the higher ReLF (225, 350 and 750) conditions, these ripples grow and develop into large disturbance waves that tend to maintain in the annulus for
a very long time. It seems the critical ReLF for the inception of disturbance wave is 225, which
is close to the empirical correlation of Azzopardi [20], and experimental observation of Barbosa et al. [4]. Note that this critical value is lower than those predicted by
Ishii and Grolmes’ correction, Asali’s correlation and Owen’s prediction.
The profiles of fully developed disturbance waves under different ReLF are plotted along the
annulus vertical center plane, see Fig. 11. In general, the mean liquid film thickness elevates as
the mass flux of saturated water increases. The result of ReLF (117) shows the liquid film is very
thin and drying out (dryout) for certain locations. Results of higher ReLF present the pronounced
disturbance waves that were separated by relatively quiescent substrate regions.
Figure 11 Predicted water film thickness along the annulus vertical center plane under flow
conditions of different ReLF with fixed ReG = 36 000.
4.
Conclusion
wave characteristics (peak amplitude, substrate thickness and wave length) were comparable to those for the typical disturbance waves [2], in which the maximum film thickness is about five times the substrate thickness and the disturbance wave region is to cover one-fifth of the total interfacial length. In addition, the velocity field, temperature field and phase transfer rate of the steam-water annular flow have been investigated. The wall surface temperature profile along the annulus vertical center plane revealed that locally hot ‘spots’ (which is much higher than the saturation temperature of water) occurred upstream of the disturbance wave. Such hot ‘spots’ could potentially trigger the nucleate boiling sites, which is consistent with the
experimental observation of Barbosa et al. Moreover, the influence of liquid film Reynolds
number was studied to explore the inception criteria of disturbance wave in the annular flow. It was found that disturbance waves are likely to occur and maintain in the annulus system if
ReLF exceeds the critical value, 225. This critical ReLF was in close agreement with certain
empirical correlation and experimental observation, but also show discrepancy with others. A
thorough discussion on this discrepancy could be the future work. In the case of ReLF below the
critical value, the disturbance waves tend to decay and eventually disappear.
The disturbance wave plays a crucial role in the heat transfer and nucleate boiling of annular flow in the Boiling Water Reactors and, based on the findings reported in the present work, further numerical studies of disturbance wave characteristics, e.g. wave frequency and velocity, and nucleate boiling are recommended.
Acknowledgments
This work has been accomplished in the frame of the FP7 project NURESAFE under grant agreement No.323263.
References
1. Hall Taylor, N.S., Hewitt, G.F., Lacey, 1963. P.M.C., The motion and frequency of
large disturbance waves in annular two phase flow of air water mixtures. Chem. Engng. Sci. 18, 537-552.
2. Hewitt, G.F., Nichols, B., 1969. Film thickness measurement in annular two phase
3. Jayanti, S., Hewitt, G.F., 1997. Hydrodynamics and heat transfer in wavy annular gasliquid flow: A computational fluid dynamics study. Int. J. of Heat and Mass Transfer. 40, 2445-2460.
4. Barbosa, J.R., Hewitt, G.F., Richardson, S.M., 2003. High-speed visualisation of
nucleate boiling in vertical annular flow. Int. J. of Heat and Mass Transfer. 46, 51535160.
5. Hewitt, G.F., Jayanti, S., 1996. Response of turbulent flow to abrupt changes in
surface roughness and its relevance in horizontal annular flow. Appl. Math. Modelling. 20, 244-251.
6. Hewitt, G.F., Jayanti, S., Kandlbinder, T., 1996. Turbulent flow in a pipe with
intermittent rough patches: An analogue of annular two-phase flow. Chem. Eng. Comm. 141-142, 23-259.
7. Cherdantsev, A.V., Hann, D.B. and Azzopardi, B.J., 2014. Study of gas-sheared liquid
film in horizontal rectangular duct using high-speed LIF technique: Threedimensional wavy structure and its relation to liquid entrainment. Int. J. of Multiphase Flow. 67, 52–64.
8. TransAT. 2015. ASCOMP GmbH CFD/CMFD software package.
http://www.ascomp.ch/transat
9. Lakehal, D., 1999. LEIS for the Prediction of Turbulent Multifluid Flows Applied to
Thermal Hydraulic Applications. Nucl. Eng. Design. 240, 2096–2106.
10.Nicoud, F., and Ducros, F., 1999. Subgrid-Scale Stress Modelling Based on the
Square of the Velocity Gradient Tensor. Flow, Turbulence, and Combustion. 62(3), 183-200.
11.Gulati, S., Narayanan, C., Buongiorno, J., Lakehal, D., 2013. Simulation of Liquid
Entrainment in Stratified and Annular Flow Regimes using Large-Eddy & Interface Simulation, LEIS, 8th International Conference on Multiphase Flow. ICMF 2013, Jeju, Korea, May 26 – 31.
12.Osher, S., and Sethian, J. A., 1988. Fronts propagating with curvature-dependent
speed: Algorithms based on hamilton-jacobi formulations. J. Comp. Phys. 79, 12-49.
13.Werner, H., Wengle, H., 1991. Large-Eddy Simulation of Turbulent Flow Over
and Around a Cube in a Plate Channel. In Eighth Symposium on Turbulent Shear Flows, Munich, Germany.
14.Groves, C.E., Ilie, M., Schallhorn, P., 2014. Interpolation Method needed for
Numerical Uncertainty Analysis of Computational Fluid Dynamics. 52nd Aerospace Sciences Meeting, AIAA SciTech, (AIAA 2014-1433).
15.Zhu, J., 1991. A low-diffusive and oscillation free convection scheme.
Communication in Applied Numerical Methods. 7, 225-232.
16.Leonard, B.P., Mokhtari, S., 1990. ULTRA-SHARP Nonoscillatory Convection
Schemes for High-Speed Steady Multidimensional Flow. NASA TM 1-2568 (ICOMP-90-12), NASA Lewis Research Center.
17.Ishii, M., and Grolmes, M.A., 1975. Inception criteria for droplet entrainment in
twophase concurrent film flow. AIChE Journal. 21, 308-318.
18.Asali, J.C., Leman, G.W. and Hanratty, T.J., 1985. Entrainment measurements and
their use in design equations. Physicochemical Hydrodynamics. 6, 207-221.
19.Owen, D.G., 1986. An experimental and theoretical analysis of equilibrium annular
flows, PhD Thesis, University of Birmingham, UK.
20.Azzopardi, B.J., 1997. Drops in annular two-phase flow. Int. J. Multiphase Flow. 23,
*Bibliography
Click here to view linked References
References
1. Hall Taylor, N.S., Hewitt, G.F., Lacey, 1963. P.M.C., The motion and frequency of
large disturbance waves in annular two phase flow of air water mixtures. Chem. Engng. Sci. 18, 537-552.
2. Hewitt, G.F., Nichols, B., 1969. Film thickness measurement in annular two phase
flow using a fluorescence spectrometer technique. Part 2 studies of the shape of disturbance waves. UKAEA Report No. AERE R4506, May 1969.
3. Jayanti, S., Hewitt, G.F., 1997. Hydrodynamics and heat transfer in wavy annular
gasliquid flow: A computational fluid dynamics study. Int. J. of Heat and Mass Transfer. 40, 2445-2460.
4. Barbosa, J.R., Hewitt, G.F., Richardson, S.M., 2003. High-speed visualisation of
nucleate boiling in vertical annular flow. Int. J. of Heat and Mass Transfer. 46, 51535160.
5. Hewitt, G.F., Jayanti, S., 1996. Response of turbulent flow to abrupt changes in
surface roughness and its relevance in horizontal annular flow. Appl. Math. Modelling. 20, 244-251.
6. Hewitt, G.F., Jayanti, S., Kandlbinder, T., 1996. Turbulent flow in a pipe with
intermittent rough patches: An analogue of annular two-phase flow. Chem. Eng. Comm. 141-142, 23-259.
7. Cherdantsev, A.V., Hann, D.B. and Azzopardi, B.J., 2014. Study of gas-sheared
liquid film in horizontal rectangular duct using high-speed LIF technique: Threedimensional wavy structure and its relation to liquid entrainment. Int. J. of Multiphase Flow. 67, 52–64.
8. TransAT. 2015. ASCOMP GmbH CFD/CMFD software package.
http://www.ascomp.ch/transat
9. Lakehal, D., 1999. LEIS for the Prediction of Turbulent Multifluid Flows Applied
to Thermal Hydraulic Applications. Nucl. Eng. Design. 240, 2096–2106.
10.Nicoud, F., and Ducros, F., 1999. Subgrid-Scale Stress Modelling Based on the
Square of the Velocity Gradient Tensor. Flow, Turbulence, and Combustion. 62(3), 183-200.
11.Gulati, S., Narayanan, C., Buongiorno, J., Lakehal, D., 2013. Simulation of Liquid
Entrainment in Stratified and Annular Flow Regimes using Large-Eddy & Interface Simulation, LEIS, 8th International Conference on Multiphase Flow. ICMF 2013, Jeju, Korea, May 26 – 31.
12.Osher, S., and Sethian, J. A., 1988. Fronts propagating with curvature-dependent
speed: Algorithms based on hamilton-jacobi formulations. J. Comp. Phys. 79,
12-49. 13.Werner, H., Wengle, H., 1991. Large-Eddy Simulation of Turbulent Flow
Over and Around a Cube in a Plate Channel. In Eighth Symposium on Turbulent Shear Flows, Munich, Germany.
14.Groves, C.E., Ilie, M., Schallhorn, P., 2014. Interpolation Method needed for
1
15.Zhu, J., 1991. A low-diffusive and oscillation free convection scheme.
Communication in Applied Numerical Methods. 7, 225-232.
16.Leonard, B.P., Mokhtari, S., 1990. ULTRA-SHARP Nonoscillatory Convection
Schemes for High-Speed Steady Multidimensional Flow. NASA TM 1-2568 (ICOMP-90-12), NASA Lewis Research Center.
17.Ishii, M., and Grolmes, M.A., 1975. Inception criteria for droplet entrainment in
twophase concurrent film flow. AIChE Journal. 21, 308-318.
18.Asali, J.C., Leman, G.W. and Hanratty, T.J., 1985. Entrainment measurements and
their use in design equations. Physicochemical Hydrodynamics. 6, 207-221.
19.Owen, D.G., 1986. An experimental and theoretical analysis of equilibrium annular
flows, PhD Thesis, University of Birmingham, UK.
20.Azzopardi, B.J., 1997. Drops in annular two-phase flow. Int. J. Multiphase Flow.