Marking scallops for release
and recapture
T Lucas, P Palmer, S Wang, R Scoones
and E O’Brien
Department of Primary Industries and Fisheries Bribie Island Aquaculture Research Centre
Woorim, Queensland, Australia, 4507
Project number 2005/016
Final Report - July 2008
Marking scallops for release
and recapture
T Lucas, P Palmer, S Wang, R Scoones
and E O’Brien
Department of Primary Industries and Fisheries Bribie Island Aquaculture Research Centre
Woorim, Queensland, Australia, 4507
Project number 2005/016
Final Report – July 2008
Marking scallops for release and
recapture
T Lucas
1, P Palmer
1, S Wang
1, R Scoones
2and E O‟Brien
1,31
Department of Primary Industries and Fisheries Bribie Island Aquaculture Research Centre 144 North Street
Woorim Qd l 4507 Australia
2
Rick Scoones and Associates PO Box 853
Nedlands WA 6909 Australia
Current address:
3
Department of Primary Industries and Fisheries Primary Industries Building
80 Ann Street Brisbane Qld 4000 Australia
This project was funded by the Fisheries Research and Development Corporation in partnership with the Department of Primary Industries and Fisheries, Queensland and Queensland Sea Scallops Pty Ltd.
© Copyright Fisheries Research and Development Corporation and Department of Primary Industries and Fisheries, 2008.
This work is copyright. Except as permitted under the Copyright Act 1968 (Cth), no part of this publication may be reproduced by any process, electronic or otherwise, without the specific written permission of the copyright owners. Neither may information be stored electronically in any form whatsoever without such permission.
TABLE OF CONTENTS
Non-Technical Summary ... 7
Acknowledgments ... 9
1. Background ... 10
2. Need ... 11
3. Objectives ... 12
4. METHODS ... 13
4.1 Developing a shell marking system for hatchery reared saucer scallops ... 13
4.1.1 Experiment 1 - Using OTC, calcein and alizarin red S to mark large and small juvenile scallops ... 14
4.1.2 Experiment 2 - Testing two concentrations of OTC, calcein and alizarin red S using 5 mm spat ... 14
4.1.3 Experiment 3 - Double-cross marking with OTC and calcein ... 15
4.1.4 Experiment 4 - Marking spat using OTC and calcein with a range of concentrations and exposure times ... 16
4.1.5 Experiment 5 - Testing Tris and bicarb to stabilise pH during OTC exposure ... 17
4.1.6 Experiment 6 - Double-marking spat using OTC at three concentrations and buffered with Tris or bicarb ... 18
4.2 Improving survival and growth of juvenile scallops in a land-based system ... 20
4.3 Fluorescent shell marking of the pearl oyster Pinctada imbricata ... 24
5. Results and discussion ... 26
5.1 Developing a shell marking system for hatchery reared saucer scallops ... 26
5.1.1 Experiment 1 - Using OTC, calcein and alizarin red S to mark large and small juvenile scallops ... 27
5.1.2 Experiment 2 - Testing 2 concentrations of OTC, calcein and alizarin red S using 5 mm spat ... 27
5.1.3 Experiment 3 - Double-cross marking with OTC and calcein ... 29
5.1.4 Experiment 4 - Marking spat using OTC and calcein with various concentrations and exposure times ... 30
5.1.5 Experiment 5 - Testing Tris and bicarb to stabilise pH during OTC exposure ... 31
5.1.6 Experiment 6 - Double-marking spat using OTC at three concentrations and buffered with Tris or bicarb ... 35
5.2 Improving survival and growth of juvenile scallops in a land-based system ... 39
5.3 Retention of fluorescent shell marks over time in the saucer scallop Amusium balloti ... 46
5.4 Fluorescent shell marking of the pearl oyster Pinctada imbricata ... 48
5.5 General Discussion ... 50
6. Benefits and adoption ... 54
7. Further development ... 55
8. Planned outcomes ... 56
9. Conclusions ... 57
11. Appendices ... 62
11.1 Intellectual property ... 62
11.2 Staff... 62
11.3 Publications and other dissemination ... 62
11.4 Permit for commercial use of OTC ... 78
11.5 Manual for the marking of scallop spat with OTC ... 80
List of Figures Figure 1. Chemical immersion setup for Experiment 2 ... 15
Figure 2. Mesh screens used in Experiment 6. ... 23
Figure 3. An image used to measure scallop shells on the base of screens ... 24
Figure 4. Observing marked scallops under UV light ... 26
Figure 5. Marks produced in the shells of Amusium balloti spat using each chemical ... 28
Figure 6. Mean percentage of scallops (n = 2, ± s.e.) that were successfully marked in Experiment 2, seven days after treatment. ... 29
Figure 7. Mean percentage survival of scallops in different treatments (n = 2, ± s.e.) in Experiment 2, seven days after treatment ... 29
Figure 8. Scallop spat double-marked with calcein, then OTC ... 30
Figure 9. Scallop spat double-marked with OTC and then calcein. ... 30
Figure 10. Mean (n = 2, ± s.e) assigned mark brightness of scallops 1 week after marking treatments in Experiment 4 ... 31
Figure 11. Mean (n=2, ± s.e) survival of scallops 1 week after marking treatments in Experiment 4 ... 31
Figure 12. Adjusting pH using bicarb in 250 mL seawater with 300 mg L-1 OTC ... 32
Figure 13. The effect of bicarb, then time on pH of OTC solutions. . ... 32
Figure 14. The effect of Tris and then time on OTC solutions. ... 33
Figure 15. Comparing Tris and bicarb as buffers for OTC at 300 mg L-1 over 24 h ... 33
Figure 16. Froth in four solutions after 17 h aeration. ... 34
Figure 17. Precipitation using bicarb or Tris after 24 h. ... 34
Figure 18. Changes in pH during chemical immersions in Experiment 6 ... 35
Figure 19. Mean survival (n = 4, ± s.e.) of scallops one week after treatment in Experiment 6 ... 36
Figure 20. Marked scallop shells using OTC with bicarb (left) or Tris (right). ... 36
Figure 21. Detailed view of single marks generated by 300 mg L-1 OTC with Tris buffer. ... 37
Figure 22. Mean (n = 4, ± s.e) mark brightness scores from Experiment 6 one week after treatment ... 37
Figure 23. Mean (n = 2, ± s.e.) survival 1 week after chemical treatment for mark 2 in Experiment 6 ... 38
Figure 24. Mean (n = 2, ± s.e.) mark brightness scores for the second mark in Experiment 6, 7 d after treatment ... 38
Figure 25. Mean survival (± s.e) of treatments from Experiment 4. ... 40
Figure 26. Mean survival (± s.e.) of treatments from Experiment 6 ... 40
Figure 27. Average (± s.e.) survival of combined treatments (All Exp.) and control groups (Cont. Exp.) between Experiments 4 and 6 ... 41
Figure 28. Mean (± s.e.) shell growth of scallops in Experiment 4. ... 41
Figure 30. Comparisons between the average (± s.e.) growth of combined
treatments (All Exp.) and control (Cont. Exp.) groups between Experiments 4 and 6 ... 44 Figure 31. Comparing seabeds after one week of use with (left) or without
scallops ... 44 Figure 32. A healthy scallop covered in sand (top) and below it, a scallop
covered in stalked ciliates ... 45 Figure 33. Scallops fouled with stalked ciliates after 1 month in a seabed
simulation system. ... 46 Figure 34. Mean (± s.e.) mark brightness scores from Experiment 4 ... 47 Figure 35. First comparison of the brightness of the first and second marks in
Experiment 6. ... 48 Figure 36. Second comparison of both marks in Experiment 6. ... 48 Figure 37. Increase in mean shell height of oysters (n = 14, ± s.e.) with or
without sand on the floor of screens ... 49 Figure 38. Mean (± s.e.) mark length and mark brightness scores (n = 4)
among treatments in pearl oysters ... 50 Figure 39. Adult wild-caught Amusium balloti shells ... 52
List of Tables
Table 1. The chemicals and concentrations used to mark A. balloti spat over
48 hours in Experiment 2 ... 14 Table 2. The chemicals and concentrations used for double-cross marking
A. balloti spat ... 16 Table 3. Chemical treatments used in Experiment 4 ... 16 Table 4. Mark brightness scale for quantifying observed fluorescence from
Day et al. (1995) ... 17 Table 5. Summary of spat marking treatments for Experiment 6 ... 19 Table 6. Experimental design and survival from Experiment 3 ... 30 Table 7. Table of mean mark brightness scores from Experiment 6 showing
interaction between buffer, OTC concentration and assessment date ... 39 Table 8. Table of mean mark brightness scores from Experiment 6 showing
interaction between OTC concentration and mark number ... 39 Table 9. Table of mean growth (mm) from Experiment 6 showing interaction
NON-TECHNICAL SUMMARY
Objectives
To develop a method to mark hatchery reared saucer scallops to distinguish them from animals derived from wild populations.
The saucer scallop Amusium balloti is a valuable fisheries resource for Queensland, however wild catches are known to fluctuate dramatically between seasons. Methodology has now been developed to stabilise catches by supplementing natural recruitment with hatchery-produced spat at 2-5 mm. This project aimed to help identify the hatchery-produced spat upon recapture so that the success of the re-seeding strategy could be evaluated. Furthermore, identification of hatchery-produced scallops enables feedback, which will help to optimise spat deployment strategies. The perfect marker would incorporate into the shell in a rapid, reliable way, be easily identified upon recapture 8-12 months later, be non-toxic for both the scallops and human consumption, and be approved and affordable for commercial use.
Principal Investigator: Dr Paul J Palmer
Address: Department of Primary Industries and Fisheries
Bribie Island Aquaculture Research Centre PO Box 2066 (144 North Street)
Woorim, Qld, Australia, 4507
Telephone: (07) 3400 2050 Fax: (07) 3408 3535
E-mail: [email protected] 2005/016 Marking scallops for release and recapture
Outcomes achieved
Three chemicals, namely alizarin red S, calcein and oxytetracycline (OTC), were tested in this study for mark quality, mark retention and toxicity to scallops. Marks were identified and visually assessed for brightness using an epifluorescence microscope. Of the three chemicals, OTC was identified as producing a brighter, more persistent mark than calcein, and lower mortality than alizarin red S. Fluorescence incorporated into the scallop shells was still visible after 10 months of culture in controlled conditions. The efficient use of pH buffers was refined for use in OTC marking procedures.
In a separate experiment, scallops were OTC-marked twice, one month apart with negligible mortality, and were subsequently reared in a simulated sea-bed environment with managed sand substrate. This demonstrated that the brightness of the initial marks was comparable to new marks, and that „bar codes‟ could be created with multiple shell mark patterns. Multiple marks have potential to be used to distinguish between cohorts or size classes of cultured spat. A healthy sand substrate was found to prevent fouling of new shell growth and resulted in higher survival and growth than in previous experiments.
This study determined that immersing scallops for 3 days in OTC at 200 or 300 mg L−1 can produce reliable fluorescent shell marks with negligible mortality. This chemical exposure was generally conducted in low light conditions, with minimal temperature and pH fluctuations, and in the presence of adequate levels of several species of cultured microalgae in the seawater so that scallops continued to feed for maximum chemical uptake. Marks can persist for at least 10 months in living scallops, and this indicates that the methodology will be useful for industrial application. Our commercial partners Queensland Sea Scallop Ltd are currently undertaking preliminary commercial trials.
ACKNOWLEDGMENTS
1. BACKGROUND
The project was initially proposed in support of the FRDC Project (No. 2002/048) entitled “Enhancement of saucer scallops (Amusium balloti) (Bernardi) in Western Australia” as well as the scallop enhancement program being conducted by Queensland Sea Scallops Ltd in Hervey Bay in Southern Queensland. To determine optimal methods and sizes for release the first season of spat deployment in FRDC 2002/048 saw approximately 12 million spat of different sizes (0.5 mm to 4.0 mm) released onto a number of locations on the seabed offshore from Geraldton, WA. The results of high intensity trawling over the reseeding site between eight and 20 months after these deployments revealed higher catches in one location than anywhere in the nearby surrounding waters, but the distribution of the catches relative to those on adjacent seabed areas did not permit researchers to be categorical in asserting that any of them had origins in the hatchery stock released during 2002. A minor but widespread natural recruitment of scallops had contributed to the problem of determining the origins of the scallops recovered. In the absence of a significantly higher localised density of scallops, only a permanent identifying mark was considered likely to have allowed the researchers to be certain as to whether the scallops had wild or hatchery origins.
In Australia, only two companies (one in WA and one in Qld) have been involved with the sea ranching of saucer scallops. Both have highlighted the development of an identifying mark as a research priority and both have been involved in developing and supporting this research.
As outlined by Rothlisberg and Preston (1992), tagging methods used in reseeding programs ideally should 1) be able to mark small individuals, 2) be detectable in all subsequent life history stages (especially the adult), 3) be unique to the local population, 4) be suitable for identification of individuals or cohorts, 5) be inexpensive to apply and detect, 6) be harmless to the tagged animals and subsequent consumer, and 7) be acceptable to the public. A review of scientific literature regarding tagging methods which adhered to these requirements revealed immersion marking as the preferred option, and three likely chemicals for this application, namely, alizarin red S, calcein and oxytetracycline (OTC). Since the commercial objectives of saucer scallop sea ranching require deployment of juveniles at around 4 mm shell length, the chemical tags would likely need to be applied just prior to deployment.
2. NEED
The ability to distinguish hatchery-produced scallops from wild recruits was found necessary to determine the survival and optimal size, site and time of deployment to the seabed in the previous scallop reseeding project FRDC 2002/48. Furthermore, to enable rigorous evaluation of commercial marine reseeding ventures, a means of identifying the released scallops upon recapture is required. Successful labelling of juvenile scallops will also allow researchers to estimate other biologically relevant factors that could be used in species management plans, such as growth rates, dispersal and migration patterns.
3. OBJECTIVES
To develop a method to mark hatchery reared saucer scallops to distinguish them from animals derived from wild populations.
Detailed Objectives
The project Milestones guided activities towards the overall objective listed above. These were as follows:
1. By June 2006 : Successful testing of a range of chemical labelling methods on juvenile scallops at Bribie Island Research Station.
2. By June 2007 : Successful testing of retention of labels in scallops at 8 to 12 months in tanks at Bribie Island Research Station.
Revised due date for Milestone 2 following approved project extension.
4. METHODS
4.1 Developing a shell marking system for hatchery reared saucer scallops
This scallop shell marking research was carried out with a logical sequence of short- and longer-term experiments which addressed chemical immersion methods and the rearing environment necessary for mark evaluation. This included three preliminary chemical exposure experiments (Experiments 1, 2 and 3). These experiments identified several inadequacies in the marking and rearing systems that were initially applied. Progressive testing and improvements in the rearing environment are documented in Section 4.2. Two more detailed mark retention trials (Experiments 4 and 6) applied a range of improved methodologies, and several short-term trials with focus on the use of pH buffers for immersion solutions are collectively described as Experiment 5.
All scallops used for this project were obtained from Queensland Sea Scallops (QSS Ltd). Small spat (approx 4 mm diameter) were sourced from their hatchery at Burnett Heads, and scallop “buttons” larger than 10 mm shell height (~ diameter) were sourced from the wild via their hatchery holding facilities. Experiments were conducted at the Bribie Island Aquaculture Research Centre (BIARC), Queensland, Australia, following acclimation of transferred animals in various seawater systems. Scallop shells were marked by immersing live scallops in seawater solutions containing the various chemicals which were incorporated into new shell growth over a number of days.
Similar supplemental research directed at marking the shells of Akoya pearl oyster (Pinctada imbricata) shell was conducted to further test marking methods and rearing facilities for an alternative bivalve species. The long-term mark retention and survival results from the scallop marking experiments are presented separately in Sections 4.4 and 5.5.
All mark detection was done with a Nikon Microphot FXA epifluorescence microscope using a super-high pressure mercury lamp with three different light wavelength filters. The type of light required to view marked shells was dependant on the marking chemical used. For OTC, ultra-violet (UV) was achieved with a DM455 filter (Nikon), for alizarin red S, green light was produced with a XF102-2 filter (Omega Optical), and for calcein, a DM510 filter (Nikon) produced blue light.
4.1.1 Experiment 1 - Using OTC, calcein and alizarin red S to mark large and small juvenile scallops
This first experiment sought to mark a small number of scallops and assess survival using chemicals and concentrations that had previously been successful in other molluscan species (Hidu and Hanks, 1968; Newell and Hidu, 1982; Jackson, 1990; Pirker and Schiel, 1993; Day et al., 1995; Kaehler and McQuaid, 1999; Moran, 2000; Eads and Layzer, 2002).
Three treatments each containing 5 large (~15 mm) and 10 small (~2 mm) animals were used, namely:
1. OTC 500 mg L-1 2. Alizarin red S 20 mg L-1 3. Calcein 50 mg L-1
The animals were placed freely in plastic tubs with 16 L of filtered (20 µm) seawater containing marking chemicals and cultured microalgae. The microalgae consisted of an equal blend of three microalgae species, being Isochrysis galbana, Pavlova lutheri and Chaetoceros muelleri, at a final concentration of 30,000 cells mL−1. The solutions were gently aerated on a continuous basis and replaced after 24 h. The total exposure period was 72 h. After treatment, the scallops were placed into clean aerated tubs of seawater with a similar concentration of microalgae. After three days survival was assessed by inspection under the microscope. Scallops were then maintained in aerated tanks with a continuous (3 × tank volume per day) exchange of filtered seawater and a continuous similarly metered supply of these microalgae until the surviving scallops were used for Experiment 3, 20 days later.
4.1.2 Experiment 2 - Testing two concentrations of OTC, calcein and alizarin red S using 5 mm spat
The aim of Experiment 2 was to further test the three previously identified chemicals on scallop spat. Two concentrations were used for each chemical (Table 1), and 50 pat were used in duplicate for each treatment. The average (± se) size of scallop spat at the beginning of the experiment was 5 ± 1.3 mm. During chemical exposure, these were housed in screen chambers made from 250 mm PVC pipe with 500 µm mesh bottoms. These were partially submerged in the chemical dilutions, inside rectangular plastic trays (527 mm long x 381 mm wide x 140 mm deep). The total volume of water used in each treatment was 16 L, and the volume inside the screen was 1.8 L. One air stone was placed inside each screen chamber to provide gentle circulation and aeration (Figure 1).
Table 1. The chemicals and concentrations used to mark A. balloti spat over 48 hours
in Experiment 2
Chemicals Concentrations
OTC 500 & 750 mg L-1
Calcein 25 & 50 mg L-1
Alizarin red S 10 & 20 mg L-1
Figure 1. Chemical immersion setup for Experiment 2
Filtered (20 µm) seawater (27-29ºC, 34-35 ppt) was used for all treatments and the control. The pH of all treatments was adjusted to 7–8 immediately prior to the addition of spat using NaHCO3 (bicarb), whereas the control was left unadjusted at pH 8.0-8.2. Spat were treated for 48 h, with water and chemicals renewed after 24 h. This renewal was undertaken by removing the screen and placing in freshly premixed chemical baths. Three species of microalgae were added to each experimental unit at a feeding rate of 10,000 cells mL−1 for each species (as in Experiment 1).
After chemical exposures, spat in screen chambers were rinsed and placed into a 500 L tank with filtered seawater and a similar concentration of microalgae. Water was renewed daily by flushing seawater through the tank for 90 min at 500 L h−1. Fresh microalgae was supplied after each water exchange. The screen chambers were operated as down-wellers by attaching airlifts to each of the screen chambers. Airlifts consisted of 4 mm air tube delivering air (6 psi) to 30 mm air stones inside the base of vertical 19 mm pipe with top elbow to direct water flow. The scallop spat were given 7 days to stabilize prior to the first shell mark and mortality assessments.
4.1.3 Experiment 3 - Double-cross marking with OTC and calcein
The scallops were placed into screens in 16 L tubs containing filtered seawater, marking chemicals (calcein or OTC) and microalgae as described for Experiment 2. Gentle aeration was again provided for each treatment inside the screen chambers. The treatment lasted for 48 h with no water exchange. After the treatment, all screen chambers and scallops were moved into a single raceway tank. The screen chambers were operated as downwellers by attaching an airlift to each of the screen chambers as previously described. Unfiltered (raw) seawater was supplied to the scallops without microalgal supplementation. Survival and retention of the chemical marks was assessed after one week.
Table 2. The chemicals and concentrations used for double-cross marking A. balloti
spat
Chemicals used in
Experiment 1 OTC 500 mg L
-1
Calcein 50 mg L-1 Control (no mark)
Size (mm) 4-6 14-25 4-6 14-25 14-25
Number of animals
used 8 5 7 5 12 12
Chemical used in
Experiment 3 Calcein
50 mg L-1
OTC
500 mg L-1
Calcein
50 mg L-1
OTC
500 mg L-1
4.1.4 Experiment 4 - Marking spat using OTC and calcein with a range of concentrations and exposure times
This fourth experiment explored a wider range of concentrations and exposure times for OTC and calcein as applied to 2-5 mm scallops. Treatments compared the marking success and toxicity of long exposures at low concentration with shorter exposures at higher concentrations.
Sixty spat were placed inside each of two screens per treatment and control (Table 3) and these were immersed in marking solutions for either two or seven days. Scallops in control screens were subjected to all handling stresses and conditions associated with marking for seven days, but without the chemicals.
Table 3. Chemical treatments used in Experiment 4
Abbreviation Immersion period (days) Chemical Concentration (mg L-1)
2-Cal-50 2 Calcein 50
7-Cal-10 7 Calcein 10
7-Cal-20 7 Calcein 20
2-OTC-500 2 OTC 500
2-OTC-750 2 OTC 750
7-OTC-250 7 OTC 250
7-OTC-500 7 OTC 500
Control 7 0 0
supplied constantly to the scallops at 0.5 L min-1, which was equal to 2.6 times the volume of the tank per day.
After one week, mortality and mark brightness were evaluated. All mark assessments were undertaken using a „blind‟ selection and observation procedure so that expectations associated with treatment labels did not bias the results. Mark brightness was rated between zero and five according to Day et al. (1995) as shown in Table 4. Unlike the assessment used by Day et al. (1995), we did not score mark length because it was not informative in scallops (ie. it was either 0 or 5). These scallops were then grown at BIARC for 10 months to determine mark longevity. The details regarding the long-term maintenance and monitoring of these animals is presented in section 4.2.
Table 4. Mark brightness scale for quantifying observed fluorescencefrom Day et al.
(1995)
Mark brightness rating Description
0 Not detectable
1 Just detectable
2 Dull
3 Bright
4 Intense, thin
5 Intense, thick
4.1.5 Experiment 5 - Testing Tris and bicarb to stabilise pH during OTC exposure
The aim of these trials was to optimise pH conditions for scallop marking, under the assumption that minimal pH change away from the basline level of seawater (8.0-8.2) during chemical exposure would help maintain normal scallop feeding activities. This would result in maximum shell growth and chemical uptake, and minimise stresses which could lead to mortalities.
To address these concerns, a series of short-term trials were designed to:
a) Measure the concentration of bicarb required to more effectively adjust the pH of OTC solutions at the planned concentrations of 100, 200 and 300 mg L−1. Observe and qualitatively assess precipitation at all concentrations.
b) Test Tris as an alternative pH buffer, at the concentration recommended from previous research in fish otolith marking of 0.6 g per 1 g OTC (Dan Willett, QDPI&F pers. comm.). Compare precipitation observations with those for bicarb.
c) Describe the typical changes in pH over time, as each solution is used for 24 h exposure periods.
All trials were conducted indoors at a controlled temperature of 23.5°C. The first trial involved OTC dissolved in three beakers of 500 mL seawater at concentrations of 100, 200 and 300 mg L−1. Each solution was then divided into two portions of 250 mL for use with either Tris and bicarb as the buffering agent. The pH was measured at the start of the trial and regularly after that using a hand held digital pH meter (pHScan BNC, Eutech Intruments) which had been calibrated prior to the beginning of the experiment. Bicarb was added to each of the three bicarb treatments in small increments initially, stirred vigorously and the beakers were visually inspected to ensure dissolution of powder before recording the pH. Increasing quantities of bicarb were added to the solution until the pH failed to increase substantially. In each of the three Tris treatments, Tris buffer was only added once, at the recommended dose of 0.6 g per g OTC. The pH was measured after initial addition of chemicals, and then all six solutions were left overnight with vigorous fine bubble aeration (30 mm airstone). These solutions were visually assessed for precipitation and the pH was tested after 16 h and 24 h.
The second trial built on the results of the first by further investigating the effect of time on the pH of the highest concentration (300 mg L-1) of OTC planned for use in shell marking experiments. Treatments comprised unbuffered solutions and solutions buffered with the previously determined optima of either 1.2 g L-1 bicarb or 180 mg L−1 Tris. Plain seawater was used as a control. Solutions were vigorously aerated and pH was recorded at 0 h, 17 h and 24 h.
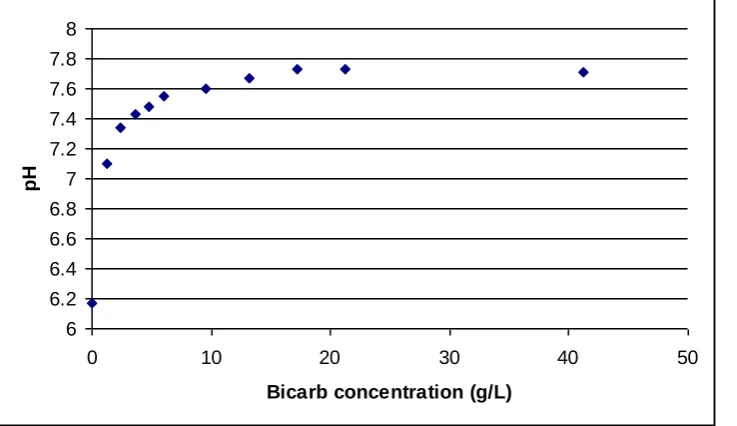
A third trial within this series directed at buffers aimed at determining an amount of bicarb able to provide pH 8 in 300 mg L-1 OTC solution with minimal fluctuation of pH through time. This was necessary because we had thus far failed to achieve the desired pH of 8 without the effect of time. Concentrations of 1.2, 2.4, 3.6, 4.8, 6.0, 9.6, 13.2, 17.2, 21.2 and 41.2 g L-1 bicarb were tested.
4.1.6 Experiment 6 - Double-marking spat using OTC at three concentrations and buffered with Tris or bicarb
This sixth and final shell marking experiment tested the survival and mark quality of scallop spat immersed in various OTC solutions. This chemical had proven the most reliable in terms of marking success. It was also preferred due to survival improvements thought possible by replacing bicarb with more stable Tris-buffered solutions, and because it (unlike the other chemicals) was approved for use by the Australian Pesticides and Veterinary Medicines Authority (APVMA).
(eg: less than 500 mg L-1), and concentrations close to 250 mg L-1 which had produced clearly visible shell marks in Experiment 4. The levels of bicarb and Tris used were the previously determined optima derived in Experiment 5.
All chemical exposures were performed over three days, because the seven day exposure period tested in Experiment 4 also appeared to cause excessive mortalities, either from the chemicals themselves of from the handling and manipulations that were inherently necessary. Excessive exposure periods were also considered somewhat cumbersome and impractical given that solutions would likely need to be renewed each day. A summary of the treatments that were applied is given in Table 5. Each treatment and the control were replicated four times, with two replicates housed in each of two separate raceways that were managed in similar ways. A detailed description of the improved rearing conditions used in this final experiment is given in Section 4.2
Table 5. Summary of spat marking treatments for Experiment 6. Each treatment was
replicated four times
Treatment name OTC conc. (mg L-1) Buffer
100 Bicarb 100 Bicarb
100 Tris 100 Tris
200 Bicarb 200 Bicarb
200 Tris 200 Tris
300 Bicarb 300 Bicarb
300 Tris 300 Tris
Control 0 0
Spat were obtained from QSS Ltd one week prior to commencement of the trial. During that acclimation week they were maintained in 20 µm filtered seawater with equal proportions of five species of microalgae, namely Isochrysis galbana,
Chaetoceros muelleri, Pavlova salina, Pavlova lutheri and Proteomonas sulcata at a final concentration of 30,000 cells mL−1. The water was constantly flowing at 750 mL min-1 and heated to a minimum of 21°C using four 300 W aquarium heaters per tank.
To best gauge the impact of the overall marking process, controls were not subjected to any of the handling stresses associated with chemical immersions, and were instead left in raceways and maintained without disturbance as described above for the acclimation week. A completely randomised design was applied to the distribution of scallops among screens, and to the arrangement of treatments in the immersion marking room.
Scallops were allowed to recover for one week in the raceways with flowing, microalgae-supplemented seawater, before mark assessment was performed using procedures described in Section 4.1.4. To apply a second shell mark this marking procedure was repeated 27 days after the first chemical immersion began. Scallops were subjected to the same treatments as they had initially undergone. The mark retention and survival of these double marked scallops were monitored over 64 days (detailed in Section 4.2). The effects of OTC concentration and buffer type on mark brightness, shell growth and survival were tested using ANOVA in the program GenStat (ed. 9, VSN International Ltd.).
4.2 Improving survival and growth of juvenile scallops in a land-based system
Presently, the commercial use for hatchery-reared scallops is focussed on a strategy which releases spat onto seabed leases when they reach 2-4 mm in shell height (around two months post-hatch). In this project, we have been required to grow scallops for a minimum of eight months to test mark longevity. Rearing methods were therefore developed and improved throughout the project to enable this evaluation of fluorescence longevity in marked shells, but the systems so developed may also be useful in future efforts where scallops may need to be reared for longer periods in land-based systems.
In an attempt to meet budgetary constraints that were placed on the project, initial methods used unfiltered seawater, prawn pond effluent, or a combination of these two water sources to rear the scallops. However, these methods were unsuccessful, and therefore more controlled though labour-intensive and costly systems were developed for Experiments 4 and 6. The aim was to facilitate higher long-term survival, as well as faster growth which more closely reflected conditions in the wild.
In all grow-out experiments, screens associated with treatments and controls were randomly arranged within the purpose built indoor raceway tanks (1840 mm long x 660 mm wide x 23 mm deep). These raceways were arranged under opaque roofing panels so as to provide natural light and daylength, and one layer of 90% shade cloth stretched over each raceway reduced the light inside to low to moderate levels (approx 270 lux at midday measured with a photometric sensor (LI-COR Inc., Nebraska, U.S.A.)). Given that very low light levels are expected to prevail in the scallop‟s natural habitat at 20 m depth, the low to moderate levels were considered a reasonable approximation that the scallops would become accustomed to, and which would also sufficiently challenge any light sensitivities of shell marks.
To reduce silt loads, as well as pathogen introduction, seawater was filtered through a 20 µm sand filter, then through 5 µm and 1 µm in-line cartridge filters. Water quality was monitored regularly throughout the growth of these scallops. Every weekday at around mid-day, pH, salinity and dissolved oxygen levels were recorded using a YSI 556 Multi Probe System (YSI Incorporated). Diurnal temperature range was also recorded using max/min thermometers. Three times per week, algal concentration was measured using a haemocytometer. Drip rate and water flow were subsequently measured and adjusted according to cell densities to maintain constant supply rates. Scallops were transferred to clean mesh screens in a clean tank every week. Used tanks and screens were scrubbed with fresh water, washed with a chlorine solution (100 ppm) and air dried for one week before being used again. Airlifts, algal supply lines and cartridge filters were also replaced and cleaned weekly.
Survival, mark brightness and shell height were evaluated at 7, 37, 82, 127, 180, 250 and 302 days after marking. Shell height measurements were initially performed using a stage micrometer, and when the scallops were larger than 6.5 mm, a background ruler was used. Mark assessments were performed as described in Section 4.1.4. Despite the specified tank hygiene practices and more labour intensive approach using cultured microalgae, the majority of scallops in Experiment 4 had died by 210 days post immersion mark, At that stage, surviving scallops were moved into a new tank system, where they were fed water and microalgae from other experiments using the modified main system described below.
A second round of rearing system improvements was then made to further improve survival and growth for Experiment 6. These system improvements were directed at managing risks which had been identified, improving the environment for healthier scallops, and changing several operational practices that were cumbersome and impractical. It was at this stage that a sand substrate was re-implemented to provide a more realistic simulation of the natural environment on the sea floor. The potential abrasion of shell material by sand had previously been suggested as a complication for the development of shell marking technologies. Its use had previously been removed from the rearing protocol due to long-term hygiene concerns, so this was addressed by weekly rotations of screens between sand beds that were flushed with freshwater and dried on a weekly basis. This prevented the buildup of significant sulphides in the beds, as well as significant populations of predatory or problematic organisms such as copepods and stalked ciliates.
Several other factors were addressed to improve the artificial rearing environment. These were:
2) Number of microalgae species. The number of species was increased from two to five, to include Isochrysis galbana, Chaetoceros muelleri, Pavlova salina, Pavlova lutheri and Proteomonas sulcata. This selection was based on the most amenable species to culture conditions that were available at the BIARC facilities, and was aimed at providing a more balanced nutritional profile.
3) Reliability of algal culture. Outdoor bag cultures were susceptible to daily light and temperature fluctuations, which resulted in unacceptably variable quality and quantity. To alleviate this problem, microalgae were instead produced at high concentration in the indoor microalgal lab at BIARC. These were equally combined and diluted in seawater to provide a final feeding concentration of 30,000 cells mL-1. Fresh batches of algal dilutions were made 3 times per week and this was continuously pumped into each of the scallop rearing tanks at 1.5 L min-1.
4) Variable water quality. The „batch‟ method of microalgae production and seawater mixing allowed us to incorporate much greater control over water qualitiy. Four tanks were used in rotation, each holding 5,000 L of seawater. A >24 hr period of settlement allowed for the heaviest of silt particles in the 20 µm filtered seawater to fall out of suspension and also allowed for the seawater quality to be inspected before being mixed with concentrated microalgae stocks and pumped through the scallop raceways. A back-up tank holding 40,000 L of settled seawater was available for use during extended periods of poor intake water quality.
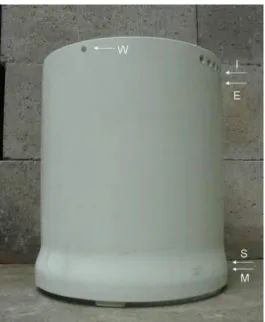
5) Screen Design
Figure 2. Mesh screens used in Experiment 6. Showing water supply hole (W) for 4 mm tubing, internal water height (I), external water height (E), sand level (S) and the level of the 2 mm mesh (M), which ran parallel to the floor of the tank to contain the scallops within the screen
In Experiment 6, scallops were grown without sand for the first week after marking for consistency with previous work, and then sand was added to the system. They were moved into a clean tank with clean screens weekly as in Experiment 4. Sand beds were cleaned by blasting with fresh water and mixing by hand to encourage the less dense material to rise to the surface, and then tanks were tilted and lightly sprayed with fresh water to wash off remaining debris. The tanks and sand were allowed to dry for 6 d before being refilled with seawater and microalgae 24 h before use to allow temperature to stabilise.
analysed in the same program using ANOVA. After the termination of the experiment at BIARC, scallops were transferred to QSS Ltd for ongoing monitoring of their collective growth, survival and mark retention.
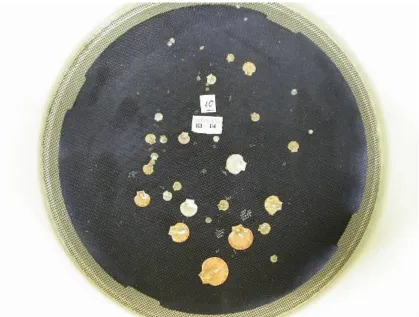
Figure 3. An image used to measure scallop shells on the base of screens
When half of the replicates in the experiment were terminated due to heater malfunction, the second tank was used to house „spare‟ scallops, which had been retained at high density in a different tank. These scallops were maintained in the same way as the other scallops in Experiment 6. When they were first introduced to the tank, the shells of these „spare‟ scallops were heavily fouled with stalked ciliates, and we observed the progress of these scallops over one month to examine the effect of the sand substrate on shell fouling.
4.3 Fluorescent shell marking of the pearl oyster Pinctada imbricata
The pearl oyster Pinctada imbricata was used to test marking methods and rearing facilities on an alternative bivalve. This species produces Akoya pearls and is currently being cultured commercially in Queensland on a small scale with potential for expanding into a major growth industry. Shell marking could be relevant in this species for identification of hatchery-reared stock for a variety of purposes including the tracking of animals through markets, identifying specific ownership in the event of illegally obtained stock, and generally in stock controls and management.
tanks with no sand for one week before marking commenced in July 2007. Oysters were photographed for size measurements using the procedure described for scallops in section 4.2 prior to chemical immersion. Printed images were measured using digital callipers, using the longest possible „diameter‟ to indicate shell height, and data was calibrated based on measurements of the ruler fragment in each image. Because the orientation of the oyster differed depending on the longest extension of the shell for measurement, the term „shell height‟ is not entirely appropriate, but will be used for consistency with scallop data and the lack of a better term.
Chemical exposures for this experiment were identical to those used in Experiment 6 (Section 4.1.6); OTC at 100, 200 or 300 mg L-1, each using bicarb or Tris to adjust/buffer pH, plus a control which did not undergo any chemical immersion or handling stress associated with chemical immersion. Each of the six experimental treatments plus the control group was replicated four times with 20 individuals per replicate. Equipment and procedures used for this marking were identical to those used in Experiment 6. After chemical immersion, oysters were placed in tanks with filtered (20 µm) seawater flowing at 750 mL min-1 supplied with five species of algae at 30,000 cells mL-1 as described in Section 4.1.6 for one week. After this period mortality and mark assessments were performed using the procedures described for scallops previously, and photographs were taken to monitor shell growth.
5. RESULTS AND DISCUSSION
5.1 Developing a shell marking system for hatchery reared saucer scallops
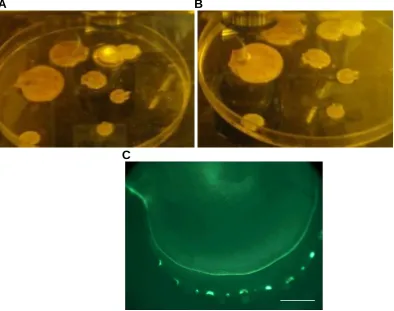
During the course of this study, live scallops were successfully labelled with marks that were identifiable several months later. Whilst an epifluorescence microscope was routinely used in this work, alternative sources of UV light were trialled with OTC marks because less expensive alternatives for mark detection will need to be developed for commercial application. A hand-held 4.5V UV torch with five LEDs was capable of detecting strong marks, however the light from the microscope was much more intense and capable of providing the necessary light to see marks without magnification of the field of view (Figure 4). It was also necessary for confidently detecting much weaker fluorescence.
A B
C
Figure 4. Observing marked scallops under UV light
Light was emitted from the 10X objective on the epifluorescence microscope. Observing scallops marked with 300 mg L-1 OTC on the microscope platform, through an orange plastic viewing shield used to safely inspect scallops and locate fluorescent marks. Shown are examples of very bright (A) and medium-bright (B) marks. (C) demonstrates the view of a 300 mg L-1 OTC-marked shell through the microscope (scale bar = 1mm).
A more cost-effective method for quickly, safely and reliably detecting marks should be relatively easy to develop in the future. Live marked scallops are currently with QSS Ltd for further development of broader scale mark detection and/or assessment techniques.
light generated by broad scale methods will be an important work place health and safety consideration in industrial applications.
5.1.1 Experiment 1 - Using OTC, calcein and alizarin red S to mark large and small juvenile scallops
Exposure to alizarin red S at 20 mg L-1 for four days resulted in 80 % mortality in both large and small scallops. Calcein at 50 mg L-1 and OTC at 500 mg L-1 were far more successful, resulting in only one fatality (a small specimen in the calcein treatment). Marking was successful in all treatments, with clear incorporation of all three chemicals into new shell growth, although the relative brightness of these marks was not quantified.
5.1.2 Experiment 2 - Testing 2 concentrations of OTC, calcein and alizarin red S using 5 mm spat
After two days of treatment with different chemicals and seven days on-growing in sand-filtered seawater, most scallops showed clear marks very close to the edge of the shells. New unmarked shell was observed outside the marks, which represented seven days of post marking growth. Figure 5 shows comparative images of scallops marked with the different chemicals. Except for the eyespots at the edge of mantles, and the hinge area of the shell, which were auto-fluorescent, no fluorescence was detected on the shells in any of the control specimens, making detection of marked individuals a straight-forward process.
Figure 5. Marks produced in the shells of Amusium balloti spat using each chemical; calcein at 50 mg L-1 (A and B), alizarin red S at 20 mg L-1 (C and D) and OTC at 750 mg L-1 (E and F). Scallops were treated for 48 h, and then on-grown for 7 d. Specimens were observed and photos were taken under an epiflorescent microscope with specific light filters for each dye, and added natural light for A, C and E to show shell growth incorporating marks (a), and post-mark shell growth (b). Scale bars = 200 µm
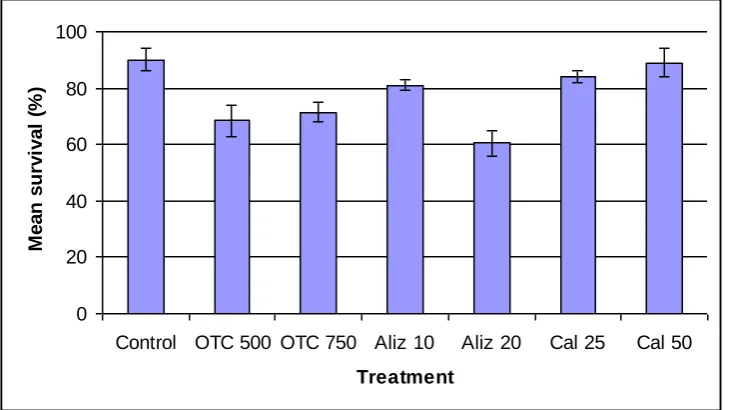
In all cases including the control, some mortality occurred during the week following immersion marking. Most treatments suffered somewhat higher mortalities than the control (Figure 7), although the low replication prevented thorough comparisons in this regard. Nevertheless, it was apparent that the highest alizarin red S concentration (20 mg L-1) caused the highest mortalities in the experiment. As in Experiment 1, the level of mortality for this chemical and concentration was unacceptable. This certainly justified the testing of alizarin red S at the lower 10 mg L-1 concentration, but the practical significance of the lower level of mortality that resulted from that treatment was countered by its substantially lower marking success.
A B
C D
Unfortunately, one month after moving these marked animals into the raceway system, complete mortality was realised. Water quality data that had been collected on a weekly basis from the raceway could not identify causative conditions for this loss, although concerns were raised about the suitability of the culture system and possible improvements that could be made to reduce the attrition that was occurring (discussed later in Section 4.2). Although all animals had died, the chemical marks were still detectable on the marked shells.
0 20 40 60 80 100
Control OTC 500 OTC 750 Aliz 10 Aliz 20 Cal 25 Cal 50
Treatment M e a n m a rk s uc c e s s ( % )
Figure 6. Mean percentage of scallops (n = 2, ± s.e.) that were successfully marked in
Experiment 2, seven days after treatment. Note: Identical scores in both replicates
resulted in no error bar for most treatments
0 20 40 60 80 100
Control OTC 500 OTC 750 Aliz 10 Aliz 20 Cal 25 Cal 50
Treatment M e a n s urv iv a l (% )
Figure 7. Mean percentage survival of scallops in different treatments (n = 2, ± s.e.) in
Experiment 2, seven days after treatment
5.1.3 Experiment 3 - Double-cross marking with OTC and calcein
still alive. Most mortality occurred in the 4-6 mm calcein treatments (four died), as well as one individual from each size class of OTC treatment (Table 6). Due to the low numbers in this experiment, this data was used as a guide only.
Figure 8. Scallop spat double-marked with calcein, then OTC. Viewed under
epifluorescent microscope with a DM510 filter for calcein detection (A) or a DM455 filter for OTC (B). Arrows indicate autofluorescence from retracted mantle and eyespots. Scale bars = 200 µm
Figure 9. Scallop spat double-marked with OTC and then calcein. Viewed under
epifluorescent microscope with a DM510 filter for calcein detection (A) or a DM455 filter for OTC (B). Arrows indicate autofluorescence from eyespots. Scale bars = 200 m
Table 6. Experimental design and survival from Experiment 3
Chemicals used in
Experiment 1 OTC Calcein Control
Chemical used in
Experiment 3 Calcein OTC Calcein OTC
Size (mm) 4-6 14-25 4-6 14-25 14-25
Number alive at start of
Experiment 3 8 5 7 5 12 12
Number alive at end of
Experiment 3 4 5 6 4 12 12
Percentage surviving
50 % 100 % 86 % 80 % 100 % 100 %
5.1.4 Experiment 4 - Marking spat using OTC and calcein with various concentrations and exposure times
Mark brightness scores were particularly consistent within treatments tested in this expanded fourth experiment. Since particular attention was paid to the randomised blind testing of treatments, these results can be considered robust in their assessments of these seven treatments. All concentrations of calcein resulted in lower mark brightness than the OTC treatments (Figure 10). Survival associated with calcein treatments was comparable to that of controls, whereas all OTC
A B
treatments caused unacceptably high mortalities, especially in the seven day exposures (Figure 11).
0 0.5 1 1.5 2 2.5 3 3.5 4 4.5 5 2d Cal-50 7d Cal-10 7d Cal-20 2d OTC 500 2d OTC-750 7d OTC-250 Control Treatment M e a n bri gh tne s s s c ore ( 0 -5 )
Figure 10. Mean (n = 2, ± s.e) assigned mark brightness of scallops 1 week after
marking treatments in Experiment 4
0 20 40 60 80 100 2-Cal-50 7-Cal-10 7-Cal-20 2-OTC-500 2-OTC-750 7-OTC-250 7-OTC-500 Control Treatment M e a n s urv iv a l (% )
Figure 11. Mean (n=2, ± s.e) survival of scallops 1 week after marking treatments in
Experiment 4
5.1.5 Experiment 5 - Testing Tris and bicarb to stabilise pH during OTC exposure
Using bicarb as a buffer
6 6.2 6.4 6.6 6.8 7 7.2 7.4 7.6 7.8 8
0 10 20 30 40 50
Bicarb concentration (g/L)
pH
Figure 12. Adjusting pH using bicarb in 250 mL seawater with 300 mg L-1 OTC
When a large amount of bicarb was added in an attempt to reach pH 8 (close to an assumed optimal seawater pH), the resultant pH after 24 h of overnight aeration was excessive at 9.4. An optimal level was identified in the order of 1.14 g L-1 bicarb, which after 16 h gave an approximate pH of 8 - 8.2 in 100, 200 and 300 mg L-1 OTC (Figure 13).
6 6.5 7 7.5 8 8.5
T = 0 + 15 mg
+ 45 mg
+75 mg
+135 mg
+285 mg
+16 h +24 h
Treatment
pH
300 200
100
Figure 13.The effect of bicarb, then time on pH of OTC solutions. The legend indicates
OTC concentrations in mg L-1. Note bicarb quantities along the x-axis are cumulative masses progressively added to 250 mL of seawater, which should be multiplied by four for
concentration in mg L-1
Using Tris as a buffer
6 6.5 7 7.5 8 8.5
+ OTC + Tris + 16 h
Treatment
pH
300
200 100
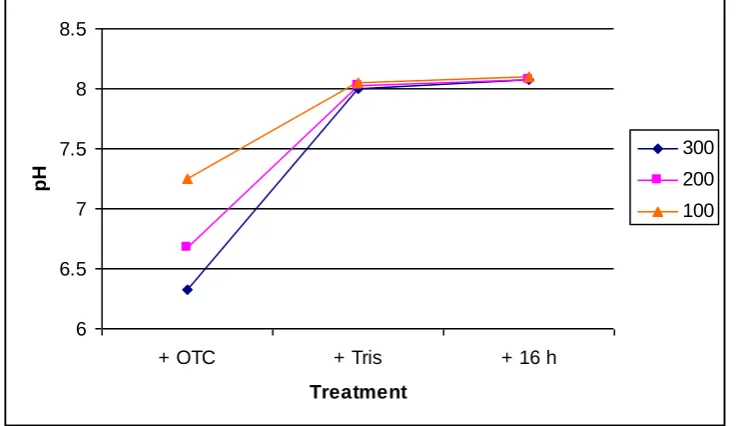
Figure 14. The effect of Tris and then time on OTC solutions. Tris was added at 0.6 times the concentration of OTC. The legend shows OTC concentration in mg L−1
As OTC solutions aged their pH increased. This effect was buffered by Tris, thereby preventing such change over time, whereas the effect of bicarb was to provide an immediate adjustment but no such longer-term stability (Figure 15).
6 6.5 7 7.5 8 8.5 9
0 10 20 30
Time (h)
pH
OTC + Tris OTC + Bicarb
OTC only
Seawater
Figure 15. Comparing Tris and bicarb as buffers for OTC at 300 mg L-1 over 24 h. Using un-buffered OTC at 300 mg L-1 and plain seawater as controls
The effect of buffer and pH on precipitation
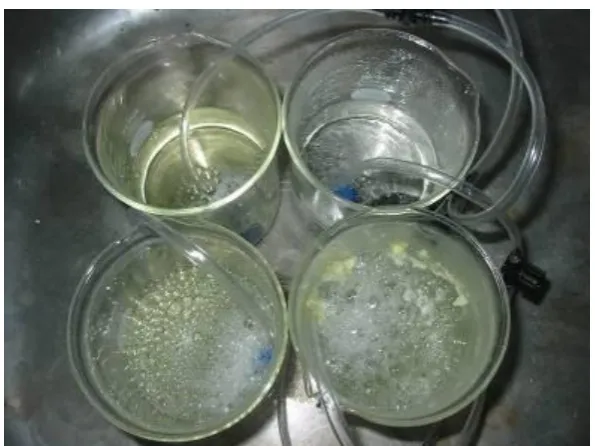
Figure 16. Froth in four solutions after 17 h aeration. Clockwise from top left: 300 mg L -1 OTC (no buffer), seawater, 300 mg L-1 OTC plus 600 mg L-1 bicarb, 300 mg L-1 OTC plus
180 mg L-1 Tris buffer
After 17 h of aeration, the highest precipitation was found in the bicarb-buffered solution (Figure 17). This was also the solution with the highest pH (see Figure 15), which may explain the extra precipitation. It was noted that when bicarb was initially added (and pH was lower), precipitation was not evident, however as the solution aged and pH increased, precipitation became evident. In Tris-buffered solution, a small amount of precipitation was evident throughout the duration of the trial, matching the stable moderate pH of the Tris-buffered solution.
5.1.6 Experiment 6 - Double-marking spat using OTC at three concentrations and buffered with Tris or bicarb
The more robust factorial design of this sixth experiment permitted more rigorous analyses for the effect on scallop survival and brightness of marks of the range of concentrations and buffers tested. The longer term effects of treatments on growth and survival are presented with other mark longevity data in Sections 5.2 and 5.3.
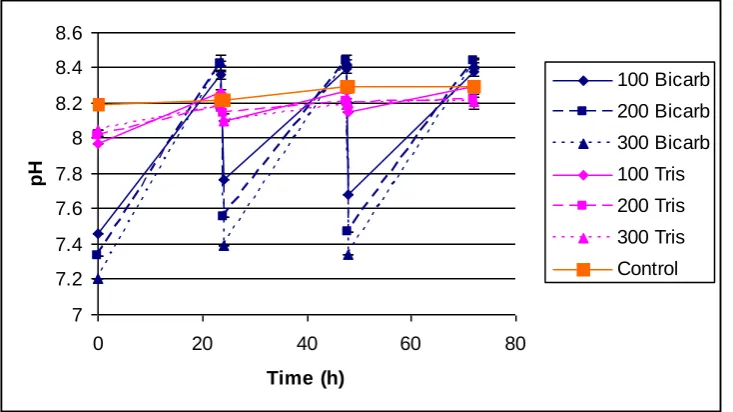
The three day chemical immersion procedure incorporating solution replacement each day resulted in rapid and substantial shifts in pH in the bicarb-buffered treatments, whilst the Tris-buffered treatments maintained a comparatively steady pH that was similar to the seawater controls (Figure 18). Despite these changes in pH in some treatments, survival was high in all experimental units and no significant differences (P > 0.05) were detected between treatments and the control (Figure 19). Precipitation and frothing appeared to increase with OTC concentration and higher pH in both Tris and bicarb treatments, however it did not appear to present a problem in any of the treatments.
7 7.2 7.4 7.6 7.8 8 8.2 8.4 8.6
0 20 40 60 80
Time (h)
pH
100 Bicarb 200 Bicarb
300 Bicarb 100 Tris
200 Tris
300 Tris Control
0 10 20 30 40 50 60 70 80 90 100
100 Bicarb
100 Tris 200 Bicarb
200 Tris 300 Bicarb
300 Tris Control
Treatment
M
e
a
n
s
urv
iv
a
l
(%
)
Figure 19. Mean survival (n = 4, ± s.e.) of scallops one week after treatment in
Experiment 6
Although buffer type did contribute to a significant interaction between treatments, overall, mark brightness scores were equally rated in both bicarb and Tris treatments. There was however an observed difference in the quality of marks. Bicarb sometimes resulted in „banding‟ patterns on the surface of shells as well as mark incorporation into new shell growth, whereas Tris-buffered treatments resulted in a single band only where new shell growth had occurred (Figure 20).
Figure 20. Marked scallop shells using OTC with bicarb (left) or Tris (right). Both
images were captured using x 40 magnification on an epifluorescent microscope using a DM455 filter (Nikon). The bracket indicates new growth without fluorescence, deposited after chemical immersion
Figure 21. Detailed view of single marks generated by 300 mg L-1 OTC with Tris
buffer. Both images were captured using x 100 magnification on an epifluorescent
microscope using a DM455 filter (Nikon)
0 0.5 1 1.5 2 2.5 3 3.5
100 Bicarb
100 Tris 200 Bicarb
200 Tris 300 Bicarb
300 Tris Control
Treatment
M
a
rk
bri
gh
tne
s
s
s
c
ore
(
0
-5
)
Figure 22. Mean (n = 4, ± s.e) mark brightness scores from Experiment 6 one week
after treatment. Treatment labels along x-axis indicate OTC concentration in mg L-1 and buffer type used
0 10 20 30 40 50 60 70 80 90 100 100 Bicarb
100 Tris 200 Bicarb
200 Tris 300 Bicarb
300 Tris Control
Treatment M e a n s urv iv a l (% )
Figure 23. Mean (n = 2, ± s.e.) survival 1 week after chemical treatment for mark 2 in
Experiment 6
Brightness scores for this second mark (Figure 24) had a similar pattern of results to those detected for the first mark (shown in Figure 22 above). Buffer type again did not greatly impact on mark brightness or survival, and the mark brightness was again lower in the 100 mg L-1 treatments than in the other higher OTC concentrations.
0 0.5 1 1.5 2 2.5 3 3.5 100 Bicarb
100 Tris 200 Bicarb
200 Tris 300 Bicarb
300 Tris Control
Treatment M a rk bri gh tne s s s c ore ( 0 -5 )
Figure 24. Mean (n = 2, ± s.e.) mark brightness scores for the second mark in Experiment 6, 7 d after treatment
Table 7. Table of mean mark brightness scores from Experiment 6 showing
interaction between buffer, OTC concentration and assessment date. Cells with
matching letters (in superscript) are not significantly different (P > 0.05)
OTC concentration
100 mg L−1 200 mg L−1 300 mg L−1
Assessment Date
pH adjuster Bicarb Tris Bicarb Tris Bicarb Tris
1 1.663a 1.840ab 3.070d 2.638c 2.931cd 2.949cd
2 2.127b 2.002ab 2.880cd 3.155d 2.809cd 3.256d
3 2.630c 2.084b 3.440de 3.771e 2.946cd 3.787e
In order to assess the overall effect of buffer type and OTC concentration without the potentially complicating effects of different assessment dates, the data from different dates were pooled together. When this was done there was a significant interaction effect between OTC concentration and mark number (mark 1 or mark 2 from the first and second chemical immersions, respectively). This data is shown in Table 8. In both marks the 100 mg L−1 treatment resulted in significantly lower mark brightness than the other concentrations. In mark 1, there was no difference between 200 and 300 mg L-1 OTC, whereas for mark 2, 200 mg L-1 OTC resulted in significantly higher brightness than 300 mg L-1 OTC. This could be explained by lower toxicity and resultant faster growth during the medium-concentration treatment, which could result in greater overall uptake of fluorescence into the calcium carbonate shell matrix.
Table 8. Table of mean mark brightness scores from Experiment 6 showing
interaction between OTC concentration and mark number. Cells with matching letters
(in superscript) are not significantly different (P > 0.05). Note that different LSD values are used within and between columns
Mark Number
OTC Concentration Mark 1 Mark 2
100 mg L−1 1.730c 2.713a
200 mg L−1 3.025de 3.426bf
300 mg L−1 3.148dfg 3.043aeg
5.2 Improving survival and growth of juvenile scallops in a land-based system
Survival of scallops in experimental systems
The initial attempts to grow saucer scallops of various sizes using prawn pond effluent were unsuccessful; resulting in 100 % mortality after several days is three separate trials (no data collected). Efforts in this regard also included providing a blend of pond water and unfiltered seawater so that algal densities we much reduced. However the variable nature of pond phytoplankton blooms and variable levels of silt which periodically occurred in the unfiltered seawater supplies at that time caused a series of uncontrolled events which made this style of watering system fraught with unmanageable and compounding risks.
0 10 20 30 40 50 60 70 80 90 100
0 100 200 300
Days post-treatment M e a n s urv iv a l (% ) 2-Cal-50 7-Cal-10 7-Cal-20 2-OTC-500 2-OTC-750 7-OTC-250 7-OTC-500 Control
Figure 25. Mean survival (± s.e) of treatments from Experiment 4. At the beginning of
the experiment there were two replicates per treatment, each containing 60 individuals. The legend shows abbreviations for treatments, indicating the length of chemical immersion, then the marking chemical used (calcein or OTC), then the concentration in mg L-1
0 20 40 60 80 100
0 20 40 60 80
Days post-treatment M e a n s urv iv a l (%
) 100 Bicarb
100 Tris 200 Bicarb 200 Tris 300 Bicarb 300 Tris Control
Figure 26. Mean survival (± s.e.) of treatments from Experiment 6
0 20 40 60 80 100
0 50 100 150
Days post-treatment M e a n s urv iv a l (% )
Control Exp. 6
Treatment Exp. 6 Control Exp. 4
Treatment Exp. 4
Figure 27. Average (± s.e.) survival of combined treatments (All Exp.) and control groups (Cont. Exp.) between Experiments 4 and 6
Growth rate
Using the microalgae drip-feeding system in Experiment 4, growth rates were slow throughout the experiment. A modest improvement in growth rate was evident towards the end of the experiment (see Figure 28). Although the systems changes made on day 210 were the most obvious causative factors for this, several other factors such as greatly reduced densities, water temperature and selection for the healthiest individuals were also likely to have played a part.
0 5 10 15 20 25
0 100 200 300 400
Days post-treatment M e a n s he ll he igh t (m m ) 2d Cal-50 7d Cal-10 7d Cal-20
2d OTC 500
2d OTC-750 7d OTC-250
Control
Figure 28. Mean (± s.e.) shell growth of scallops in Experiment 4. Note that the rearing
In Experiment 6, the design improvements made to the raceway system again appeared to facilitate faster growth rates, together with improved survival (discussed
above). Figure 29 provides the growth data for scallops in this final experiment. When ANOVA was performed on this growth data with initial size as a co-variate, we
2.5 3.5 4.5 5.5 6.5 7.5
0 20 40 60 80
Days post-treatment M e a n s he ll he igh t (m m ) 100 Bicarb 100 Tris 200 Bicarb 200 Tris 300 Bicarb 300 Tris Control
Figure 29. Mean (± s.e.) shell growth of scallops in Experiment 6. The legend describes the treatments, indicating OTC concentration in mg L-1 and the buffer used
Table 9. Table of mean growth (mm) from Experiment 6 showing interaction between OTC concentration and buffer. Cells with matching letters (in superscript) are not significantly different (P > 0.05)
OTC concentration Buffer
Bicarb Tris
100 mg L-1
200 mg L-1
200 mg L-1
3.162ab 2.680ab
2.535a 3.343b
3.148ab 2.594ab
0 1 2 3 4 5 6 7 8 9 10
0 50 100 150
Days post-treatment
M
e
a
n
s
he
ll
he
igh
t
(m
m
)
Control Exp. 6
Treament Exp. 6 Control Exp. 4
Treament Exp. 4
Figure 30. Comparisons between the average (± s.e.) growth of combined treatments (All Exp.) and control (Cont. Exp.) groups between Experiments 4 and 6
Figure 31. Comparing seabeds after one week of use with (left) or without scallops.
Does sand improve scallop health?
While the first stage of Experiment 6 was in progress, excess scallops were kept in a spare tank without sand, supplied with water which overflowed from the experimental tanks. These scallops were not regularly maintained and were kept at high density. Some of these scallops became overgrown with stalked protozoans from the family Ciliophora, class Oligohymenophora, subclass Peritricha (Ruppert and Barnes, 1994). Although positive identification was not achieved, they were similar in appearance to the common crustacean parasite Epistylis sp (Hudson and Lester, 1994). These epibionts have been described previously on the shells of molluscs (Dias et al., 2006). Although they are not usually directly harmful to the host, they can cause stress and other problems for the host when at high density (Puckett and Carman, 2002). Observations under light microscope indicate that scallops that were heavily fouled by these ciliates were sluggish in their movement and usually had retracted mantles, indicating poor general health. Figure 32 shows the typical sand covered habit of a healthy feeding scallop and one that is covered in stalked ciliates that appears to be in a non-feeding state where the outer margins of the shell are not exposed.
Figure 32. A healthy scallop covered in sand (top) and below it, a scallop covered in stalked ciliates