A novel and effective technology for mitigating nitrous
oxide emissions from land-applied manures
Jaye Hill
A, Matthew Redding
Aand Chris Pratt
A,BADepartment of Agriculture and Fisheries, 203 Tor Street, Toowoomba, Qld 4350, Australia.
BCorresponding author. Email: [email protected]
Abstract. Land-applied manures produce nitrous oxide (N2O), a greenhouse gas (GHG). Land application can also
result in ammonia (NH3) volatilisation, leading to indirect N2O emissions. Here, we summarise a glasshouse investigation
into the potential for vermiculite, a clay with a high cation exchange capacity, to decrease N2O emissions from livestock
manures (beef, pig, broiler, layer), as well as urea, applied to soils. Our hypothesis is that clays adsorb ammonium, thereby suppressing NH3volatilisation and slowing N2O emission processes. We previously demonstrated the ability of clays to
decrease emissions at the laboratory scale. In this glasshouse work, manure and urea application rates varied between 50 and 150 kg nitrogen (N)/ha. Clay : manure ratios ranged from 1 : 10 to 1 : 1 (dry weight basis). In the 1-year trial, the above-mentioned N sources were incorporated with vermiculite in 1 L pots containing Sodosol and Ferrosol growing a model pasture (Pennisetum clandestinumor kikuyu grass). Gas emissions were measured periodically by placing the pots in gas-tight bags connected to real-time continuous gas analysers. The vermiculite achieved significant (P0.05) and substantial decreases in N2O emissions across all N sources (70% on average). We are currently testing the technology at thefield
scale; which is showing promising emission decreases (~50%) as well as increases (~20%) in dry matter yields. This technology clearly has merit as an effective GHG mitigation strategy, with potential associated agronomic benefits, although it needs to be verified by a cost–benefit analysis.
Additional keywords: agriculture, greenhouse gas mitigation, manure management, nitrogen, vermiculite.
Received 31 August 2015, accepted 6 November 2015, published online 9 February 2016
Introduction
Agriculture is a major emitter of nitrous oxide (N2O), which is a
potent greenhouse gas (GHG) and ozone-degrader (Ravishankara et al.2009). On farms, manure and fertiliser application to soil is the predominant N2O emission source (Bouwman1996; Mosier et al.1998).
There is strong demand for technology-based solutions to mitigate these agricultural N2O emissions (Snyderet al.2014),
given the recent mounting pressure to include food-derived GHG emissions into similar regulation frameworks that exist to manage energy emissions (McMichael et al. 2007; Koneswaran and Nierenberg2008; Cederberget al.2013). Several studies have focussed on inhibitor-based technologies to supress N2O and
ammonia (NH3, which leads to indirect N2O formation)
emissions from fertilised landscapes. Inhibitors tested include urease inhibitors, such as N-(n-butyl) thiophosphoric triamide, and nitrification inhibitors, including dicyandiamide (DCD). These compounds have achieved substantial decreases (>50%) in both N2O emission (McTaggartet al.1997) and NH3(Saggar et al.2013) volatilisation. However, concerns have been raised over the persistent effects of these complex chemicals in agronomic systems. For example, Krogmeier et al. (1989) reported that N-(n-butyl) thiophosphoric triamide can result in leaf-tip necrosis in plants. Moreover, with continually improving
detection limits, several recent studies have detected DCD in dairy cattle milk produced for human consumption (Danaher and Jordan2013; Inoueet al.2014; Linet al.2015). The modes of transport of DCD into milk are not yet fully established, although a recent study by Palet al. (2015) demonstrated that foliar and root absorption could represent a significant source of contamination on pastures.
Instead of using chemical inhibitors, with their associated persistence and contamination risks, the use of naturally occurring minerals with high cation exchange capacity (CEC) could offer a lower-risk approach towards mitigating land-applied fertiliser and manure emissions. The theory underpinning this concept was pioneered by Zamanet al.(2007) who showed that high-CEC zeolites can be used to slow the kinetics of NH3volatilisation
and nitrogen (N) mineralisation, thereby decreasing the overall rate of N2O production. These authors documented a 30–40%
decrease in N2O emissions from urea and dairy cattle urine
applied to volcanic and organic wetland soils amended with zeolite.
Clay minerals of the phyllosilicate class also possess high CECs. Clays are far more abundant and ubiquitously distributed than are zeolites and their plate structure might help avoid clogging problems that can arise in the 3-D porous structure of zeolites (Mumpton and Fishman 1977). The ability of clays http://dx.doi.org/10.1071/AN15519
to decrease N2O emissions from land-applied fertilisers is,
therefore, novel and merits testing.
In earlier laboratory-scale research, we observed N2O and
NH3emission decreases of up to 90% from soils amended with
pig litter and high-CEC clays (vermiculite and bentonite; Pratt et al.2015b). We also observed similar results for other livestock manures at a laboratory scale (Prattet al.2016). Here, we build on the outcomes from our early laboratory-scale research by investigating the potential for a high-CEC clay, vermiculite, to decrease NH3and N2O emissions from manure-amended soils
at the glasshouse scale. This glasshouse trial involves several key aspects that were not assessed in our preliminary laboratory research, including (1) testing across two different soil types, (2) evaluation of emission responses across different N addition rates, (3) the use of conventional chemical fertilisers, as well as manures and (4) the incorporation of a model plant in the amendments. We envisage that the outcomes will help deliver a workable technology to mitigate on-farm emissions and help farmers cope with emerging challenges of food production.
Materials and methods
Manure collection and preparation
We targeted manures from a range of Australia intensive livestock industries, i.e. beef feedlot pen surface, fresh piggery litter, broiler poultry litter and fresh poultry layer manure. Specific details of farms accessed and manure collection are given in earlier published work (Prattet al.2015a).
Soil and vermiculite collection and preparation
The vermiculite (Mg+2, Fe+2, Fe+3)3[(AlSi)4O10]*(OH)2*4H2O) was a commercially available product (Brunnings, Melbourne, Vic., Australia), which we ground to a coarse powder (<1 mm) with a RETSCH SK100 grinder (Germany).
Approximately 100 kg of a sandy Sodosol was collected from an undisturbed pasture in Warwick, ~170 km south-west of Brisbane (Australia). The site has a history of livestock grazing, but has been undisturbed for the past decade. Approximately 100 kg of a Ferrosol was collected from an undisturbed pasture in Toowoomba, 120 km west of Brisbane. The site has no history of agricultural activity.
Both soils were collected to a depth of ~10 cm by using a front-loader excavator. Coarse debris was removed from the soils with a purpose-built, suspended sieve (2 mm aperture, 1 m diameter) with a mechanical agitator. The soil moisture contents were measured by oven-drying and then brought up to 20% and 42% gravimetric water content (dry weight basis) for the Sodosol and Ferrosol, respectively, which from our earlier work on these soils had been shown to be favourable for GHG emissions (data not shown).
Glasshouse pot set-up
In total, 240 · 1 L pots were established in a temperature-controlled (25C) glasshouse. A total of 120 pots each received 1500 g of sievedfield-moist Sodosol (oven dry equivalent:<2 mm). The remaining 120 pots received 900 g (oven dry equivalent weight) offield-moist Ferrosol. Approximately 10 g of kikuyu grass (Pennisetum clandestinum) seeds were sprinkled onto the surface of each soil and pressed gently into the soil to promote
germination. The soils were watered and the seeds were left to germinate for several weeks until the pots were well established with kikuyu seedlings (30 individual plants per pot). Nutrient additions (expect N) were made to achieve optimum plant.
Manure and vermiculite incubation
Prior to incorporating the manures and vermiculite into the pasture-covered Sodosol and Ferrosol pots, we incubated them at saturation for 5 days, according to the procedure outlined by Redding (2011), so as to expedite contact between the vermiculite sorption sites and the ammonium (NH4+) in the
manures. The incubations were performed in sealed vessels
fitted with an outlet gas line directed into a 40 mL water trap to prevent vessel explosion resulting from carbon dioxide pressure build-up and to capture any dissolved NH4+ and
nitrous oxide (N2O). Following incubation, water from each
trap was poured back into each treatment and both the water content used to saturate the incubations and the water from the traps were factored into final soil moisture calculations. We monitored ammonia (NH3) and N2O emissions from the
incubation water traps by using the continuous gas analysers. Emissions of both gases were at background levels (20 mg/L for NH3and 330mg/L for N2O), which indicated negligible N
gaseous loss from the manures during incubation (full details of the gas analysis system are presented in the following section). Five vermiculite rates were mixed with the manures (0, 0.7, 1.5, 3 and 7.4 meq CEC/meq NH4+-N in the manure). We also
incubated vermiculite with an inorganic fertiliser source, urea (refer to Table1for amounts). The selected vermiculite contents corresponded to very low clay : soil volume ratios (max 5%), thereby minimising the physical effects of clay on emission responses. The vermiculite additions corresponded to an application equivalent of 0.27–7 t/ha across the treatments. The manure and urea quantities were chosen to represent a N loading rate of 150 kg N/ha and 50 kg N/ha in our pots, which covers a range of typical N addition rates to agricultural soils (Gregorich et al. 2014; Shcherbak et al. 2014). The combinations of manures and vermiculite incubations are shown in Table1.
Each of the incubation combinations shown in Table1was applied in duplicate to the Sodosol and Ferrosol soils (total = 200).
Table 1. Quantities of manures, urea and vermiculite used
Nitrogen (N) source Vermiculite addition (g)
(dry weights) Level 0 Level 1 Level 2 Level 3 Level 4
150 kg N/ha
Beef: 5.45 g 0 0.8 1.6 3.2 8.0
Pig: 11.9 g 0 0.8 1.6 3.2 8.0
Poultry: 4.15 g 0 0.8 1.6 3.2 8.0
Egg: 2.72 g 0 0.8 1.6 3.2 8.0
Urea: 0.36 g 0 0.8 1.6 3.2 8.0
50 kg N/ha
Beef: 1.82 g 0 0.27 0.5 1.0 2.7
Pig: 3.98 g 0 0.27 0.5 1.0 2.7
Poultry: 1.38 g 0 0.27 0.5 1.0 2.7
Egg: 0.91 g 0 0.27 0.5 1.0 2.7
The remaining 20 Sodosol pots and 20 Ferrosol pots had no manure additions, providing an experimental control.
A layer of the manure and vermiculite treatment was placed on the soil surface. So as to decrease volatilisation losses, additional soil was placed in a layer over the treatment material, namely, a further 170 g of soil for the Sodosol pots and 94 g for the Ferrosol pots. This ‘sandwiching’ of manure in the top few centimetres of the soil profile simulated subsurface manure incorporation techniques commonly applied to agricultural landscapes (Natvig et al. 2002; Dell et al. 2012) The 40 remaining baseline control pots (20 containing Sodosol and 20 containing Ferrosol) were topped up with the same covering amount of soil as for the other pots. The soils in all Sodosol and Ferrosol pots were brought up to 20% and 42% gravimetric water content (dry weight basis), respectively.
The bulk densities of each treatment are shown in Table2. The pots were arranged in a row–column design throughout the glasshouse. The two different soils formed two randomised row–column blocks in the glasshouse.
Gas measurements
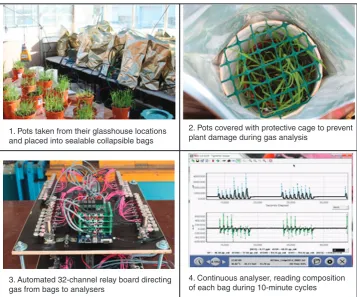
The gas analysis system used in our study was adapted from Reddinget al.(2016). It comprised an automated 32-channel gas manifold, with inlets connected to collapsible bags in which the pots were placed during gas analysis. Due to limited positions (32) on the manifold, we targeted pots with vermiculite addition rates 0, 2 and 4 (refer to Table1for details). A visual snapshot of the gas analysis set-up is shown in Fig.1.
We analysed emissions from one soil type at a time. The pots were taken from their glasshouse places and placed into the bags for 2-day continuous measurement periods. After 2 days, the pots were removed from their bags and returned to their glasshouse positions, while the pots comprising the other soil type were analysed. The duplicate pots were placed together in each bag. One empty bag was used as a blank to obtain baseline concentrations. Two 4 mm push-fit ports were fitted into the
bags. One was open to the atmosphere, while the other was connected to a solenoid valve on a 32-channel switching gas manifold. These valves linked into a central gas line, which was connected to a mass flow controller coupled with a vacuum pump. When bags were not being sampled for their gas concentrations, the valves were sealed. During sampling, ambient air from the glasshouse was swept through a bag and directed to a Los Gatos (CA, USA) isotopic N2O analyser (N2O)
and a cavity ring-down spectroscopy NH3 analyser (Picarro,
CA, USA). Both analysers take continuous measurements, with data logged every 20 s for the Los Gatos instruments and every second for the Picarro analyser.
Gas fluxes were calculated by integrating the average concentrations measured in the bags with the gas sweepflow rate (3.5 L/min) and the sweep time (10 min). Volumetricfluxes were converted to massfluxes by applying the ideal gas law to concentration data. We concluded the gas analyses after 2 months, when emissions from the pots had largely ceased. We were able to collect 22 gas measurement readings for each treatment. We achieved 98% recovery of an N2O standard
injected through the gas measurement system, indicating that the method was accurate.
Pot maintenance and plant harvesting
The pots were watered (deionised water) three times weekly to maintain the soils at their starting moisture contents (determined by weighing). The shoots were harvested from all pots approximately monthly and the dry (65C) weights from each cut recorded. As only one nutrient application was made (equivalent to 50 and 150 kg/ha) during the 10 month growing period, harvests continued as pots became N deficient. Ten cuts were completed during the trial.
Physicochemical analyses
Moisture contents were determined by oven-drying the manure and soil overnight at 60C and 105C, respectively, and recording
Table 2. Bulk densities (g/cm3) of the various treatments N, nitrogen
Treatment Level 0 vermiculite
addition
Level 1 vermiculite addition
Level 2 vermiculite addition
Level 3 vermiculite addition
Level 4 vermiculite addition
Sodosol Ferrosol Sodosol Ferrosol Sodosol Ferrosol Sodosol Ferrosol Sodosol Ferrosol
150 kg N/ha
Soil only 1.67 1.0 n.a. n.a. n.a. n.a. n.a. n.a. n.a. n.a.
Beef manure 1.67 1.0 1.66 1.0 1.66 1.0 1.66 1.0 1.65 0.99
Pig litter 1.63 0.98 1.63 0.98 1.63 0.98 1.63 0.98 1.62 0.98
Poultry litter 1.66 1.0 1.66 1.0 1.66 1.0 1.66 1.0 1.64 1.0
Egg manure 1.67 1.0 1.67 1.0 1.66 1.0 1.66 1.0 1.66 1.0
Urea 1.67 1.0 1.67 1.0 1.67 1.0 1.66 1.0 1.65 1.0
50 kg N/ha
Soil only As for 150 kg N/ha
Beef manure 1.67 1.0 1.67 1.0 1.67 1.0 1.67 1.0 1.67 1.0
Pig litter 1.67 1.0 1.67 1.0 1.67 1.0 1.67 1.0 1.67 1.0
Poultry litter 1.67 1.0 1.67 1.0 1.67 1.0 1.67 1.0 1.67 1.0
Egg manure 1.67 1.0 1.67 1.0 1.67 1.0 1.67 1.0 1.67 1.0
weight loss. The pH for the manures and the soil was measured using a pH meter, following a solid : water (1 : 5) extraction. Total (Dumas) N was analysed using a Leco analyser (NSW, Australia) following the Dumas dry combustion principle where samples are combusted at 1050C. This method has been well described in previous work (Buckee1994).
Organic C was quantified colourimetrically after digestion with H2SO4and K2Cr2O7(El-Mashad and Zhang2010). For the
soil, NH4+-N was analysed following extraction with 2 M KCl
(1 : 10 manure : water ratio) and measured colourimetrically using atomic adsorption spectrophotometry. Nitrate+nitrite-N was determined via the same procedure but with addition of Devarda’s alloy to determine total mineral-N, and nitrate+nitrite-N calculated by subtraction of nitrate+nitrite-NH4+-N. For the manures, tannin
contamination affected the atomic adsorption spectrophotometry method, so these extracts were analysed for their NH4+-N and
NO3–+NO2–-N concentrations by titration, using 0.01 M HCl
following steam distillation using MgO.
The particle-size distribution of the Sodosol was measured using a gravimetric hydrometer. The CEC of the vermiculite and bentonite was measured using the unbuffered NH4Cl extraction
method by Sumner and Miller (1996). The key parameters are shown in Table 3. All manure, soil and clay samples were analysed in triplicate.
Statistical analyses
ANOVA was performed on log-normalised (due to skewness) cumulative N2O emissions from each measured pot (vermiculite
level additions 0, 2 and 4) to determine significance (P0.05) for differences in emissions among vermiculite addition levels. ANOVA was also performed on the total dry matter yields, as well as N uptake, from each pot (across all vermiculite addition levels). Kendall’s correlation coefficient was determined for dry matter yields and vermiculite addition for the final three cuts. Statistics were performed using GENSTAT(2013).
Results and discussion
Gas emissions
Measured ammonia (NH3) emissions from the pots that
underwent gas analysis were negligible (<40 mg/L above background concentrations). The low NH3 emissions were
probably due to the topdressing of the treatments beneath 5 cm of soil. This incorporation at depth was performed to avoid nutrient burning of the vulnerable pasture seedlings.
Cumulative N2O emissions from the pots are shown in
Figs S1–S10, available as Supplementary Material for this paper. Emission fluxes from untreated manure and urea applications to the soils were lower than the Intergovernmental Panel on Climate Change (IPCC) emission factors for land-applied manures (0.016). The lower fluxes reported in our work were expected, given that our measurement set-up did not permit continuous capture of emissions, with the pots having to be regularly removed from the bags for plant survival and adequate gas-measurement coverage for the experiment. Given that emissions from the pots were analysed for ~10% of the emission-measurement period, then broad 1. Pots taken from their glasshouse locations
and placed into sealable collapsible bags
2. Pots covered with protective cage to prevent plant damage during gas analysis
3. Automated 32-channel relay board directing gas from bags to analysers
4. Continuous analyser, reading composition of each bag during 10-minute cycles
emission estimates of 0.002–0.025 can be extrapolated from the untreated soil manure and urea applications, which is within the IPCC range.
In some of the treatments, particularly at the low N application rates where the added N contributed only 2–6% of existing soil N content, N2O emissions from the soil alone exceeded emissions
from the soils amended with manures. It is likely that this was related to differences in physical properties between soil-only treatments and those containing manure and vermiculite. Indeed, gas exchange and physical parameters have been reported to strongly influence N2O emissions (Beareet al.2009; Gregorich et al.2014). High N2O emissions from the soil alone are not
surprising, given the presence of an existing N reservoir, favourable soil moisture levels to accommodate nitrification and denitrification processes, and the presence of nitrifying (e. g.Thaumarchaeota,Nitrospiraceae,Nitrospira) and denitrifying (e.g.Streptomyces,Alicyclobacillus,Bacillus) bacteria, as well as denitrifying fungi (e.g.Fusarium,Trichosporon) in the soils, as confirmed by parallel research.
Nitrous oxide emissions steadily decreased over the 2-month gas emission measurement period, which accords well with emission trends for land-applied manures reported in the literature (Lessardet al.1996; Chadwicket al.2000; Sherlock et al.2002; Gintinget al.2003; Amonet al.2006; Rochetteet al. 2008).
Emissions from the Ferrosol amendments were lower than those from the Sodosol amendments. This was perhaps due to the higher CEC of the Ferrosol (Table 3), which might have facilitated greater NH4+-N adsorption and subsequent suppression
of N mineralisation.
Across all treatments, there was a consistent decrease in emissions with increasing vermiculite addition level (Fig. 2). Moreover, there was a significant (P 0.05) difference in emission flux between the treatments containing no vermiculite and those containing the highest vermiculite addition. The 70% decrease in N2O emissions brought about
by the higher rate of vermiculite addition was considerably higher than the 40% decrease in N2O emissions from soils amended with
zeolite, observed by Zamanet al. (2007). This difference might have been attributable to the higher CEC of vermiculite (105 cmol/kg) used in our study than that of the zeolite (80 cmol/kg)
used by Zamanet al. (2007). In any case, the approach of using high-CEC materials to decrease N-based GHG emissions from fertilised soils clearly has strong potential. Subsequent tests at a
field scale, which will be outlined in detail in a paper to follow, also saw a significant effect of vermiculite on N2O emissions on
Ferrosol. Gas emissions were measured using a large vented chamber across 96 plots. Overall, the clays have achieved a significant (P < 0.05) and substantial decreases in N2O
emissions across all trials (>50% on average).
Agronomic data
A technology that decreases GHG emissions at the expense of productivity will not be viable. Therefore, it was important to evaluate the effect of vermiculite on the growth of the kikuyu model plant. We assessed agronomic performance by measuring dry matter yields and nutrient (N) uptake by the shoots in the pots. The cumulative dry matter yields (DMY) from the harvested kikuyu shoots over the 10 months are shown in Fig.3. There were no significant (P>0.05) differences in DMY with an increasing level of vermiculite addition for the Ferrosol. For the Sodosol, there were some significant (P0.05) differences in Table 3. Physicochemical composition of manures, urea and vermiculite used
Values are means, with standard deviations in parentheses. Corg, organic carbon; CEC, cation exchange capacity; N, nitrogen; NH4, ammonium; NO3, nitrate
Parameter Manure Clay Soil
Beef feedlot Piggery deep litter Poultry litter Layer manure Vermiculite Sodosol Ferrosol
Moisture % by wet weight 88 (13) 76 (0.9) 23 (0.5) 130 (3.4) – 0.67 (0.29) 5.0 (0.27)
pH 7.0 (0.04) 8.7 (0.04) 8.0 (0.04) 6.5 (0.08) – 6.3 (0) 6.4 (0)
Corg(%) 37 (4.8) 45 (1.6) 39 (1.1) 33 (1.1) <0.005 0.48 (0.05) 3.41 (0.1)
Dumas N (%) 3.1 (0.5) 1.4 (0.05) 4.1 (0.4) 6.2 (0.4) <0.005 0.06 (0) 0.29 (0.01)
NH4-N (mg/kg) 1812 (82) 3531 (22) 4660 (147) 7069 (222) – 1.34 (0.16) 11.8 (0.89)
NO3-N (mg/kg) 363 (202) 577 (24) 296 (20) 219 (34) – 2.15 (0.16) 3.50 (0.38)
Coarse sand (%) – – – – – 56 (1.0) 6.7 (0.6)
Fine sand (%) – – – – – 37 (0.58) 18 (0)
Silt (%) – – – – – 4.3 (0.58) 22 (1.5)
Clay (%) – – – – – 4.7 (0.58) 53 (1)
CEC (cmol/kg) – – – – 105 (1.5) 1.08 (0.34) 11.5 (1.9)
a
a, b
b 1
0.8
0.6
N2 O (mg/gN) 0.4
0.2
0
0 2
Vermiculite level 4
Baseline soil emissions
Fig. 2. Geometric means of N2O fluxes across all amendments, with
standard errors. Common letters indicate that the means are not significantly
yield across each vermiculite level, with greater yields harvested from the pots with the 3rd vermiculite addition level than with the other levels (Fig.3). However, there were no obvious trends relating DMY with vermiculite addition level. We also observed no significant (P >0.05) effect of vermiculite addition on N uptake by the model kikuyu plant. This was true when combining the two soils for statistical analysis and when assessing them individually (Fig.4).
The agronomic results from our glasshouse trial are encouraging as they suggest that the observed significant (P0.05) decreases in N2O emissions caused by the vermiculite
did not compromise dry matter production or nutrient uptake, which is important from a productivity perspective. There were even some indications that the addition of vermiculite could improve the agronomics of crop and plant systems in the long term. In Fig.5, we plot the kikuyu shoot DMY for only the last four cuts from the Sodosol pots. Although not statistically significant (P= 0.1), there was a strong correlation (r2= 0.87) between DMY and vermiculite addition level for these final cuts. This suggests an effect where vermiculite-sorbed NH4-N
is gradually nitrified and made available to plants as other sources of N become increasingly scarce, through leaching, plant uptake and gaseous loss.
This agronomic effect towards the end of the trial may relate to N deficiency in the Sodosol pots. Determining N deficiency is not straightforward because the resident soil N, as well as the applied manure and urea N, contributes to microbial activity. N uptake by the pasture exceeded manure and urea N additions by a factor of>2 for the Ferrosol treatments over the trial. The plants were clearly tapping into the soil N content, which was
34 times higher than the applied manure and urea N. The Sodosol plants also took-up a high proportion of the applied manure and urea N (~80% across all vermiculite levels), and the soil N contribution in these treatments was much lower than for the Ferrosol treatments (soil N 11 times higher than the applied manure and urea N). By the end of the trial, it is likely that the pots were deficient in N, and the increase in yield with vermiculite treatment (Sodosol soil) may have been a response to deferred nutrient release related to desorption from the vermiculite into soil solution. Glasshouse trials are also less likely to result in N leaching as watering is controlled to limit Baseline yield, no
nitrogen addition
Baseline yield, no nitrogen addition
0 1 2
Vermiculite level
3 4
Ferrosol
Sodosol
a a
a a a
b a,b b
a
b
50 51 52 53 54 55 55 56 57 58 59
Dr
y matter (g)
Fig. 3. Box and whisker plots for dry matter yields from harvested kikuyu shoots. Data are cumulative across the entire trial. Common letters indicate
that values are not significantly different (P= 0.05). Refer to Table1for
vermiculite addition levels.
Ferrosol
Sodosol
0 1 2
Vermiculite level
3 4
40
35
30
25
20
15
20
15
10
5
N (mg/cut)
a a a
a a
a a a
a
a
Baseline uptake, no nitrogen addition
Baseline uptake, no nitrogen addition
Fig. 4. Box and whisker plots for N uptake in harvested kikuyu shoots.
Common letters indicate that values are not significantly different (P= 0.05).
Refer to Table1for vermiculite addition levels.
21.10
21.05
21.00
20.95
20.90
20.85
0 2 4 6 8 10 12
20.90
20.90
21.00
20.95 21.00
Predicted growth (g)
Measured g
ro
wth (g)
Vermiculite addition (g)
Dr
y matter yield (g)
R2 = 0.87
Fig. 5. Regression between mean dry matter yields from the harvested kikuyu shoots from Sodosol and the level of vermiculite addition for the
final three cuts in the trial. Inset graphic shows correlation between
measured growth and predicted growth. Refer to Table1for vermiculite
losses, thus delaying nutrient deficiency that can be seen in
field-scale environments. In the subsequent field trial, clays increased DMY by 20%. Here, we suggest the following two potential agronomic benefits that clays might offer over chemical inhibitors: (1) lower environmental and contaminant risks; and (2) a supply-on-demand pattern of N delivery to plants, compared with inhibitors where N release is directly related to soil and environmental conditions. Thus, our clay-based technology clearly has merit as an effective GHG mitigation strategy, with potential associated agronomic benefits.
Further considerations
Critical examination of the logistics of developing a clay-based GHG mitigation technology is needed. Data on expected embodied emissions associated with obtaining the clays are required to determine whether there is a net GHG reduction benefit achievable by going down this path. Our team is currently performing a life cycle analysis on the results reported here, with the outcomes planned for publication in a follow-up manuscript.
Conclusions
Vermiculite was shown to be highly effective in supressing N2O
emissions from a variety of manures and urea incorporated into a clayey and sandy soil supporting a model plant (kikuyu). At its highest addition rate (1 : 1 manure dry weight), the high-CEC clay brought about an average N2O emission decrease of 70%
acrossfive N sources (four manures and urea), two soil types and two N loading rates. Importantly, the addition of vermiculite did not adversely affect growth rates of the model kikuyu plant. Indeed, towards the end of the trial, when the plants were showing signs of N depletion, we observed encouraging evidence that the vermiculite additions were causing improved agronomic yields. Further work, includingfield-testing, life cycle analysis and cost–benefit analysis, is needed to develop the approach into a workable technology that can be rolled-out atfield scale.
Acknowledgements
This research was funded by the Australian Government, University of Queensland, Meat and Livestock Australia, Australian Pork Limited, Rural Industries Research and Development Corporation and Australian Egg Corporation Limited as part of the National Agricultural Manure Management Program. We thank those farmers who permitted access to their sites. Thanks go to Warwick Nash, Ray King, Ian Kruger and Janine Price for their constructive comments on the manuscript. We are appreciative of the technical inputs of Grant Brown, John McAlpine, Gregor McAuley, Tahlia Duncan and Maren Westermann.
References
Amon B, Kryvoruchko V, Amon T, Zechmeister-Boltenstern S (2006) Methane, nitrous oxide and ammonia emissions during storage and
after application of dairy cattle slurry and influence of slurry treatment.
Agriculture, Ecosystems & Environment112, 153–162. doi:10.1016/ j.agee.2005.08.030
Beare MH, Gregorich EG, St-Georges P (2009) Compaction effects on
CO2 and N2O production during drying and rewetting of soil. Soil
Biology & Biochemistry41, 611–621. doi:10.1016/j.soilbio.2008.12.024
Bouwman AF (1996) Direct emission of nitrous oxide from agricultural
soils. Nutrient Cycling in Agroecosystems 46, 53–70. doi:10.1007/
BF00210224
Buckee GK (1994) Determination of total nitrogen in barley, malt and beer by Kjeldahl procedures and the Dumas combustion method: collaborative
trial.Journal of the Institute of Brewing100, 57–64.
Cederberg C, Hedenus F, Wirsenius S, Sonesson U (2013) Trends in greenhouse gas emissions from consumption and production of animal
food products: implications for long-term climate targets. Animal 7,
330–340. doi:10.1017/S1751731112001498
Chadwick DR, Pain BF, Brookman SKE (2000) Nitrous oxide and methane
emissions following application of animal manures to grassland.Journal
of Environmental Quality29, 277–287. doi:10.2134/jeq2000.0047242 5002900010035x
Danaher M, Jordan K (2013) Identification of existing and emerging
chemical residue contamination concerns in milk. Irish Journal of
Agricultural and Food Research52, 173–183.
Dell CJ, Kleinman PJA, Schmidt JP, Beegle DB (2012) Low-disturbance
manure incorporation effects on ammonia and nitrate loss.Journal of
Environmental Quality41, 928–937. doi:10.2134/jeq2011.0327
El-Mashad HM, Zhang R (2010) Biogas production from co-digestion of
dairy manure and food waste.Bioresource Technology101, 4021–4028.
doi:10.1016/j.biortech.2010.01.027
GenStat (2013)‘GenStat for Windows, release 15.3.’(VSN International:
Oxford, UK)
Ginting D, Kessavalou A, Eghball B, Doran JW (2003) Greenhouse gas emissions and soil indicators four years after manure and compost
applications.Journal of Environmental Quality32, 23–32. doi:10.2134/
jeq2003.2300
Gregorich EG, McLaughlin NB, Lapen DR, Ma BL, Rochette P (2014) Soil compaction, both an environmental and agronomic culprit: increased
nitrous oxide emissions and reduced plant nitrogen uptake. Soil
Science Society of America Journal78, 1913–1923. doi:10.2136/sssaj 2014.03.0117
Inoue K, Sakamoto T, Min JZ, Todoroki K, Toyo’oka T (2014)
Determination of dicyandiamide in infant formula by stable isotope dilution hydrophilic interaction liquid chromatography with tandem
mass spectrometry.Food Chemistry156, 390–393. doi:10.1016/j.food
chem.2014.01.124
Koneswaran G, Nierenberg D (2008) Global farm animal production and
global warming: impacting and mitigating climate change.Environmental
Health Perspectives116, 578–582. doi:10.1289/ehp.11034
Krogmeier MJ, McCarty GW, Bremner JM (1989) Potential phytotoxicity
associated with the use of soil urease inhibitors.Proceedings of the
National Academy of Sciences, USA 86, 1110–1112. doi:10.1073/ pnas.86.4.1110
Lessard R, Rochette P, Gregorich EG, Pattey E, Desjardins RL (1996)
Nitrous oxidefluxes from manure-amended soil under maize.Journal
of Environmental Quality25, 1371–1377. doi:10.2134/jeq1996.00472 425002500060029x
Lin X, Hasi W-L-J, Lou X-T, Han S-Q-G-W, Lin D-Y, Lu Z-W (2015) Direct and quantitative detection of dicyandiamide (DCD) in milk
using surface-enhanced Raman spectroscopy.Analytical Methods 7,
3869–3875. doi:10.1039/C5AY00313J
McMichael AJ, Powles JW, Butler CD, Uauy R (2007) Food, livestock
production, energy, climate change, and health.Lancet370, 1253–1263.
doi:10.1016/S0140-6736(07)61256-2
McTaggart IP, Clayton H, Parker J, Swan L, Smith KA (1997) Nitrous oxide emissions from grassland and spring barley, following N
fertiliser application with and without nitrification inhibitors.Biology
and Fertility of Soils25, 261–268. doi:10.1007/s003740050312
Mosier A, Kroeze C, Nevison C, Oenema O, Seitzinger S, van Cleemput O
the agricultural nitrogen cycle.Nutrient Cycling in Agroecosystems52,
225–248. doi:10.1023/A:1009740530221
Mumpton FA, Fishman PH (1977) The application of natural zeolites in
animal science and aquaculture. Journal of Animal Science 45,
1188–1203.
Natvig EE, Ingham SC, Ingham BH, Cooperband LR, Roper TR (2002)
Salmonella enterica serovar Typhimurium and Escherichia coli
contamination of root and leaf vegetables grown in soils with
incorporated bovine manure.Applied and Environmental Microbiology
68, 2737–2744. doi:10.1128/AEM.68.6.2737-2744.2002
Pal P, McMillan AMS, Saggar S (2015)‘Routes of dicyandiamide uptake
in pasture plants: a preliminary glasshouse study.’Occasional report
no. 28. (Eds LD Currie, LL Burkitt) pp. 1–9. (Fertilizer and Lime
Research Centre, Massey University: Palmerston North, New Zealand)
Available at http://flrc.massey.ac.nz/publications.html [Verified 30
November 2015]
Pratt C, Redding M, Hill J, Jensen PD (2015a) Does manure management
affect the latent greenhouse gas emitting potential of livestock manures?
Waste Management46, 568–576.
Pratt C, Redding MR, Hill J (2015b) Application of sorbers to mitigate
greenhouse gas emissions from land-applied pig litter. Animal
Production Science,in press.
Pratt C, Redding MR, Hill J, Brown G, Westermann M (2016) Clays can decrease gaseous nutrient losses from soil-applied livestock manures.
Journal of Environmental Quality, in press.
Ravishankara AR, Daniel JS, Portmann RW (2009) Nitrous oxide (N2O):
the dominant ozone-depleting substance emitted in the 21st century.
Science326, 123–125. doi:10.1126/science.1176985
Redding MR (2011) Bentonites and layered double hydroxides can
decrease nutrient losses from spent poultry litter.Applied Clay Science
52, 20–26. doi:10.1016/j.clay.2011.01.016
Redding MR, Shorten PR, Lewis R, Pratt C, Paungfoo-Lonhienne C, Hill J (2016) Soil N availability, rather than N deposition, controls indirect
N2O emission.Soil Biology and Biochemistry, in press.
Rochette P, Angers DA, Chantigny MH, Gagnon B, Bertrand N (2008)
N2Ofluxes in soils of contrasting textures fertilized with liquid and
solid dairy cattle manures. Canadian Journal of Soil Science 88,
175–187. doi:10.4141/CJSS06016
Saggar S, Singh J, Giltrap DL, Zaman M, Luo J, Rollo M, Kim DG, Rys G,
der Weerden TJv (2013) Quantification of reductions in ammonia
emissions from fertiliser urea and animal urine in grazed pastures with urease inhibitors for agriculture inventory: New Zealand as a case study.
The Science of the Total Environment 465, 136–146. doi:10.1016/ j.scitotenv.2012.07.088
Shcherbak I, Millar N, Robertson GP (2014) Global metaanalysis of the
nonlinear response of soil nitrous oxide (N2O) emissions to fertilizer
nitrogen.Proceedings of the National Academy of Sciences, USA111,
9199–9204. doi:10.1073/pnas.1322434111
Sherlock RR, Sommer SG, Khan RZ, Wood CW, Guertal EA, Freney JR, Dawson CO, Cameron KC (2002) Ammonia, methane, and nitrous oxide emission from pig slurry applied to a pasture in New Zealand.
Journal of Environmental Quality 31, 1491–1501. doi:10.2134/jeq 2002.1491
Snyder CS, Davidson EA, Smith P, Venterea RT (2014) Agriculture: sustainable crop and animal production to help mitigate nitrous oxide
emissions. Current Opinion in Environmental Sustainability 9–10,
46–54. doi:10.1016/j.cosust.2014.07.005
Sumner ME, Miller WP (1996)‘Cation exchange capacity and exchange
coefficients.’(Soil Science Society of America and American Society
of Agronomy: Madison, WI)
Zaman M, Nguyen ML, Matheson F, Blennerhassett JD, Quin BF (2007) Can soil amendments (zeolite or lime) shift the balance between nitrous oxide and dinitrogen emissions from pasture and wetland soils receiving
urine or urea-N?Soil Research45, 543–553. doi:10.1071/SR07034