Estimation of Salinity Intrusion by Using Landsat 8
OLI Data in The Mekong Delta, Vietnam
Phuong Ha Tran1, Anh Kim Nguyen2,3*, Yuei-An Liou2*, Phung Phi Hoang4,5, and Hung Thanh Nguyen6
1Ho Chi Minh City Institute of Resources Geography, Vietnam Academy of Science and Technology (VAST)
No. 1, Mac Dinh Chi St., 1st District, Ho Chi Minh City, Vietnam
2Center for Space and Remote Sensing Research, National Central University
No. 300, Jhongda Rd., Jhongli District, Taoyuan City 32001, Taiwan, R.O.C.
3Institute of Geography, VAST. 18 Hoang Quoc Viet Rd., Cau Giay Dist., Hanoi City, Vietnam
4Graduate University of Science and Technology, VAST
5Ho Chi Minh City Space Technology Application Center, Vietnam National Space Center, VAST
6Representative Office of VAST in Ho Chi Minh City.
No. 1, Mac Dinh Chi St., 1st District, Ho Chi Minh City, Vietnam
*Authors to whom correspondence should be addressed; E-Mail: [email protected] and [email protected]; Tel.: +886-3-4227151 (ext. 57631); Fax: +886-3-4254908.
Abstract:
Salinity intrusion is one of the most serious consequences of climate change coupled with rising sea level that significantly affects agricultural activities in many parts of the world. This phenomenon has increasingly become more serious and frequently occurred in the Mekong Delta of Vietnam. As a result, Vietnam has been ranked among top five countries where have been devastatingly impacted by climate change, in particular, its Tra Vinh Province characterized by coastal plain and alluvial deposit. In addition, this area is of the tropical monsoon zone of long rainy season with source of salt brought from the sea by the tides and sea level rise. Regions that are contaminated by salt are located in lowland and often suffer from floods linking to tidal effects with salty water from river systems and channels. Soil salinity evaluation is critical for coastal protection, restoration, and agricultural planning since it can be considered as an agricultural indicator to evaluate quality of soil. Here, we attempt to estimate the soil salinity in Tra Vinh Province, in the Mekong Delta of Vietnam. Landsat 8 OLI images are utilized to derive indices for soil salinity evaluation including single bands, Vegetation Soil Salinity Index (VSSI), Soil Adjusted Vegetation Index (SAVI), Normalized Difference Vegetation Index (NDVI), and Normalized Difference Salinity Index (NDSI). Subsequently, satistical analysis between soil salinity, electrical conductivity (EC, dS/m), and environmental indices derived from Landsat 8 OLI image is performed. Results indicate that spectral value of Near Infrared (NIR) band and VSSI are highly correlated with EC (R2 = 0.7779 and R2 = 0.6957, respectively) in comparison with the other indices. Comparative results show that soil salinity derived from Landsat 8 is consistent with in situ data. Findings of this study demonstrate that Landsat 8 OLI images reveal a high potential for spatiotemporally monitoring the magnitude of soil salinity at the top soil layer. Outcomes of this study are useful for agricultural activities, planners, and farmers by providing the base map of soil salinity contamination for better selection of accomodating crop types to reduce economical lost in the context of climate change. Our proposed method that estimates soil salinity using satellite-derived variables can be applied in the other regions.
Keywords: Salinity intrusion; climate change; rising sea level; electrical conductivity; Landsat 8 OLI; Tra Vinh Province; Mekong Delta.
1. Introduction
Soil salinizationis a process of enriching the soil with soluble salts to deteterious levels at or near the soil surface [1], resulting in modification of biochemical features of soil. Saline intrusion occurs when salts are dissolved in water to accumulate in the soil at a level that affects agricultural production, environment, and economics. Inititally, in the first phase, salinity affects the metabolism of soil organisms and reduces the productivity of land. In the next phase, it destroys all the plants and other organisms living in the soil. Saline intrusion is one of the influencial factors leading to land degradation, and triggering a significant threat on the sustainable growth and economic benefits [2]. Salinity is a natural characteristic of the land, while its level may exceed the nominal value due to natural and anthropogenic processes, such as as climate change, sea level rise, desertification, urbanization, and irrigation. Globally speaking, it is estimated that farmland affected by salinity is approximately 45 million hectares with an increased rate from 200,000 to 500,000 hectares a year [3]. To mitigate the degradation process of agricultural land, there is a need to monitor and manage land resources. Mapping intrusion of salt into soil is important for sustaibale agricultural planning. Remote sensing data has been an instrumental powerful tool over conventional techniques in providing long-term timespan data images for environmental and natural resources monitoring and management at different spatial scales.
There have been various studies using remote sensing data to derive soil salinity information from spectrum channels, which are sensitive to water elements, such as Shortwave Infrared (SWIR)
and Near Infrared (NIR) [4]. In the literature, Landsat TM/ETM+ data have been used to monitor a variety of environmental issues associated with overall vulnerability assessment [5, 6], specific soil contamination [7], … etc. Verma et al. [7] found that the degree of soil contaminated by salt affects land cover characteristics, resulting in different appearances (color, texture, shape, etc.) on the Landsat TM images. Efforts have been made by Thompson et al. [8] and Douaoui et al. [9] to
investigate the correlation between indices derived from Landsat 8 OIL images and amount of salt obtained from in situ data. Thompson et al. [8] used different techniques to analyze the salinity of the
soil. Their research confirmed that salty soil can be reasonably well detected by using Landsat data. Douaoui et al. [9] cited 11 indices derived from satellite imagery with 20-meter resolution collected
during the 1997 summer sampling campaign. Sumfleth and Duttmann [10] modified a method for predicting the arrangement of land bases in paddy rice fields by utilizing in situ data and satellite
information as an index number. Correlation analysis showed that the distribution of salt content has a close relationship with NDVI and that it substantially corresponded to the terrain features
such as relative altitude, e.g., the altitude of drainage channel, and topographical wetness. In addition, quantifying and mapping soil salinity by using different remote sensing sensors have been studied by numerous researchers [11-15]. In general, the techniques and methods used in the
previous studies to extract soil salinity information from satellite images have been successful to some extent. However, the relationship between soil salinity and river discharge near the coast or
tidal effects depends on the environmental conditions. Thus, there is a demand of further investigation and validation on the capacity of using satellite image-derived variables to study soil salinity in different environmental and biochemical conditions, and climate zones.
According to recent data of Directorate of Water Resources -Ministry of Agriculture and Rural
by 0.1-1.5 m. The intrusion of saline water increased salinity of water surface by about 4 g/l
spreading through Hau and Tien Rivers, deep into to 45-65 km and 55-60 km from the coast, respectively. In contrast, the drought led to a decline in underground water level and salinity
intrusion in the sweeping 90 years, focusing primarily in Ben Tre, Kien Giang, and Tra Vinh Provinces [16]. In addition, according to the report of Department of Agriculture and Rural
Development of Tra Vinh Province, in the dry season in 2016, 12,346 ha of rice were damaged due to the impact of drought and saline intrusion, which mainly focused in Tra Cu, Cau Ngang, Tieu Can, Chau Thanh, Duyen Hai districts, and Tra Vinh City [16]. In the field of fishery, 228 ha of shrimp
farm belonging to 598 households were attacked by white spots and liver pancreas diseases, mainly exhibiting in the Duyen Hai, Tra Cu, Chau Thanh districts, and Duyen Hai Town. The suddenly
increased amount of salt content in aquaculture areas disabled farmers to cope with and resulted in significant economic damages.
The conventional method for monitoring soil salinity shows its weakness and difficulties to be implemented over large areas. This leads to limitation in land management under the influence of
salinity intrusion. The core objective of this study is to extract information of salty and savory infiltration situation in Tra Vinh Province, Vietnam. The statistical analysis between the salinity, electrical conductivity (EC, dS/m), and the indices derived from Landsat 8 OLI including Vegetation
Soil Salinity Index (VSSI), Soil Adjusted Vegetation Index (SAVI), Normalized Difference Vegetation Index (NDVI), and Normalized Difference Salinity Index (NDSI) is performed. Our
study shows four significant points: (i) Results demonstrate that the method used to extract salty information depends on the salinity of the environmental conditions and climate parameters in the
study area; (ii) Enhance research in monitoring soil salinity in the tropical monsoon areas where are significantly influenced by climate change coupled with rising sea level. This is the first investigation
of soil salinity in the study area and aims to support sustainable outcomes in the biggest paddy rice field of Asia; (iii) Results have been validated with field data, and this method shows the ability to extract soil salinity to investigate the natural and environmental features of the region of interest;
and (iv) Results of soil salinity maps can be useful for monitoring and management of agricultural land and decision makers to propose effective actions to reduce the impacts of salinization process
under the context of climate change.
2. Materials and Methods
2.1 Study area
The Tra Vinh Province is selected for this study (Figure 1). Its geographical location ranges from
Figure 1. Geographical location of Tra Vinh Province in the Mekong Delta, Vietnam.
2.2 Materials
The materials used in this study include:
(1) Landsat 8 OLI satellite image acquired on February 14, 2017 with a resolution of 30 meters.
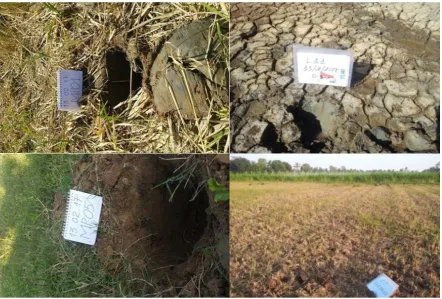
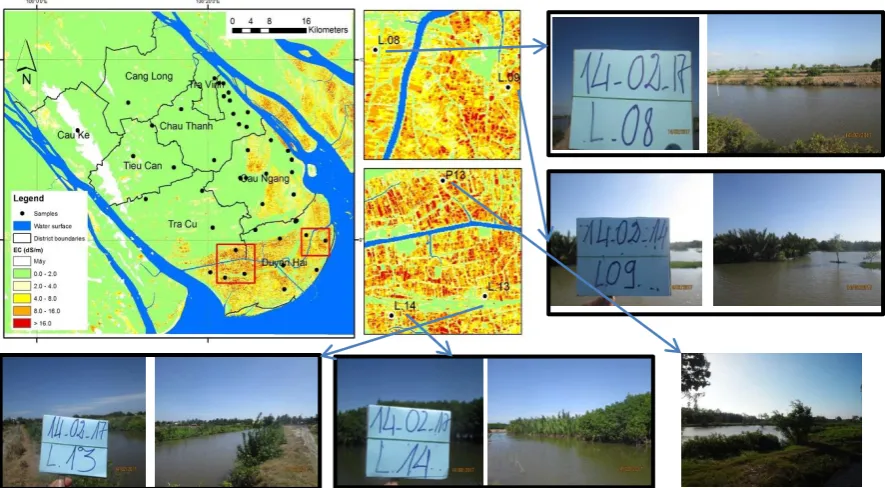
(2) Field salinity survey was conducted by taking soil samples over Tra Vinh Province. The total is 44 soil samples, between 0 and 20 cm depth. The locations of samples were selected based on the
soil classification map of Tra Vinh Province to meet the requirement that samples are located at different soil types, as shown in Figures 2 and 3. Among 44 samples, three samples were eliminated
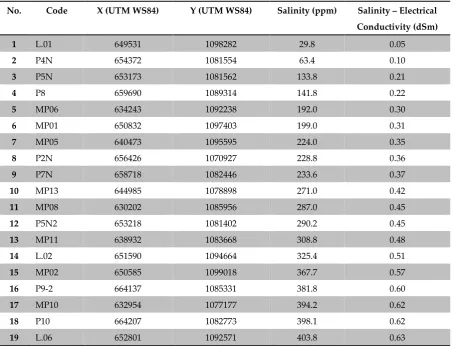
due to cloud cover so that 41 samples remain useable. Among them, 21 samples were used for training and 20 samples used for validation (Table A1). The field trip was conducted during 1-3 Feb, 2017 in Tra Vinh Province.
Figure 3. Four photos show soil samples taken at different land types.
2.3 Reference data
(1) Land use map: The study collected land use map of Tra Vinh Province with scale of 1/100000 in 2016. The coordinate system is VN-2000.
(2) Map of Saline soil classification in Tra Vinh Province: The study collected saline soil classification map of Tra Vinh Province with scale of 1/100000. The coordinate system is VN-2000.
2.4 Research method
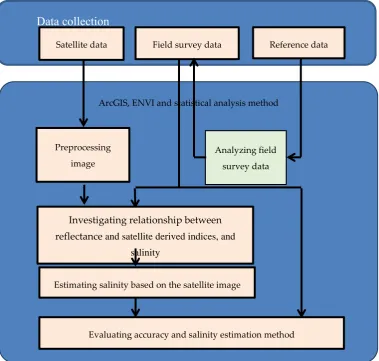
This section presents processing steps and soil salinity assessment method (Figure 4). The soil salinity is estimated by the EC of the soil measured at the survey sites. Based on the result, the
analysis is made to determine the relationship between reflectance values and indices of soil salinity, to estimate the soil salinity from the Landsat 8 image.
Figure 4. The workflow of salinity retrieval using satellite image.
3. Results
The 21 samples of salinity - EC data (Table A1) are analyzed with the spectral reflectance of the Landsat 8 OLI image. The various soil types reflect solar irradiance differently. The difference in
reflectance allows one to determine the soil type at the surface layer. Validation samples were taken from different land use/ land cover types, including paddy rice field, shrimp ponds, bare land, and
cropland. The sample locations are selected at different salinity intrusion degrees.
3.1 Relationship between EC and spectral reflectance bands
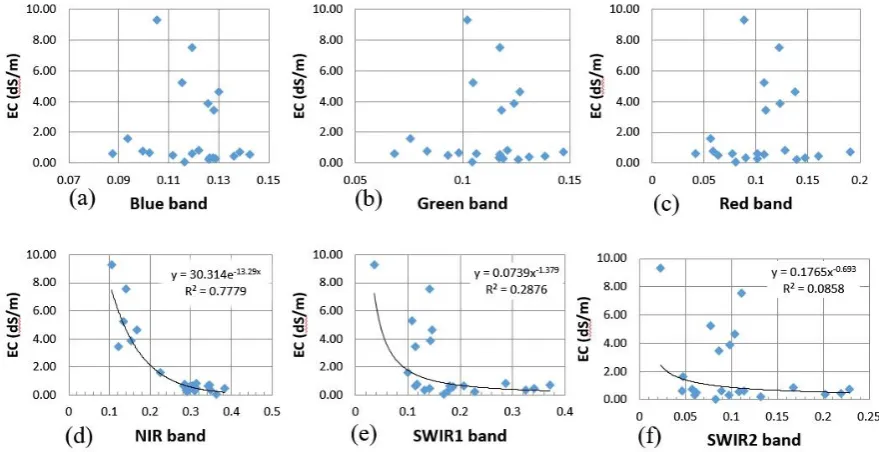
The relationship between salinity - EC and spectral reflectance is shown in Figure 5. Thereby, salinity links to NIR and SWIR1 spectral channels, in which the NIR channel has a high correlation
with salinity. The correlation coefficient is 0.7779 between EC (ds/m) and NIR channel (Figure 5d). Other channels from Landsat image show unclear association with soil salinity.
ArcGIS, ENVI and statistical analysis method
Data collection
Satellite data Field survey data Reference data
Preprocessing
image
Investigating relationship between
reflectance and satellite derived indices, and
salinity
Analyzing field
survey data
Figure 5. Correlations between electrical conductivity (EC) and spectral reflectance at different bands of
Landsat 8 OLI image acquired on date 14/02/2017: between EC and (a) Blue Band; (b) Green Band; (c) Red band;
(d) NIR band; (e) shortwave infrared 1 (SWIR1) band; and (f) shortwave infrared 2 (SWIR2) band.
3.2 Relationship between salinity and indices derived from Landsat data
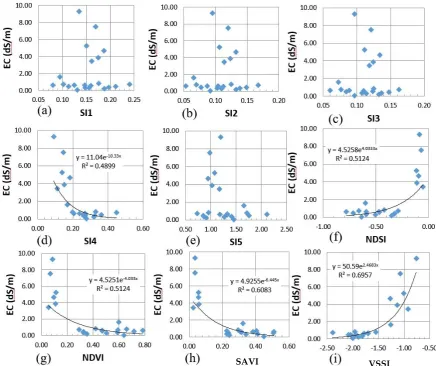
We also investigate the relationship between salinity - EC and remote sensing indices as shown
in Figure 6. The indices are described in Table 1.
Table 1. The Formulas used to derive the indices, and their references
No. Indices Formula Sources
1 Salinity index - SI1 SI1 = sqrt(Green^2 + Red^2) Douaoui et al. [9] 2 Salinity index - SI2 SI2 = sqrt(Green*Red) Douaoui et al. [9] 3 Salinity index - SI3 SI3 = Blue*Red Khan et al., 2001 [17]
4 Salinity index - SI4 SI4 = (Red*NIR)/Green Abbas et al. [18]
5 Salinity index - SI5 SI5 = Blue/Red Abbas et al. [18]
6 Normalized Difference Salinity Index - NDSI
NDSI = (Red – NIR)/(Red + NIR) Khan et al. [17]
7 Normalized Difference Vegetation Index - NDVI
NDVI = (NIR - Red)/(Red + NIR) Khan et al. [19]
8 Soil Adjusted Vegetation Index - SAVI (L = 0.5)
SAVI = (1+L)*NIR – Red/L + NIR + Red
Alhammadi and Glenn [20]
9 Vegetation Soil Salinity Index - VSSI
VSSI = 2xGreen – 5*(Red + NIR) Dehni and Lounis [21]
From the scatter plots in the Figure 6, it shows that the SI1, SI2, SI3, and SI5 indices are weakly correlated with the salinity. In contrast, the SI4, NDSI, NDVI, SAVI, and VSSI have a clear
Figure 6. Correlations between electrical conductivity and salinity indices derived from different bands of
Landsat 8 OLI and environmental indices, including Normalized Difference Vegetation Index (NDVI), Soil
Adjusted Vegetation Index (SAVI), and Vegetation Soil Salinity Index (VSSI).
3.3 The salinity estimation and validation
After using the regression method for five indices derived from Landsat data including SI4, NDVI, NDSI, SAVI, VSSI, and NIR for the soil salinity, it is found that the regression models have a
well-defined coefficient (R2) between the salty value obtained from the field measurement and salty values derived from remote sensing data. The highest coefficient is 0.7779 between the salinity and
the NIR channel as shown in Table 2.
Table 2. Regression models for estimating the EC from remote sensing data
No. Regression formula R2 P-value Standard error of EC
(dS/m) 1 EC = 30.314*e-13.29* NIR 0.7779 1.25E-07 1.322
2 EC = 11.04*e-10.33*SI4 0.4899 0.000412 1.527 3 EC = 4.5258*e4.0333*NDSI 0.5124 0.000263 1.512 4 EC = 4.5251*e-4.033*NDVI 0.5124 0.000263 1.512 5 EC = 4.9255*e-6.445*SAVI 0.6083 0.000030 1.449 6 EC = 50.59*e2.4683*VSSI 0.6957 2.62E-6 1.387
4. Estimation of the soil salinity and accuracy assessment 4.1 Accuracy assessment
The statistical analysis results are shown in Table 2. All of six regression models have a high
statistical coefficient (R2) with P-value less than 0.05. Therefore, the study adopts all of these models to estimate the salinity of soil based on the remote sensing indices for the 20 validation samples
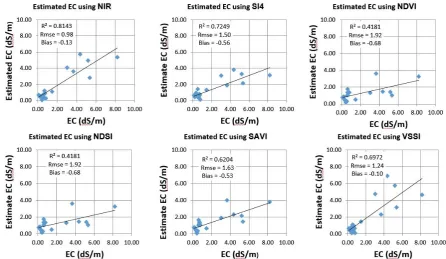
(Table A1). Figure 6 shows that there is a strong correlation between estimated EC and observed EC when using the 1st and 6th models. Correspondingly, the correlation between EC and NIR and between EC and VSSI model are 0.8143 and 0.6972, respectively, and the corresponding lowest
gradient values (Bias) are -0.13 and -0.10, respectively, indicating that the two models were the most suitable ones while comparing with the salinity values.
Figure 7. Correlation of salinity derived from Landsat 8 OLI and field survey data of 20 test samples over Tra
Vinh Province.
4.2 Results of estimated salinity mapping
Accuracy assessment indicates that salinity (EC, dS/m) shows its high correlation with NIR and VSSI indices. Therefore, this study generates salinity maps for the entire Tra Vinh Province using the
NIR model (Figure 8) and VSSI model (Figure 9). Soil salinity is classified into five levels based on Chhabra [22].
Table 3. Classification of soil salinity based on electrical conductivity values
EC (dS/m) Soil salinity classes
< 02 Not salinity
02 - 04 Low salinity
04 - 08 Average salinity
08 - 16 High salinity
Figure 8. Soil salinity map with depth from 0 cm to 20 cm in Tra Vinh Province, derived from Landsat 8 OLI
using NIR channel.
Figure 9. Soil salinity map with depth from 0 to 20 cm, using model VSSI index in Tra Vinh Province.
5. Discussion
The soil salinity map with five salty levels serves for land management and agricultural planning. Remote sensing technology has been proven its efficiency in the investigation of soil salinity on a
large area. Results show that using Landsat image 8 OLI images allows one to extract and monitor the features of the salty land. They indicate that the salinity of the soil has strong relationship with
the reflectance at NIR channel. This is in line with the results of research presented by Metternicht and Zinck [4]. However, the SWIR channel does not have a high correlation with EC, which has
been found in the study Elnaggar and Noller [23], reflecting higher values of the visible and infrared channels near the surface of not salty. The relationship is unclear for the sand patterns with a high
the naturally hot dry climate conditions of the area of research, such as Saudi Arabia in the Middle
East. Allbed and Kumar [11] found a strong relationship between the SI and salinity indicator in the red channel, which has a high correlation with EC. A similar result is seen in the region of
Ethiopia, Africa [12]. In the case of Tra Vinh Province, it is affected by salt brought from the sea by the tide and rising sea levels. For this reason, the areas where are contaminated by salt due to low
elevation and flooded by tide flow exhibited lower reflectance on the NIR channel in comparison with those of the other regions.
Results of the evaluation model to estimate soil salinity by using NIR channel show the
signatures of salinity dynamics in the research area. They are validated with field data with R2 = 0.8143 and RMSE = 0.98 dS/m. The same was found for the VSSI index, with R2 = 0.6972 and RMSE = 1.24 dS/m. This shows that the NIR channel and VSSI index are suitable for soil salinity estimation. Note that this research achieved a reasonably well performance due to the high quality of remote
sensing image and preprocessing data to enhance the feature information of the Earth surface. This has been done in the various studies by using environmental indicators. By taking for example the
SI, NDVI, NDMI, and NDSI derived from Landsat satellite images to study environmental conditions [9, 23-25], it has been proven of the high potential in enhancement and extraction of soil salinity from remote sensing data. Results of this study indicate that the NIR channel demonstrates
a higher potential to detect the salinity intrusion in the Mekong Delta with a higher degree of confidence.
Results of this study indicate that the NIR channel demonstrates a higher potential to detect the salinity intrusion in the Mekong Delta with a higher degree of confidence. Our findings match
with outcomes of Metternicht and Zinck [4] in that the information on the salinity of the soil can be found in the NIR and SWIR channels. Abdul-Qadir and Benni [25] found that the Red channel in the
series of Landsat ETM+ images has a high correlation with EC for Iraq. In the future, there is a need to extend the research scope based on long-term spatiotemporal monitoring of soil salinity to have a better understanding of interaction between natural conditions (soil moisture, soil type, natural salt
content, … etc.) and human impacts (irrigation, land use, … etc.), resulting in soil contamination as it can be observed by using spectral reflectance of the remote sensing images.
6. Conclusions
This study investigates salinity intrusion in Tra Vinh Province, which is the most affected place among seven coastal provinces in the Mekong Delta. A method of spatiotemporally monitoring soil salinity is proposed by using satellite derived variables in order to support the management of land resources, and to determine the suitable crops to cultivate.
In addition, there is a need to further develop and improve the skills in the monitoring and forecasting of salinization in the agricultural areas of Tra Vinh Province and other provinces where are vulnerable to salinity intrusion. Although the proposed methodology of the study has been demonstrated to perform well in terms of extracting soil salinity information by using the Landsat OLI data, an improved version of the proposed methodology especially in spatiotemporal domains will be even more beneficial to achieve a greater efficiency in contributing to the orientation and planning of agricultural production areas of the salinity intrusion vulnerable regions. Nevertheless, the current version of the proposed methodology is ready to be applied to the other coastal provinces of the Mekong Delta in order to assess the terrains’ vulnerability at a regional scale with low cost and acceptable accuracy for the planning of land use.
Author Contributions: Conceptualization, Phuong Ha Tran and Anh Kim Nguyen; Data curation, Phuong Ha Tran, Phung Phi Hoang and Hung Thanh Nguyen; Formal analysis, Anh Kim Nguyen; Funding acquisition, Yuei-An Liou and Hung Thanh Nguyen; Investigation, Phuong Ha Tran and Phung Phi Hoang; Methodology, Phuong Ha Tran; Project administration, Phuong Ha Tran; Supervision, Anh Kim Nguyen and Yuei-An Liou; Writing – original draft, Anh Kim Nguyen and Yuei-An Liou; Writing – review & editing, Yuei-An Liou.
Acknowledgments:
This research was financially supported by the VAST under the code VAST05.04/16-17, and partially
supported by MOST of Taiwan under the codes 107-2111-M-008-036 and 105-2221-E-008-056-MY3. Satellite
data are supported by United States Geological Survey (USGS).
Appendix A
Table A1.
Salinity information of 41 samples, among which 21 samples are used for training and 20
samples highlighted in grey color are used for validation.
No. Code X (UTM WS84) Y (UTM WS84) Salinity (ppm) Salinity – Electrical
Conductivity (dSm)
1 L.01 649531 1098282 29.8 0.05
2 P4N 654372 1081554 63.4 0.10
3 P5N 653173 1081562 133.8 0.21
4 P8 659690 1089314 141.8 0.22
5 MP06 634243 1092238 192.0 0.30
6 MP01 650832 1097403 199.0 0.31
7 MP05 640473 1095595 224.0 0.35
8 P2N 656426 1070927 228.8 0.36
9 P7N 658718 1082446 233.6 0.37
10 MP13 644985 1078898 271.0 0.42
11 MP08 630202 1085956 287.0 0.45
12 P5N2 653218 1081402 290.2 0.45
13 MP11 638932 1083668 308.8 0.48
14 L.02 651590 1094664 325.4 0.51
15 MP02 650585 1099018 367.7 0.57
16 P9-2 664137 1085331 381.8 0.60
17 MP10 632954 1077177 394.2 0.62
18 P10 664207 1082773 398.1 0.62
20 MP03 649479 1100892 406.4 0.64
21 P2N2 656415 1070929 410.2 0.64
22 MP07 629148 1096882 442.9 0.69
23 MP14 647257 1071374 464.3 0.73
24 MP04 648527 1100904 479.0 0.75
25 L.03 651590 1094664 480.3 0.75
26 L.05 654466 1092021 510.1 0.80
27 L.04 654689 1095002 530.6 0.83
28 P9 664121 1085370 933.1 1.46
29 L.07 654726 1087204 1023.4 1.60
30 P3N 657943 1076231 1926.4 3.01
31 L.13 654128 1061941 2208.0 3.45
32 P12 661696 1069167 2336.0 3.65
33 L11N 664955 1072706 2483.2 3.88
34 P13 652229 1066825 2790.4 4.36
35 L.12 662432 1063649 2982.4 4.66
36 L.14 649923 1061131 3321.6 5.19
37 L.11 662631 1058792 3366.4 5.26
38 L.15 646814 1062193 3430.4 5.36
39 L.10 669545 1062763 4819.2 7.53
40 L.08 667320 1069881 5248.0 8.20
41 L.09 671460 1068779 5958.4 9.31
References
1. Metternicht, G.; Zinck, A. Remote Sensing of Soil Salinization: Impact on Land Management,
CRC Press, 2008; ISBN 9781420065022.
2. Wiegand, L.; Rhoades, J.D.; Escobar, D.E.; Everitt, J.H. Photographic and videographic
observations for determining and mapping the response of cotton to soil salinity, Remote Sens.
Environ., 1994; vol. 49, no. 3, pp. 212–223.
3. http://www.iri.edu.ar/publicaciones_iri/anuario/CD%20Anuario%202008/Mayd/PNUMA.pdf
4. Metternicht, G.; Zinck, J. Remote sensing of soil salinity: potentials and constraints. Remote
Sensing of Environment., 2003; vol 85, pp. 1–20. DOI:10.1016/S0034-4257(02)00188-8
5. Nguyen, A. K.; Liou, Y.-A.; Li, M.-H.; Tran, T.A. Ecological Indicators, 2016, vol. 69, 100–117,
doi:10.1016/j.ecolind.2016.03.026.
6. Liou, Y.-A.; Nguyen, A.K.; Li, M.-H. Assessing spatiotemporal eco-environmental vulnerability
by Landsat data. Ecological Indicators, 2017, vol. 80, 52-65. doi:10.1016/j.ecolind.2017.04.055.
7. Verma, K.S.; Saxena, R.K.; Barthwal, A.K.; Deshmukh, S.N. Remote sensing technique for
mapping salt affected soils, Int. J. Remote Sens., 1994; vol. 15, no. 9, pp. 1901–1914.
8. Sommerfeldt, T.G.; Thompson, M.D.; Prout, N.A. Delineation and Mapping of Soil Salinity in
Southern Alberta from Landsat Data, Can. J. Remote Sens., 1984; vol. 10, no. 2, pp. 104–110.
9. Douaoui, E.K.; Nicolas, H.; Walter, C. Detecting salinity hazards within a semiarid context by
means of combining soil and remote-sensing data, Geoderma., 2006; vol. 134, no. 1, pp. 217–
10. Sumfleth, K.; Duttmann, R. Prediction of soil property distribution in paddy soil landscapes
using terrain data and satellite information as indicators, Ecol. Indic., 2008; vol. 8, no. 5, pp.
485–501.
11. Allbed, A.; Kumar, L. Soil Salinity Mapping and Monitoring in Arid and Semi-Arid Regions
Using Remote Sensing Technology: A Review, Adv. Remote Sens., 2013; vol. 2, no. December,
pp. 373–385.
12. Csillag, F.; Pásztor, L.; Biehl, L.L. Spectral band selection for the characterization of salinity
status of soils, Remote Sens. Environ., 1993; vol. 43, no. 3, pp. 231–242.
13. Millington, A.C.; Drake, N.A.; Townshend, J.R.G.; Quannby, N.A.; Settle, J.J.; Reading, A.J.
Monitoring Salt Playa Dynamics Using TM Data”, IEE Trans. on Geoscience and R.S., 1989;
vol. 27, no 6.
14. Rao, R. M. et al. Spectral behaviour of salt-affected soils, Int. J. Remote Sens., 1995; vol. 16, no.
12, pp. 2125–2136.
15. Singh, R.P.; Sirohi, A. Spectral reflectance properties of different types of soil surfaces, ISPRS J.
Photogramm. Remote Sens., 1994; vol. 49, no. 4, pp. 34–40.
16. CGIAR Research Centers in Southeast Asia. The drought and salinity intrusion in the Mekong
River Delta of Vietnam. Assessment Report. 25-28 April 2016, Ben Tre, Tra Vinh, Kien Giang,
Vietnam.
17. Khan, N.M.; Rastoskuev, V.V.; Shalina, E.V.; Sato, Y. Mapping Salt-affected Soils Using
Remote Sensing Indicators - A Simple Approach With the Use of GIS IDRISI, Ratio., 2001; no.
November, pp. 5–9.
18. Abbas, A.; Khan, S. (2007) Using Remote Sensing Techniques for Appraisal of Irrigated Soil
Salinity. In: Oxley, L. and Kulasiri, D., Eds., MODSIM 2007 International Congress on
Modelling and Simulation, Modelling and Simulation Society of Australia and New Zealand,
December 2007, 2632-2638.
19. Khan, N.M.; Rastoskuev, V.V.; Sato, Y.; Shiozawa, S. Assessment of hydrosaline land
degradation by using a simple approach of remote sensing indicators, Agric. Water Manag.,
2005; vol. 77, no. 1, pp. 96–109.
20. Alhammadi, M.S.; Glenn, E.P. Detecting date palm trees health and vegetation greenness change
on the eastern coast of the United Arab Emirates using SAVI, Int. J. Remote Sens., 2008; vol.
29, no. 6, pp. 1745–1765.
21. Dehni, A.; Lounis, M. Remote sensing techniques for salt affected soil mapping: Application to
the Oran region of Algeria, Procedia Eng., 2012; vol. 33, no. September 2015, pp. 188–198.
22. Chhabra, R. Soil salinity and water quality. Balkema, Rotterdam,The Netherlands(1996)
23. Elnaggar, A.; Noller, J.S. Application of remote-sensing data and decision-tree analysis to
mapping salt-affected soils over large areas, Remote Sens., 2010; vol. 2, no. 1, pp. 151–165.
24. Noroozi, A.A.;Homaee, M.; Farshad, A. Integrated application of remote sensing and spatial
statistical models to the identification of soil salinity: a case study from Garmsar Plain, Iran. J.
Environ. Sci., 9 (2012), pp. 59-74.
25. Abdul-Qadir, A.M.; Benni, T.J. Monitoring and evaluation of soil salinity term of spectral
response using Landsat images and GIS in Mesopotamian plain Iraq J. Desert Stud., 2(2010), pp.