Method Specific Calibration Corrects for DNA
Extraction Method Effects on Relative
Telomere Length Measurements by
Quantitative PCR
Luise A. Seeker1,2*, Rebecca Holland3, Sarah Underwood3, Jennifer Fairlie3,
Androniki Psifidi2, Joanna J. Ilska1, Ainsley Bagnall4, Bruce Whitelaw2, Mike Coffey1,
Georgios Banos1,2, Daniel H. Nussey3
1 Animal & Veterinary Sciences, SRUC, Roslin Institute Building, Easter Bush, Midlothian EH25 9RG,
United Kingdom, 2 The Roslin Institute and Royal (Dick) School of Veterinary Studies, University of Edinburgh, Easter Bush, Midlothian, United Kingdom, 3 Institute of Evolutionary Biology, School of Biological Sciences, University of Edinburgh, Edinburgh, Midlothian, United Kingdom, 4 SRUC Crichton Royal Farm, Glencaple Road, Dumfries, United Kingdom
Abstract
Telomere length (TL) is increasingly being used as a biomarker in epidemiological, biomed-ical and ecologbiomed-ical studies. A wide range of DNA extraction techniques have been used in telomere experiments and recent quantitative PCR (qPCR) based studies suggest that the choice of DNA extraction method may influence average relative TL (RTL) measurements. Such extraction method effects may limit the use of historically collected DNA samples extracted with different methods. However, if extraction method effects are systematic an extraction method specific (MS) calibrator might be able to correct for them, because sys-tematic effects would influence the calibrator sample in the same way as all other samples. In the present study we tested whether leukocyte RTL in blood samples from Holstein Frie-sian cattle and Soay sheep measured by qPCR was influenced by DNA extraction method and whether MS calibration could account for any observed differences. We compared two silica membrane-based DNA extraction kits and a salting out method. All extraction meth-ods were optimized to yield enough high quality DNA for TL measurement. In both species we found that silica membrane-based DNA extraction methods produced shorter RTL mea-surements than the non-membrane-based method when calibrated against an identical cal-ibrator. However, these differences were not statistically detectable when a MS calibrator was used to calculate RTL. This approach produced RTL measurements that were highly correlated across extraction methods (r>0.76) and had coefficients of variation lower than 10% across plates of identical samples extracted by different methods. Our results are con-sistent with previous findings that popular membrane-based DNA extraction methods may lead to shorter RTL measurements than non-membrane-based methods. However, we also demonstrate that these differences can be accounted for by using an extraction method-specific calibrator, offering researchers a simple means of accounting for
a11111
OPEN ACCESS
Citation: Seeker LA, Holland R, Underwood S,
Fairlie J, Psifidi A, Ilska JJ, et al. (2016) Method Specific Calibration Corrects for DNA Extraction Method Effects on Relative Telomere Length Measurements by Quantitative PCR. PLoS ONE 11 (10): e0164046. doi:10.1371/journal.
pone.0164046
Editor: Franc¸ois Criscuolo, Centre National de la
Recherche Scientifique, FRANCE
Received: March 23, 2016 Accepted: September 19, 2016 Published: October 10, 2016
Copyright:©2016 Seeker et al. This is an open access article distributed under the terms of the
Creative Commons Attribution License, which
permits unrestricted use, distribution, and reproduction in any medium, provided the original author and source are credited.
Data Availability Statement: Data is available at
https://laseeker.github.io/DNAextractionTelomeres/
.
Funding: Our work was funded by the
differences in RTL measurements from samples extracted by different DNA extraction methods within a study.
Introduction
Telomere shortening has recently been identified as one of nine ‘hallmarks of aging’ [1] and blood cell telomere length (TL) is an increasingly widely measured biomarker in human epide-miology and vertebrate ecology [2–4]. Many methods are available to measure TL, each with their own strengths and drawbacks [5,6]. Quantitative PCR (qPCR)-based methods have become increasingly popular in recent years, presumably due to their being faster, cheaper and requiring less DNA than most other methods [5,6]. However, the qPCR method has draw-backs, notably a lower repeatability compared to terminal restriction fragment (TRF) southern blot [7,8] and the relative units of measurement, which makes comparison across studies and species extremely challenging [5,7] if not impossible. Furthermore, there is mounting recent evidence that relative TL (RTL) measurements by qPCR may be influenced by methods of sam-ple acquisition and storage [9] and DNA extraction methods [10–14]. Understanding how such methodological variation may influence RTL measurements by qPCR both within and among laboratories is essential for evaluating and comparing results of telomere studies.
A central requirement of all methods of TL measurement is the extraction of a suitable quantity of high quality DNA. A considerable number of DNA extraction methods have been employed to date by researchers studying TL [10]. In general two different types of DNA extraction methods can be distinguished: One uses a solid phase such as silica membranes or magnetic beads. DNA binds to the solid phase, is washed and then eluted. The other type is based on the transition of DNA between different solvents. Those methods (for example salting out or phenol-chloroform extractions) do not require a solid phase. The question that arises from the literature is whether solid phases act as physical barriers that shear DNA and there-fore cause shorter TL measurements. Two recent studies using human blood samples with the qPCR method suggested that silica membrane-based DNA extraction methods yield shorter RTL measurements than other methods [10,11]. Two further studies have reported differences in mean TL from DNA extracted using a range of different methods, although these differences were not specifically linked to the use of silica membranes [12,13]. Recently, another study found that RTL from samples extracted by a magnetic bead method was shorter when com-pared to salting out and phenol chloroform [14]. Although it is obviously desirable to keep methodology as consistent as possible, potentially valuable and informative archived DNA samples may be available to researchers interested in telomere dynamics which may not have been extracted by the same technique. In such cases, understanding and potentially accounting for the effects of extraction method on TL measurement is essential [15]. Furthermore, a better understanding of such methodological effects could help ensure appropriate aspects of DNA preparation methodology are accounted for in meta-analyses of TL studies [10].
The qPCR method measures RTL as the total amount of telomeric sequence relative to the amount of a non-variable copy reference gene sequence within the same DNA sample [16]. Standard methods for calculating RTL require a calibrator sample (also called “reference sam-ple” [16] or “golden sample” [6]), which is an identical DNA sample included on every qPCR plate for both telomere and reference gene reactions. Sample RTL is expressed relative to the calibrator to account for random measurement error and resulting plate-to-plate variation. A wide range of samples have been used as calibrators: DNA from a chosen individual, pooled
supported by the National Trust for Scotland
(http://www.nts.org.uk/Home/) and the National
Environment Research Council (http://www.nerc.
ac.uk/). The funders had no role in study design,
data collection and analysis, decision to publish, or preparation of the manuscript.
Competing Interests: The authors have declared
DNA from several individuals [16] or commercially available DNA [14]. Previous studies examining effects of DNA extraction method on RTL appear to have used a single calibrator, extracted by one identical method [10–14]. They observed extraction method dependent differ-ences in RTLs that in some studies appear to be not random but systematic [10,11,14]. In prin-ciple, it should be possible to account for such systematic extraction method effects by taking the same calibrator sample and extracting DNA from it using different methods to match the methods used on the samples in the study. With this approach, the calibrator should be influ-enced in the same direction and to a similar degree by the extraction method. Using such a DNA extraction method specific calibrator in RTL calculations, could therefore adjust for any effect of extraction method on the samples’ telomere length. The effectiveness of this approach has yet to be tested.
The objective of the present study was to assess the effect of two different DNA extraction methods, and the use of different calibrators on RTL measurements. We compared RTL mea-surements of blood samples that were collected from a Holstein Friesian cattle population after extracting DNA using two silica membrane-based DNA extraction protocols and a salting out (non-membrane-based) method. To validate our results with samples from a different species we compared one of the two silica membrane-based methods with the salting out method using buffy coat samples from wild Soay sheep. We found high repeatability of RTL measure-ments, regardless of DNA extraction method, and no difference in mean RTL among extrac-tion methods when a DNA extracextrac-tion method specific (MS) calibrator was used.
Materials and Methods
Study systems & sampling
Whole blood samples were collected from Holstein Friesian cattle during 2009–2013 at the Crichton Royal Farm (Dumfries, Scotland) as part of a long-term genetics study for which blood samples have been archived for many years [17]. Samples were taken by venepuncture using EDTA as anticoagulant and were stored at -30°C until DNA extraction. We selected 72 samples from animals among which both sexes and a range of ages were represented (45 females aged 0–9 years and 27 male new-born calves).
Additionally, we used blood samples collected from a wild population of Soay sheep on the St Kilda archipelago in the Outer Hebrides (Scotland), which have been subject to individual-based monitoring and regular sampling since 1985 [18]. Blood samples were taken by vene-puncture in August 2013, using heparin as an anticoagulant. Buffy coat fractions were prepared as follows: whole blood samples were centrifuged at 3,000 rpm for 10 minutes. The plasma layer was removed and remaining cells were washed by adding 0.9% NaCl solution. After cen-trifugation for 10 minutes at 3,000 rpm the intermediate buffy coat layer was collected, trans-ferred to a 1.5 ml Eppendorf tube and stored at -20°C until further use. We selected samples from 48 different females aged 4–13 years for DNA extraction.
Ethics statement
Blood sampling from Holstein Friesian cattle and Soay sheep was approved by the Animal Experiments Committee (UK Home Office Project License Numbers: PPL 60/4278 and 60/ 3547, respectively).
DNA extraction
QIAGEN DNeasy Blood & Tissue kit: spin column (SC) and the 96-well plate (SP). DNA from each sheep sample was extracted using the PG and SC protocols.
According to the PG protocol, DNA is first isolated by removing red blood cells and lysing white blood cells. RNA and proteins are removed by enzyme digestion and salt precipitation, respectively. DNA is recovered by alcohol precipitation and dissolved in DNA hydration solu-tion. The SC and SP protocols rely on a silica-based extraction method during which cells are lysed and transferred onto silica membranes to which DNA binds specifically during a centri-fugation step. DNA is washed and finally eluted using a DNA hydration buffer. When possible, we performed different DNA extraction methods simultaneously on each sample. We followed the manufacturer’s protocol with certain alterations to improve yield and quality of DNA sam-ples. The most important alternation was that the silica protocols were started with a red blood cell lysis step that allowed us after centrifugation to transfer only the white blood cell pellet dis-solved in PBS onto the silica membranes. This step removed impurities in the beginning of the protocol and improved purity measurements greatly. SC samples were also prepared in dupli-cates that were run through the same silica membrane to improve DNA yield. All alternations are detailed inS1 File. Fifteen cattle samples extracted by PG had to be re-purified following appendix C of the manufacturer’s manual.
Quality control of DNA extracts
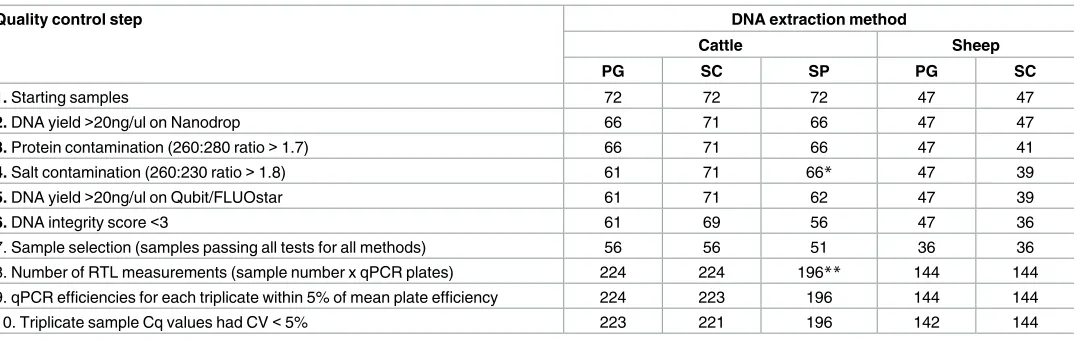
We employed a strict quality control (QC) strategy during DNA extraction and qPCR to ensure that samples extracted by different methods were of similar quality, purity and integrity. Our aim was to minimize the risk of differences between DNA extraction measurements being due to sample quality rather than differences of methods themselves. Samples failing QC were excluded from our final analyses (Table 1).
We tested DNA yield and purity using a NanoDrop ND-1000 spectrophotometer (Thermo Scientific) with the software NanoDrop 2000. Samples with DNA concentrations less than 20 ng/μl were excluded from further investigation (Table 1). The average ratio of absorbance at 260 nm over 280 nm (OD 260/280) over two measurements was used to check for protein con-tamination and the average ratio at 260nm over 230nm (OD 260/230) was used to check for
Table 1. Number of samples after each quality control step by species and method of DNA extraction.
Quality control step DNA extraction method
Cattle Sheep
PG SC SP PG SC
1. Starting samples 72 72 72 47 47
2. DNA yield>20ng/ul on Nanodrop 66 71 66 47 47
3. Protein contamination (260:280 ratio>1.7) 66 71 66 47 41
4. Salt contamination (260:230 ratio>1.8) 61 71 66* 47 39
5. DNA yield>20ng/ul on Qubit/FLUOstar 61 71 62 47 39
6. DNA integrity score<3 61 69 56 47 36
7. Sample selection (samples passing all tests for all methods) 56 56 51 36 36
8. Number of RTL measurements (sample number x qPCR plates) 224 224 196** 144 144
9. qPCR efficiencies for each triplicate within 5% of mean plate efficiency 224 223 196 144 144
10. Triplicate sample Cq values had CV<5% 223 221 196 142 144
PG = Gentra Puregene Kit; SC = Spin Column protocol (DNeasy Blood & Tissue Kit); SP = Spin Plate protocol (DNeasy Blood & Tissue Kit) *This step did not apply to SP.
salt contamination. Both proteins and some salts can act as qPCR inhibitors [19]. Extracts with OD 260/280<1.7 or OD 260/230<1.8 were excluded from further analyses for PG and SC methods. For SP, OD 260/230 readings were variable probably due to samples with low yields approaching the limit for accurate contaminant detection. We therefore decided not to exclude SP samples based on OD 260/230, although we applied the same OD 260/280 QC threshold as for the other methods. Note that results obtained from SP extracted samples behaved very sim-ilarly to the SC samples, despite the variable OD 260/230 ratios (seeResults).
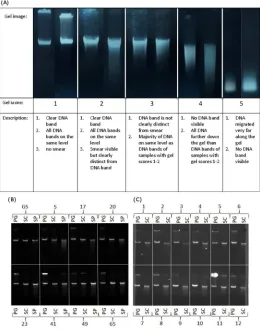
To assess DNA concentrations more accurately all PG and SC extracts were subsequently measured on a Qubit12.0 (Invitrogen) using a Qubit1dsDNA BR Assay kit (Invitrogen) according to the manufacturer’s manual. SP extracts were measured on a FLUOstar Galaxy microplate reader (BMG LABTECH) using a Quant-iT™ dsDNA Assay Kit (Invitrogen) follow-ing the manufacturer’s instructions. Both procedures are based on the detection of a fluorophore that becomes fluorescent when bound to double stranded DNA. Measurements are evaluated in relation to standards with known DNA concentrations. Because the signal is specific for double stranded DNA (dsDNA) fluorescence spectroscopy measurements are more accurate for DNA yield than NanoDrop measurements. Samples with average concentrations lower than 20 ng/μl calculated over two measurements on either fluorometer were excluded from further investiga-tion. DNA integrity was assessed visually by running 200ng on a 0.5% agarose gel with ethidium bromide at a final concentration of 0.8 μg/ml. Gels were run at 100 mV and 200 mA for 45 min-utes and then visualised with an AlphaImager TM 2200. Gels were visually scored for integrity on a scale of 1 to 5 (Fig 1A) and extracts with a score greater than 2 were removed from further analyses. DNA stock solutions were prepared by diluting extracts to a concentration of 10 ng/μl based on fluorescence measurements. PG extracts were diluted in DNA hydration solution (QIAGEN), and SC and SP extracts were diluted in buffer AE (QIAGEN).
Telomere length measurement
Leukocyte RTL was measured by qPCR [16] as the amount of telomeric DNA in a sample rela-tive to the amount of a non-variable copy number reference gene. In order to identify the most appropriate reference gene we conducted preliminary analyses considering a variety of candi-date reference gene primer pairs. The most consistent amplification profile and cleanest melt-ing curve was obtained in both species usmelt-ing Primerdesign primers targetmelt-ing the beta-2-microglobulin (B2M) gene (accession number: NM_001009284), which we selected as our reference gene. The selection of our reference gene was based on comparison of a panel of 12 candidate genes for sheep and 6 for cattle, supplied as part of the Primerdesign GeNorm kit (following Fairlie et al. 2016). B2M showed completely stable qPCR results indicative of non-variable copy number, and is well conserved and located on chromosome 10 of the bovine genome and chromosome 7 of the ovine genome [20,21]. For the telomere amplification, tel 1b (CGG TTT GTT TGG GTT TGG GTT TGG GTT TGG GTT TGG GTT) and tel 2b (GGC TTG CCT TAC CCT TAC CCT TAC CCT TAC CCT TAC CCT) primers were used [22]. Telomere primers were manufactured and purified with high performance liquid chromatography by Integrated DNA Technologies (IDT, Glasgow, UK).
cattle, PG and SC for sheep. In the cattle experiment, each qPCR plate included three calibrator samples, one for each of the extraction methods used (i.e., calibrator samples extracted with PG, SC and SP methods). In the sheep experiment, we only included the MS calibrator on each plate (i.e. PG-extracted calibrator on plates of PG-extracted samples and SC-extracted calibra-tor on plates of SC-extracted samples).
Samples and calibrators were loaded at a dilution of 1 ng/μl onto a 96 well plate (sample plate) that also contained a four step 1:4 serial dilution of calibrator DNA starting with 10 ng/ μl as standard and nuclease free water as non-template control. A Freedom EVO 2150 robot (by TECAN) was used to transfer all samples, standards, calibrators and negative controls in triplicate onto a 384 well qPCR plate. The robot mixed 1 μl of the contents of the sample plate with 9 μl of master mix in each qPCR plate well. The master mix for both reactions contained 5 μl of LightCycler 480 SYBR Green I Master (Roche) per well. Telomere primers were used at a concentration of 900 nmol,B2Mprimers were used at 300 nmol. Nuclease-free water was added to the master mix to have a final volume of 10 μl per well.
The qPCR was performed on a LightCycler 480 (Roche) using the following protocol: Enzyme activation: 15 min at 95°C; then 50 cycles of: 15 s at 95°C (denaturation), 30s at 58°C (primer annealing), 30 s at 72°C (signal acquisition); melting curve: 1 min at 95°C, 30s at 58°C, Fig 1. DNA integrity gels. (A) Illustrative DNA Integrity gels with gel scores. Example integrity gels for (B)
Holstein Friesian cattle and (C) Soay sheep. Individual samples (represented by numbers in image) that were extracted with different DNA extraction protocols. (PG: Gentra Puregene kit, SC: DNeasy spin columns, SP: DNeasy 96 well plate; GS: calibrator DNA (“golden sample”).
then continuous increase of temperature (0.11°C/s) to 95°C with continuous signal acquisition; Cool down: 10 s at 40°C. Melting curves showed a single peak withB2Mprimers rarely forming primer dimers in the negative controls. Telomere primers always form primer dimers due to the repetitive nature of their sequence. Evidence for primer dimer formation can be seen as melting peaks at slightly higher melting temperatures than the telomere qPCR product and also as amplification curves at very late cycles (average Cq for telomere negative controls: 38.1 (cattle) and 31.3 (sheep) compared to average Cq values of samples: 14.42 (SD = 0.76, cattle) and 13.52 (SD = 0.51, sheep)).
The software package LinRegPCR [23] was used to correct amplification curves for an esti-mated fluorescence baseline. The software also calculated well-specific amplification efficiencies. We used the mean efficiency across all wells on a plate, having excluded the upper and lower 5th percentiles, as our reaction efficiency for each amplicon group [23]. The mean qPCR efficiencies across plates calculated with LinRegPCR ranged between 93.1%-94.2% (cattle) and 93.5%-94.0% (sheep) for theB2Mreaction, and 93.6%- 94.4% (cattle) and 92.5%-95.5% (sheep) for the telomere reaction. We set a constant fluorescence threshold within the window of linearity across all plates for the calculation of Cq values. The threshold was forB2M0.221 in cattle and 0.1 in sheep and for the telomere amplification 0.256 and 0.1 in cattle and sheep, respectively.
We calculated mean qPCR efficiencies separately for both amplicon groups (B2Mand telo-mere reaction) for each qPCR plate using LinRegPCR. Samples were excluded from final analy-sis if at least one of their triplicate amplifications had a qPCR efficiency that was 5% higher or lower than the mean efficiency for the respective amplicon. Also, samples were excluded if their Cq values had a coefficient of variation (CV)>5% across triplicates. Elimination of sam-ples that failed quality control for qPCR efficiency or Cq values ensured high intra-plate repeat-abilities and efficiencies, although less than 1% of our samples were excluded based on these criteria (seeTable 1).
RTL was calculated using following formula described by Pfaffl [24]:
RTL¼ E
CqTELðCalibratorÞ CqTELðSampleÞ TEL
ECqB2MðCalibratorÞ CqB2MðSampleÞ
B2M
where ETELand EB2Mare the reaction efficiencies for the plate for the respective amplicon group calculated by LinRegPCR; CqTEL[Calibrator]and CqB2M[Calibrator]are the mean Cq values across triplicates for the telomere andB2Mreactions, respectively, for the plate’s calibrator sample; and CqTEL[Sample]and CqB2M[Sample]are the mean Cq values across triplicates for telo-mere andB2Mreactions, respectively, for the focal cattle or sheep sample.
Statistical Analysis
Each sample was run on four identical qPCR plates per DNA extraction method. We calculated the Pearson’s correlation coefficient for the individual RTL measurements between all possible plate combinations. We took the average RTL for a sample across the four plates within each extraction method and calculated the Pearson’s correlation coefficient among methods. We calculated the CV–i.e. the standard deviation divided by the mean—across replicates of each sample both across all plates and within plate using the same extraction method. Pooled CVs across samples were calculated as the geometric mean CV.
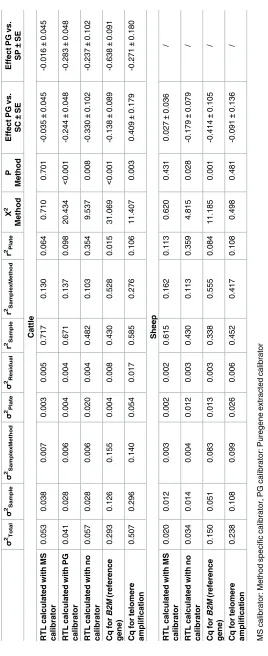
Linear mixed models were used to estimate the repeatability of RTL measurements and Cq values for a given sample, the degree of plate to plate variation, and the effect of DNA extrac-tion method on mean RTL. The model of analysis included the random effects of sample, sam-ple-by-extraction method interaction and plate, and the fixed effect of DNA extraction method. Variance components for the random effects were estimated using restricted maxi-mum likelihood. The sum all variance components constituted the total phenotypic variance. The repeatability of sample RTL across plates and methods was calculated as the ratio of the sample variance to the total phenotypic variance. The ratio of the sample-by-extraction method interaction to total phenotypic variance provided an estimate of the proportion of variance attributable to differences in RTL among extraction methods within a sample, whereas the ratio of the plate effect to total phenotypic variance expressed the proportion of variance attrib-utable to differences in the mean RTL among plates. We tested the significance of any differ-ences in mean RTL associated with DNA extraction method by comparing models with and without extraction method as a fixed effect using a likelihood ratio test. We ran separate models for RTL calculated using MS calibrators (both species), PG calibrators (cattle only) and no cali-brator (both species). We made the same comparisons for the reference gene and telomere Cq values in both species. All statistical analyses were performed in R Studio with R 3.1.2 [25] with mixed-effects models being implemented using the ‘lme4’ library.
Results
DNA yield and integrity with different DNA extraction methods
A total of 56 of our PG and SC cattle samples, 51 of our SP cattle samples, and 36 of our sheep samples passed all quality controls for all DNA extraction methods and were used for RTL mea-surement (resulting in RTL meamea-surements for a total of 235 DNA samples;Table 1). DNA yield was method dependent. The non-silica membrane-based PG extraction kit yielded the highest DNA concentrations (cattle: mean = 341 ± 6 ng/μl; sheep: mean = 282.6 ±2 ng/μl) and highest total yields of DNA (cattle: mean = 76 ± 2 μg; sheep: mean = 74 ±1 μg). The SC method produced substantially lower yields (cattle: mean concentration = 120 ± 2 ng/μl, mean total yield =
12 ± 0.2 μg; sheep: mean concentration = 68 ±1 ng/μl, mean total yield = 15 ±0.2 μg) and the SP method lower still (cattle: mean concentration = 38 ±0.6 ng/μl; mean total yield = 3 ±0.05 μg). However, initial whole blood volumes of cattle varied between DNA extraction methods (PG: 3 ml, SC: 600 μl, SP: 300 μl), whereas the same volumes of sheep buffy coat were used in all cases. We also noticed that DNA integrity gels varied in appearance across extraction methods
(Fig 1B). PG extracts showed the cleanest bands with no signs of smears and thus no signs of
Repeatability of telomere length measurements & effects of DNA
extraction method
We found relatively high correlation coefficients and low CVs across plates for RTL measure-ments of the same sample in both species. All correlation estimates both within DNA extrac-tion method (across plates) and between methods for the two species are summarized inS2 File. Correlations among RTL measurements from the same sample, calculated using a MS cali-brator, among plates ranged from 0.87 to 0.96 for cattle, and 0.83 to 0.93 for sheep (S2 File). Correlations between average RTL measurements derived from different extraction methods and using different calibrators are summarised inFig 2. Using a MS calibrator, correlations between the PG and SC methods were 0.85 for cattle and 0.77 for sheep, whilst in cattle the cor-relation between PG and SP was 0.78 and between SC and SP 0.87 (Fig 2). The correlation coef-ficients were comparable when a PG calibrator or no calibrator was used for RTL calculation
(Fig 2). However, when fitting regression lines among samples extracted using different
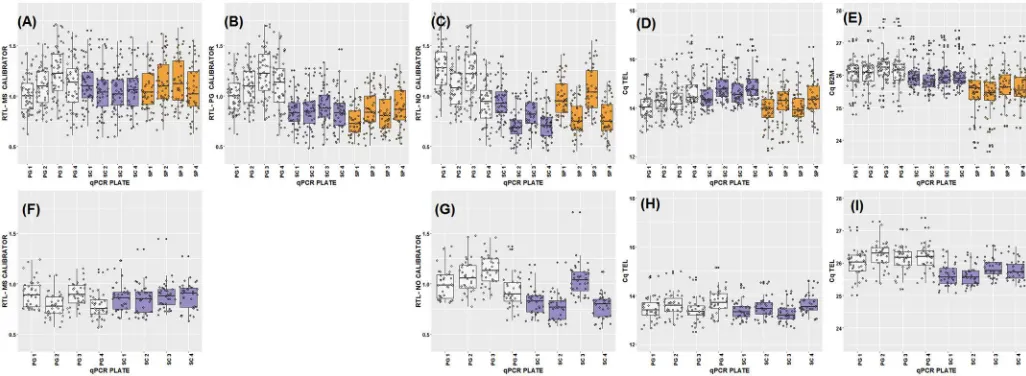
Fig 2. Correlations between methods. Correlations between RTL measurements from different DNA
extraction methods (PG: Gentra Puregene kit; SC: DNeasy spin columns; SP: DNeasy 96 well plate): Cattle, specific calibrator (A); Cattle, Puregene calibrator (B); Cattle, no calibrator (C); Sheep, method-specific calibrator (D); Sheep, no calibrator (E). Regression lines and their 95% confidence interval are shown in blue and grey, respectively, with red lines reflecting a hypothetically perfect correspondence (slope of one, intercept of zero).
methods, application of the MS calibrator clearly produces regression slopes much closer to one with intercepts close to the origin (Fig 2). The average CV across all plates was 8.2% in cat-tle (12 plates, 3 methods), and 8.1% in sheep (8 plates, 2 methods). Within extraction method, CVs across plates were 9.2% and 8.2% for PG, 5.1% and 4.5% for SC, for cattle and sheep, respectively, and 5.2% for the SP in cattle only.
In both cattle and sheep, we found significantly (P<0.05) higher mean RTL in samples extracted using the non-membrane-based method (PG) compared to those extracted with the silica membrane-based methods (SC and SP), when using either the PG calibrator or no cali-brator in calculations (Fig 3,Table 2). This reflects genuine underlying differences in the aver-age TL among DNA extracted from the same sample by different methods, as has been reported elsewhere [10,11]. These differences are underpinned by either or both lower telo-meric Cq and higher reference gene Cq values in the PG extracted samples compared to the other methods (Fig 3D, 3E, 3H & 3I). In both species, there was notable variation in the telo-meric Cq values across plates run on the same day, with the first plate having lower values than the second (Fig 3D & 3H). As would be expected, application of a plate-specific calibrator (either PG or MS calibrators) removed the within-day variation in RTL and substantially reduced among-plate variation (Table 2;Fig 3). Importantly, the differences in mean RTL among extraction methods became non-significant and sample repeatabilities were increased when a MS calibrator was used to calculate RTL (Fig 3,Table 2). This shows that using a MS calibrator to calculate RTL can account for observed effects of DNA extraction method on the underlying Cq values (Table 2;Fig 3).
Discussion
In the present study, we addressed the effect of DNA extraction method on RTL measurements by comparing two silica membrane-based kits (SC and SP) with a kit that uses a non-mem-brane-based salting out method (PG). As expected [26], we found that the salting out method produced higher DNA yields and that silica membrane-based methods were associated with some observable loss of DNA integrity (Fig 1). A number of studies using human blood sam-ples report significant differences in mean RTL depending on the DNA extraction method Fig 3. Raw RTL and Cq values. RTL or Cq values by DNA extraction method and qPCR plate for cattle (A-E) and sheep (F-I). RTL calculated with
method specific (MS) calibrator (A + F), Puregene (PG) calibrator (B), no calibrator (C+G). Cq values for telomere reaction (D+H) and control gene
B2M (E+I). Colours represent DNA extraction methods. White: Gentra Puregene, blue: DNeasy spin columns, orange: DNeasy 96 well plate.
used [10–14]. We found that silica membrane-based DNA extraction methods produced shorter RTL measurements on average than the salting out method in both cattle and sheep. This is consistent with two previous studies in humans, which argued that silica membrane based DNA extraction methods reduce average RTL [10,11]. However, the physical and bio-chemical causes of these observed extraction method effects on RTL measurements are cur-rently unknown, and determining these causes is an important next step for research in this area.
We found that the rank order of RTL measurements among samples is largely unaffected by DNA extraction methods. Across extraction methods, our RTL measures showed reasonably high repeatabilities and inter-plate correlations and low inter-plate CVs that were close to those reported in the qPCR telomere literature [7,14,16]. The aforementioned studies on human samples do not offer clear insight into how extraction methods affect the rank order of RTL measurements. One study reported relatively high correlations among samples extracted by QIAmp spin columns (QIAGEN) versus a magnetic bead extraction (Spearman’s ρ = 0.71) [11]; another study found a moderate correlation between a magnetic bead and a salting out extraction (Pearson’s r = 0.54)[14]. A third study found very low and not statistically signifi-cant correlations (r<0.21) [12], and two of the studies did not present among sample correla-tions [10,13]. The absence of a strong correlation among RTL measurements based on different DNA extraction methods is a profoundly alarming result for research on telomere dynamics. If rank order of RTL is generally altered by underlying aspects of sample preserva-tion, then associations among RTL and environmental, genetic and health measures within studies could themselves depend on the extraction method used. However, the one study reporting low correlations among RTLs based on different extraction method used DNA sam-ples that would have failed our QC criteria [12] and it seems likely that the low correlations may be the result of variation in the level of DNA impurities that might have acted as qPCR inhibitors. Our results show that, as long as rigorous QC criteria are applied throughout telo-mere measurement protocols, the rank order of samples is very largely preserved regardless of the DNA extraction method used, despite the distribution of RTL estimates changing (Fig 2). Failure to carefully monitor and control the integrity and purity of DNA is likely to result in increased sampling error which will reduce the repeatability of results both within and among studies of telomere dynamics.
is carefully controlled, calibrator samples derived from the same original sample but collected, stored or extracted in different ways could conceivably be used to control for systematic effects of variation in sample preparation on RTL.
It is obviously preferable to use a completely consistent approach and extract DNA using the same method within a study. However, a major challenge in the study of telomere dynamics is to generate sufficiently detailed longitudinal data to determine whether variation in TL observed later in life is the result of differences set in early life or differences in attrition rates across life [27]. Addressing this challenge in long-lived animals will inevitably require the use of long-term longitudinal archived samples, in which samples may have been stored or DNA extracted in different ways over time. Our calibrator-based approach could allow such valuable longitudinal samples to be compared within a single study, but it would need to be carefully validated each time it was applied. We would advocate applying similarly stringent quality con-trol on DNA integrity and purity as here, even though this may reduce available sample size. Before applying a method-specific calibrator approach to archived samples prepared in differ-ent ways, it would also be crucial to run a similar experimdiffer-ent to establish the repeatability of RTL measures among samples that have been experimentally exposed to the relevant differ-ences in sample collection, storage or DNA extraction.
Conclusion
This study adds to the emerging literature showing that DNA extraction methods may affect the mean RTL measurement produced by qPCR techniques. We present the first evidence for such effects in non-human vertebrates, documenting similar results in two ruminant species of considerable economic and agricultural importance in which TL variation has recently been examined with some exciting initial results [28–30]. We also show that RTL measurements derived from different DNA extraction methods are highly correlated when rigorous DNA quality control is applied. Our results also suggest that the application of method-specific cali-bration in qPCR studies of RTL could allow researchers to effectively use valuable historical archives of samples that have been prepared or extracted in different ways, accounting for effects of methodological variation on mean RTL.
Supporting Information
S1 File. Modified DNA extraction protocols. (DOCX)
S2 File. Correlations within and between DNA extraction methods. (DOCX)
Acknowledgments
We thank everyone involved in collecting blood samples on the Crichton farm, particularly Hannah Dykes and Isla McCubbin. We are grateful to Josephine Pemberton, Jill Pilkington, the 2013 August Soay sheep catch volunteers, and the SynthSys facility at the University of Edinburgh for support with telomere measurements. We also thank Ian Archibald for support with data handling, and Jarrod Hadfield for helpful discussions and statistical advice.
Author Contributions
Conceptualization: LS RH SU JF AP JI BW MC GB DN.
Formal analysis: LS GB DN.
Funding acquisition: GB DN MC BW.
Investigation: LS JF AP.
Methodology: LS RH SU JF AP.
Project administration: GB.
Resources: AB MC.
Supervision: GB DN MC BW.
Validation: GB DN.
Visualization: LS.
Writing – original draft: LS DN.
Writing – review & editing: SU JF AP JI MC GB.
References
1. Lo´pez-Otı´n C, Blasco M a., Partridge L, Serrano M, Kroemer G. XThe hallmarks of aging. Cell. 2013; 153(6).
2. Blackburn EH, Epel ES, Lin J. Human telomere biology: A contributory and interactive factor in aging, disease risks, and protection. Science (80-) [Internet]. 2015; 350(6265):1193–8. Available:http://www. sciencemag.org/content/350/6265/1193doi:10.1126/science.aab3389PMID:26785477
3. Monaghan P, Haussmann MF. Do telomere dynamics link lifestyle and lifespan? Trends Ecol Evol. 2006; 21(1):47–53. doi:10.1016/j.tree.2005.11.007PMID:16701469
4. Monaghan P. Organismal stress, telomeres and life histories. J Exp Biol [Internet]. 2014; 217(Pt 1):57– 66. Available:http://www.ncbi.nlm.nih.gov/pubmed/24353204doi:10.1242/jeb.090043PMID: 24353204
5. Aubert G, Lansdorp PM. Telomeres and aging. Physiol Rev. 2008; 88(2):557–79. doi:10.1152/ physrev.00026.2007PMID:18391173
6. Nussey DH, Baird D, Barrett E, Boner W, Fairlie J, Gemmell N, et al. Measuring telomere length and telomere dynamics in evolutionary biology and ecology. Leder E, editor. Methods Ecol Evol [Internet]. 2014 Feb 2 [cited 2014 Mar 20]; 5(4):299–310. Available:http://doi.wiley.com/10.1111/2041-210X. 12161doi:10.1111/2041-210X.12161PMID:25834722
7. Aviv a., Hunt SC, Lin J, Cao X, Kimura M, Blackburn E. Impartial comparative analysis of measurement of leukocyte telomere length/DNA content by Southern blots and qPCR. Nucleic Acids Res [Internet]. 2011; 39(20):e134–e134. Available:http://nar.oxfordjournals.org/lookup/doi/10.1093/nar/gkr634doi: 10.1093/nar/gkr634PMID:21824912
8. Martin-Ruiz CM, Baird D, Roger L, Boukamp P, Krunic D, Cawthon R, et al. Reproducibility of telomere length assessment: an international collaborative study. Int J Epidemiol [Internet]. 2014;1–11. Avail-able:http://www.ije.oxfordjournals.org/cgi/doi/10.1093/ije/dyu191
9. Zanet DL, Saberi S, Oliveira L, Sattha B, Gadawski I, Coˆte´ HCF. Blood and dried blood spot telomere length measurement by qPCR: assay considerations. PLoS One [Internet]. 2013; 8(2):e57787. Avail-able:http://www.pubmedcentral.nih.gov/articlerender.fcgi?artid=3581490&tool=
pmcentrez&rendertype=abstractdoi:10.1371/journal.pone.0057787PMID:23451268
10. Cunningham JM, Johnson R a, Litzelman K, Skinner HG, Seo S, Engelman CD, et al. Telomere length varies by DNA extraction method: implications for epidemiologic research. Cancer Epidemiol Biomark-ers Prev [Internet]. 2013 Nov [cited 2014 Apr 2]; 22(11):2047–54. Available:http://www.ncbi.nlm.nih. gov/pubmed/24019396doi:10.1158/1055-9965.EPI-13-0409PMID:24019396
11. Hofmann JN, Hutchinson AA, Cawthon R, Liu C-S, Lynch SM, Lan Q, et al. Telomere Length Varies by DNA Extraction Method: Implications for Epidemiologic Research—Letter. Cancer Epidemiol Biomark-ers Prev [Internet]. 2014; 23:1129–30. Available: http://cebp.aacrjournals.org/cgi/doi/10.1158/1055-9965.EPI-14-0145doi:10.1158/1055-9965.EPI-14-0145PMID:24798729
13. Tolios A, Teupser D, Holdt LM. Preanalytical Conditions and DNA Isolation Methods Affect Telomere Length Quantification in Whole Blood. PLoS One [Internet]. 2015; 10(12):e0143889. Available:http:// dx.plos.org/10.1371/journal.pone.0143889doi:10.1371/journal.pone.0143889PMID:26636575
14. Raschenberger J, Lamina C, Haun M, Kollerits B, Coassin S, Boes E, et al. Influence of DNA extraction methods on relative telomere length measurements and its impact on epidemiological studies. Sci Rep [Internet]. Nature Publishing Group; 2016; 6(April):25398. Available:http://www.nature.com/articles/ srep25398doi:10.1038/srep25398PMID:27138987
15. Tackney J, Cawthon RM, Coxworth JE, Hawkes K. Blood cell telomere lengths and shortening rates of chimpanzee and human females. Am J Hum Biol. 2014; 26(4):452–60. doi:10.1002/ajhb.22538PMID: 24633909
16. Cawthon RM. Telomere measurement by quantitative PCR. Nucleic Acids Res [Internet]. 2002 May 15; 30(10):e47. Available:http://www.pubmedcentral.nih.gov/articlerender.fcgi?artid=2647324&tool= pmcentrez&rendertype=abstractdoi:10.1093/nar/30.10.e47
17. Veerkamp R., Simm G, Oldham J. Effects of interaction between genotype and feeding system on milk production, feed intake, efficiency and body tissue mobilization in dairy cows. Livest Prod Sci [Internet]. 1994 Aug; 39(3):229–41. Available:http://linkinghub.elsevier.com/retrieve/pii/030162269490202Xdoi: 10.1016/0301-6226(94)90202-X
18. Clutton-Brock T, Pemberton J. Soay Sheep Dynamics and Selection in an Island Population. Cam-bridge University Press; 2004.
19. Demeke T, Jenkins GR. Influence of DNA extraction methods, PCR inhibitors and quantification meth-ods on real-time PCR assay of biotechnology-derived traits. Anal Bioanal Chem. 2010; 396(6):1977– 90. doi:10.1007/s00216-009-3150-9PMID:19789856
20. Ellis SA, Braem KA, Payne LK. Nucleotide sequence of cattle beta 2-microglobulin cDNA. Immunoge-netics [Internet]. 1993; 38(4):310. Available:http://www.ncbi.nlm.nih.gov/pubmed/8319984PMID: 8319984
21. Wu C, McConnell I, Blacklaws B. Cloning and characterization of ovine beta2-microglobulin cDNAs. Vet Immunol Immunopathol [Internet]. 2008 Jun 15; 123(3–4):360–5. Available:http://www.ncbi.nlm. nih.gov/pubmed/18400307doi:10.1016/j.vetimm.2008.02.017PMID:18400307
22. Epel ES, Blackburn EH, Lin J, Dhabhar FS, Adler NE, Morrow JD, et al. Accelerated telomere shorten-ing in response to life stress. Proc Natl Acad Sci U S A [Internet]. National Academy of Sciences; 2004; 101(49):17312–5. Available:http://www.pubmedcentral.nih.gov/articlerender.fcgi?artid=
534658&tool=pmcentrez&rendertype=abstractdoi:10.1073/pnas.0407162101PMID:15574496
23. Ruijter JM, Ramakers C, Hoogaars WMH, Karlen Y, Bakker O, van den Hoff MJB, et al. Amplification efficiency: linking baseline and bias in the analysis of quantitative PCR data. Nucleic Acids Res [Inter-net]. 2009 Apr [cited 2014 Jul 11]; 37(6):e45. Available:http://www.pubmedcentral.nih.gov/
articlerender.fcgi?artid=2665230&tool=pmcentrez&rendertype=abstractdoi:10.1093/nar/gkp045 PMID:19237396
24. Pfaffl MW. A new mathematical model for relative quantification in real-time RT–PCR. Nucleic Acids Res. 2001; 29(9):e45. PMID:11328886
25. R Core Team. R: A Language and Environment for Statistical Computing [Internet]. Vienna, Austria: R Foundation for Statistical Computing; 2014. Available:http://www.r-project.org/
26. Psifidi A, Dovas CI, Bramis G, Lazou T, Russel CL, Arsenos G, et al. Comparison of Eleven Methods for Genomic DNA Extraction Suitable for Large-Scale Whole-Genome Genotyping and Long-Term DNA Banking Using Blood Samples. PLoS One [Internet]. 2015; 10(1):e0115960. Available:http://dx. plos.org/10.1371/journal.pone.0115960doi:10.1371/journal.pone.0115960PMID:25635817
27. Benetos A, Kimura M, Labat C, Buchoff GM, Huber S, Labat L, et al. A model of canine leukocyte telo-mere dynamics. Aging Cell. 2011; 10(6):991–5. doi:10.1111/j.1474-9726.2011.00744.xPMID: 21917112
28. Brown DE, Dechow CD, Liu WS, Harvatine K j., Ott TL. Hot topic: Association of telomere length with age, herd, and culling in lactating Holsteins. J Dairy Sci. 2012; 95(11). doi:10.3168/jds.2012-5593 PMID:22981568
29. Fairlie J, Holland R, Pilkington JG, Pemberton JM, Harrington L, Nussey DH. Lifelong leukocyte telo-mere dynamics and survival in a free-living mammal. Aging Cell. 2015;140–8. doi:10.1111/acel.12417 PMID:26521726