Early Childhood Development of Late-Preterm Infants:
A Systematic Review
abstract
CONTEXT:Late-preterm infants (LPIs) born at 34 to 36 weeks’ gestation are increasingly regarded as being at risk for adverse developmental outcomes. To date, the early childhood development of LPIs has not been systematically considered.
OBJECTIVE:To undertake a broad examination of literature relating to early childhood development at the ages of 1 to 7 years of LPIs born at 34 to 36 weeks’ gestation.
METHODS:We conducted a systematic review of early childhood
out-comes in LPIs by using 9 electronic databases (January 1980 to March 2010). Bibliographies were reviewed. After examination of abstracts, ineligible studies were excluded. A specifically designed data-extraction form was used. The methodologic quality of included studies was assessed by using well-documented quality-appraisal guidelines.
RESULTS:Of 4581 studies, 10 (3 prospective and 7 retrospective
co-hort) were included. Studies were heterogeneous, and poorer out-comes were reported among LPIs in relation to neurodevelopmental disabilities, educational ability, early-intervention requirements, med-ical disabilities, and physmed-ical growth in comparison to term-born chil-dren. No identified study used healthy nonadmitted LPIs as a compari-son group for admitted LPIs.
CONCLUSIONS:Evidence suggests that LPIs are at increased risk of
adverse developmental outcomes and academic difficulties up to 7 years of age in comparison to term infants. An infant control group matched for gestational age has not been used; thus, for LPIs, the effect of neonatal admission on longer-term outcomes has not been fully explored. Systematic measurement of early childhood outcomes is lacking, and focused long-term follow-up studies are needed to inves-tigate early childhood development after late-preterm birth.Pediatrics
2011;127:1111–1124
AUTHORS:Jennifer E. McGowan, RN,aFiona A. Alderdice, PhD,aValerie A. Holmes, PhD, RGN,aand Linda Johnston, PhD, RNa
aSchool of Nursing and Midwifery, Queen’s University Belfast,
Belfast, United Kingdom
KEY WORDS
late-preterm infants, neonatal admission, early childhood, developmental outcomes, neurodevelopment, cognitive, motor, language development, health, growth
ABBREVIATIONS
NIC—neonatal intensive care LPI—late-preterm infant
ISPOR—International Society for Pharmacoeconomics and Outcomes Research
CP—cerebral palsy
ICD—International Classification of Diseases CI—confidence interval
www.pediatrics.org/cgi/doi/10.1542/peds.2010-2257
doi:10.1542/peds.2010-2257
Accepted for publication Jan 14, 2011
Address correspondence to Fiona A. Alderdice, PhD, School of Nursing and Midwifery Medical Biology Centre, 97 Lisburn Road, Belfast, BT9 7BL, United Kingdom. E-mail: f.a.alderdice@qub.ac.uk
PEDIATRICS (ISSN Numbers: Print, 0031-4005; Online, 1098-4275).
Copyright © 2011 by the American Academy of Pediatrics
Infants born preterm and admitted to neonatal intensive care (NIC) have
unique and significant developmental concerns throughout early child-hood.1–3Much of the research to date has focused on those infants born
ex-tremely premature (23–28 weeks’ ges-tation) or at a very low (⬍1500 g) or extremely low (⬍1000 g) birth weight. However, even those infants admitted
for NIC for only short periods of time or for less invasive care may still be at risk of negative neurodevelopmental outcomes.4,5Over recent years, there has been an increasing focus on the
early outcomes of the late-preterm subgroup of premature infants. Late-preterm infants (LPIs) are defined as those born between 340⁄7 and 366⁄7
weeks’ gestation6,7and account for up to 75% of all preterm births8; there was a reported 25% increase in late preterm births from 1990 to 2006.9 Al-though some of these infants are not
admitted for NIC but, rather, nursed with their mothers or in the special care setting only, the proportion of all infants admitted for NIC attributable to this late-preterm group is significant.
Data relating to admission rates are not widely available, but sources have suggested that LPIs account for 20% to 25% of all NIC admissions.10,11
LPIs have unique and particular con-cerns in the neonatal period, including an increased risk of mortality in
com-parison to term infants.12–15 Further-more, compared with term infants, LPIs are at significant risk for in-creased morbidity including
hypo-thermia, hypoglycemia, hyperbiliru-binemia, respiratory distress, poor feeding, and nutritional compromise in the early neonatal period.16–19 Dis-turbance of infant brain development
during the third stage of pregnancy has also been reported.20,21Thus, it is plausible to propose that long-term morbidity may indeed be a reality and
that general developmental immatu-rity may persist in LPIs.
Currently, clinical practice in the early care of LPIs is varied, and the long-term effect of neonatal care on this population of infants remains largely unknown. There is a dearth of re-search relating to the early childhood development of LPIs,22,23and further re-search has been called for in this in-fant group.6
To date, the number of studies on and the quality of information relating to the various facets of development of LPIs throughout early childhood has not been systematically considered. In light of this fact, we undertook a sys-tematic review of the literature to ex-plore current understanding of this significant group of NIC graduates.
The objective of this review was to ex-amine studies of early childhood cog-nitive, motor, speech, and language de-velopment, health, and growth at the ages of 1 to 7 years of LPIs born at 34 to 36 weeks’ gestation. Particular atten-tion was given to the gestaatten-tional age of the comparison groups used (whether healthy term-born infants or healthy, nonadmitted LPIs).
METHODS
Search Strategy
A comprehensive literature search was undertaken to identify literature from January 1980 through March 2010. The search strategy involved searching electronic databases, in-specting bibliographies of retrieved articles, and hand-searching the pub-lished literature.
We searched the Medline (from 1980), CINAHL (Cumulative Index to Nursing and Allied Health Literature) (from 1982), Embase (from 1980), PsycINFO (from 1987), and Maternity and Infant Care (from 1980) databases. Searches were also undertaken of LILACS (from 1982) and the Science Citation Index
(from 1980) via the ISI Web of Knowl-edge. Alongside this, CDSR (Cochrane Database of Systematic Reviews [from 1992]), CENTRAL (Cochrane Controlled Trial Register [from 1992]), and Na-tional Health Service Centre for Re-views and Dissemination (including DARE [Database of Abstracts of Re-views of Effects]) were searched via Wiley. Ongoing and current research was identified through the UK Clinical Research Network and the National Re-search Register Archive.
The search was undertaken by using the following search terms: late pre-term; near pre-term; 34 to 36 weeks; mod-erately preterm; preterm; premature; neonatal intensive care; child develop-ment; long-term outcome; neurodevel-opment; early childhood; cognitive; motor; speech; language; health; and growth and development. Appendix 1 highlights a single electronic search strategy.
Selection of Eligible Studies
ade-quately described. Only studies written in or translated into English were in-cluded. Full-text analysis was con-ducted for included studies. Authors of the early literature pertaining to pre-term infant outcomes used birth weight as a measure of prematurity, which poses a well-recognized source of bias (potential inclusion of term in-trauterine growth-retarded infants as “premature” and the potential for large-for-gestational-age infants to not be defined as preterm). In light of this potential, studies that solely used birth weight as the defining criterion were not included in this review.
Data Extraction
Data were extracted by using a specif-ically designed data-extraction form that included the authors and year of publication; study design; number, gestation, and admission status of study and comparison-group infants; exclusion criteria; age at assessment; and primary objective. Available sum-mary results were then tabulated. The original search methodology was de-signed to examine 5 specific domains of childhood development: cognitive development; motor development; speech and language development; health; and physical growth. There are larger bodies of research relating to specific developmental domains for other premature infant groups; how-ever, this review of developmental comes of LPIs has identified broad out-comes assessed using widely varying scales and measures. Therefore, a de-scriptive methodology was chosen and a narrative synthesis was undertaken.
Quality Assessment
Included studies investigated develop-mental outcomes of infants after late-preterm birth. There is limited consen-sus on how to appraise the quality of such “outcome” studies.24 However, Hayden et al25provided a useful quality-assessment framework for appraising
evidence relating to prognosis or health outcomes. Their framework appraises 6 areas of potential bias: study participa-tion; study attriparticipa-tion; prognostic factor measurement; confounding ment and account; outcome measure-ment; and analysis. Alongside this frame-work, the International Society for Pharmacoeconomics and Outcomes Re-search (ISPOR) retrospective database checklist26 was used to assess the quality of data sources in those stud-ies that used retrospective data-bases. Appendix 2 shows the adapted quality-assessment framework used. Published abstracts were not as-sessed for quality.
RESULTS
Included Studies
Ten studies considered the early child-hood development of LPIs (see Table 1). The study-selection process is out-lined in Fig 1. The combined initial da-tabase searches retrieved 4581 poten-tially relevant studies, of which 4192 were excluded on the basis of the title and abstract (including 46, which had not been translated into English). After a more detailed review, 222 did not meet all of the inclusion criteria and were excluded. In total, 167 articles were considered, and another 150 of them were excluded for the following main reasons: the studies included all preterm infants with no specific sub-group analysis of the defined late-preterm gestational age group, or the studies considered only short-term (up to 1-year) outcomes or considered developmental outcomes beyond the scope of the review (eg, behavior and attention). In total, 17 studies were considered by a panel of 4 investiga-tors, and 10 were deemed eligible for detailed discussion in this review. Our stringent exclusion criteria excluded a number of studies on the basis of the “late-preterm” gestational age defini-tion used (ie, not within the 34 –36
weeks’ gestational age group). Ex-cluded studies that presented data re-lating to the wider group of infants born between 32 and 36 weeks’ gesta-tion have been detailed for reference (see Table 2).27–35For example, Darlow et al27considered 2-year outcomes in an entire preterm cohort, including a subgroup of infants who were born at 33 to 36 weeks’ gestation; although ex-cluded on the basis of gestational age, this study provided useful compara-tive data for the wider group.
Description of Included Studies
Included studies are summarized in Table 1. Of 10 studies that detailed in-fants born late preterm, 4 studies fo-cused solely on the late-preterm group,36–39 and 6 studies included a subgroup of infants born at 34 to 36 weeks’ gestation within the infant pop-ulation considered.40–45 Most studies were conducted within developed na-tions: the United States (6),36–39,42,45 France (1),40 England (1),44 Norway (1),41and Brazil (1).43All of the included studies had been undertaken within the past 10 years. Seven of the studies had a retrospective cohort de-sign,36,37,39,41,42,44,45and 3 were prospec-tive observational studies.38,40,43 Re-porting of neonatal comorbidities was limited in all studies; however, the neo-natal admission status of infants stud-ied were as follows: 3 studies consid-ered LPIs admitted for NIC37,39,40; 4 studies were of birth cohorts that in-cluded all LPIs41–44; 2 included LPIs de-fined as “healthy”36or “without neona-tal compromise that would qualify them for developmental follow-up”45; and admission status of the infants in 1 study were not reported.38
educa-TABLE 1 Description of Included Studies
Authors and Location Study Design Age Assessed
Description of Infants Primary Objective
Study Control Exclusions
Baron et al39(2009),
United States
Retrospective cohort
3 y 34–36 wk GA (n⫽60)a Term (n⫽
35)
Infants with genetic disorders, sensorineural loss, brain tumors, non–English-speaking
To examine general cognition, attention/working memory, language, manual coordination/motor dexterity, visuomotor, visuospatial, and executive function in NICU-admitted late-preterm preschool-aged children compared with term infants
Gyamfi38(2009),
United Statesb
Prospective observational
32–64 mo 34–36 wk GA (n⫽130) ⱖ39 wk (n⫽ 157)
Infants with congenital abnormalities
To evaluate morbidity at birth and indicators of developmental delay for infants born at 34–36 wk GA compared with infants of
ⱖ39 wk GA by using the Ages & Stages Questionnaire Kalia et al37(2009),
United States
Retrospective cohort
12⫾2 mo 34–36 wk GA (n⫽50)a Very preterm
(⬍32 wk ) (n⫽77)
Infants with congenital abnormalities that required surgery
To determine LPIs’ requirement for therapeutic services compared with that of very preterm infants
Morse et al36(2009),
United States
Retrospective cohort
Up to 5 y 34–36 wk GA (n⫽7152) Term (n⫽ 152 661)
Infants with length of stay⬎3 d, major congenital abnormalities, multiple births, or transfer to other hospital
To compare prekindergarten and kindergarten outcomes among healthy LPIs (34–36 wk GA) with those of healthy singleton term infants
Petrini et al42(2009),
United States
Retrospective cohort
Up to 5.5 y ⬎30 wk GA (n⫽141 321); subgroup: 34–36 wk GA (n⫽8341)
Term (n⫽ 128 955)
None recorded To assess the risks of moderate prematurity for CP, developmental delay/ mental retardation, and seizure disorders in early childhood
Santos et al43(2009),
Brazil
Prospective cohort 12 and 24 mo All births (n⫽3285); subgroup: 34–36 wk GA (n⫽371)
Term (n⫽ 2149)
Infants with weight for age⬍10th centile
To assess the effect of late-preterm birth on growth outcomes, assessed at 12 and 24 mo
Chyi et al45(2008),
United States
Retrospective cohort
5 –11 y 32–36 wk GA (n⫽970 ); subgroup: 34–36 wk GA (n⫽767)
Term (n⫽ 13 671)
Infants with anoxia/ respiratory distress syndrome at birth
Comparison of school outcomes between moderate (32–33 wk GA), late-preterm (34–36 wk GA), and term infants
Moster et al41(2008),
Norway
Retrospective cohort
Up to 5 y (including up to 36 y)
All preterm children (n⫽903 402); subgroup: 34–36 wk GA (n⫽32 945)
Term (n⫽ 858 406)
Infants with congenital abnormalities (excluding congenital hip dislocation)
Follow-up of all preterm infants in order to document medical disabilities and outcomes reflecting social performance
Marret et al40(2007),
France
Prospective population-based
5 y 30–34 wk GA (n⫽1461); subgroup: 34 wk GA (n⫽228)a
None None recorded To evaluate inpatient deaths and neonatal outcomes and also 5 year outcomes of infants born at 30–34 wk GA Huddy et al44(2001),
United Kingdom
Retrospective cohort (nested case-control)
7 y 32–35 wk GA (n⫽176); subgroups: 34 wk (n⫽ 38) and 35 wk (n⫽45) GA
None Infants with known abnormality of chromosome 16
To identify incidence of school and behavior problems at 7 y of infants born between 32 and 35 wk GA
GA indicates gestational age.
tional ability; early-intervention require-ment; medical disabilities; and physical growth. A summary of these results is shown in Table 3.
Early Childhood Outcomes
Neurodevelopmental Disabilities
Neurodevelopmental disabilities have been defined as “a group of heteroge-neous conditions that share a distur-bance in the acquisition of basic develop-mental skills in a chronologically appropriate manner.”46This broad defi-nition may include motor impairment such as cerebral palsy (CP), global devel-opmental delay, intellectual disability, or developmental language impairments. Six studies considered neurodevelop-mental disabilities in LPIs38–42(see Table 3). Three of these studies (2 prospec-tive observational studies and 1 retro-spective study) used standardized as-sessment tools.38,39,40 Marret et al40 examined infants born between 30 and 34 weeks’ gestation and performed subgroup analysis of infants born at 34 weeks’ gestation. Using the Kaufman-ABC assessment, they identified mod-erate cognitive impairment (Mental
Processing Composite [MPC] scores of 70 – 84) in 18.6% of the infants born at 34 weeks’ gestation and severe impair-ment (MPC scores of⬍70) in 5.3% of the infants. CP (according to the Euro-pean CP Network definition) was noted in⬃1% of those born at 34 weeks’ ges-tation, which is 10-fold that in the gen-eral population. Gyamfi38assessed in-fants born late preterm at a mean age of 48 months (range: 32– 64 months) by using the Ages & Stages Question-naire to assess communication, gross motor, fine motor, problem-solving, and personal-social skills. This sec-ondary analysis was undertaken with infants born after a randomized, placebo-controlled trial of 17 ␣ -hydroxyprogesterone caproate, which was used to prevent preterm delivery. Contrary to other studies, the authors found similar Ages & Stages Question-naire scores in both LPIs and term in-fants despite increased composite neonatal morbidity scores in LPIs. Baron et al39 conducted a retrospec-tive cohort study considering neuro-psychological outcomes of LPIs when compared with term infants at 3 years
of age using the Differential Ability Scales (2nd ed) and a range of neuro-psychological tests; relative deficits were observed in comparison with term infants in 2 aspects: visuospatial ability and verbal fluency. Deficits in at-tention/working memory, language, nonverbal reasoning, and manual co-ordination/dexterity were not found between the groups.
Three further retrospective cohort stud-ies used linked data sets to analyze neu-rodevelopmental disabilities, 2 accord-ing to International Classification of Disease(ICD) codes41,42and 1 according to database definitions36 (see Table 3). Moster et al41 reported data from a large cohort of premature infants in Norway, including data from a late-preterm subgroup, by using compul-sory national registries to document medical disabilities and developmen-tal outcomes. Significant increased risk ratios for CP (2.7 [95% confidence interval (CI): 2.2–3.3]) and develop-mental delay (1.6 [95% CI: 1.4 –1.8]) were reported when compared with healthy term-born infants. Across this cohort of preterm infants, a continu-ous relationship between decreasing gestational age at birth and increased adverse outcomes without an obvious threshold was observed. Petrini et al42 reported the rate of developmental de-lay among LPIs as 12.2 per 1000 chil-dren and an adjusted hazard ratio of 1.25 (95% CI: 1.01–1.54) compared with those of the healthy term-born refer-ence group. The adjusted hazard ratio for CP in this study was 3.39 (95% CI: 2.54 – 4.52) compared with that of term infants. Morse et al36 reported “develop-mental delay/disability” based on the re-quirement for early-intervention services up to 36 months; enrollment in such a pro-gram stipulates that an infant must attain a score of 1.5 SDs below the mean on a standardized developmental assessment. This requirement was 36% higher for healthy LPIs (stay of⬍72 hours) than for
Potentially relevant studies from “late
preterm” search
n = 2667
Potentially relevant studies from “all preterm” search
n = 1914
Full text reviewed
n = 167 Total potentially relevant studies
n = 4581
Studies included in the review
n = 10
Abstracts considered
n = 389
Citations excluded
n = 4192
Abstracts excluded
n = 222
Studies excluded
n =150
Studies considered at panel
n = 17
FIGURE 1
healthy term-born infants. An increased relative risk of disability in prekindergar-ten at 3 and 4 years was reported (ad-justed relative risk: 1.13 and 1.10, respectively).
Educational Ability
A significant proportion of current
literature relates to educational abil-ity, including infant groups between
the ages of 3 and 7 years. Within all of the age groups, LPIs showed poorer academic performance and greater difficulty with school-related activi-ties. Two key areas were considered: TABLE 2 Studies That Included 32 to 36 Weeks Gestation Infants (Not Included)
Authors and Location
Study Type Age at Assessment
Sample Size Primary Objective Outcome Measures
Study Control
Darlow et al27
(2009), New Zealand
Prospective cohort
2 y All preterm (n⫽276); subgroup: 33–36 wk GA (n⫽112)a
Term (n⫽94) To assess neurodevelopmental outcome at 2 y for NICU admissions compared with controls and to trial a parent-reporting scheme
Mental and psychomotor development, health and behavior, pediatric examination, parental questionnaire based on Griffiths, Bayley II PDI, and Bayley II MDI
Kerstjens et al28
(2007), Netherlandsb
Longitudinal follow-up
43–51 mo 32–36 wk (n⫽719) and⬍32 wk (n⫽163) GA
Term (n⫽ 377)
To investigate if LPIs have a higher rate of
neurodevelopmental delay compared with children born at normal GA and how they compare with infants ⬍32 wk GA
Ages & Stages Questionnaire: behavior; communication; gross and fine motor; problem-solving; personal-social development
Pietz et al29(2004),
Germany
Prospective cohort
20 mo and 7 y
LBW (n⫽70); subgroup: 32–36 wk GA (n⫽53)
Term (n⫽50) To examine growth and neurodevelopmental outcome of a low-risk population of LBW children up to 7 y
Physical growth, language development, visual perception, visual-motor integration, fine motor skills, Griffiths Scales and a neuropsychological test battery
Hediger et al30
(2002), United States
Cross-sectional 2–47 mo All preterm (n⫽ 4621); subgroup: 33–36 wk GA (n⫽ 329)
None To examine the effects of birth weight and gestation on motor and social development in a nationally representative cross-sectional sample of infants aged 2–47 mo
Motor and Social Development score as developed for the study
Hemgren and Persson31
(2002), Sweden
Longitudinal follow-up
3 y All preterm (n⫽246); subgroup: 32–36 wk GA (n⫽81)a
Term (n⫽72) To compare motor performance and behavior at 3 y of age of very preterm, moderately preterm, and term infants who required NIC and neonatally healthy term children
Combined assessment of motor performance and behavior (CAMPB tool) and motor perceptual development
Jennische and Sedin32,33(2001),
Sweden
Longitudinal follow-up
6.5 y All preterm (n⫽245); subgroup: 32–36 wk GA (n⫽81)a
Term (n⫽72) To evaluate and describe spontaneous speech at 6.5 y in children who required NIC, comparing differences between groups of those and neonatally healthy children (born 1986–1989)
Speech and language skills: 8 aspects of spontaneous speech assessed by conversation; also, linguistic skills assessed (3 motor functions/10 linguistic)
Jennische and Sedin34,35(1998/
1999), Sweden
Longitudinal follow-up
6.5 y All preterm (n⫽310); subgroup: 32–36 wk GA (n⫽132)a
Term (n⫽40) To evaluate and describe spontaneous speech at 6.5 y in children who required NIC, comparing differences between groups of those and neonatally healthy children (born 1980–1985)
Speech and language skills: 8 aspects of spontaneous speech assessed by conversation; also, linguistic skills assessed (3 motor functions/10 linguistic)
GA indicates gestational age; LBW, low birth weight; PDI, Psychomotor Development Index; MDI, Mental Development Index.
academic ability and special educa-tion requirement.
Three studies considered academic ability by using direct infant
assess-ments and teacher ratings.36,44,45 An
early prospective cohort study by
Huddy et al44 encompassed infants
born between 32 and 35 weeks’
gesta-tion and included 2 subgroups of
in-fants born between 34 and 35 weeks’
gestation. No comparison group was
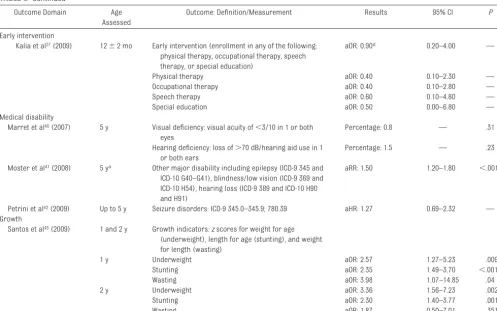
included. School problems in children TABLE 3 Summary of Results of Included Studies
Outcome Domain Age
Assessed
Outcome: Definition/Measurement Results 95% CI P
Neurodevelopmental disability
Petrini et al42(2009) Up to 5.5 y Developmental delay/mental retardation: ICD-9 315–
315.9; ICD-9 317–319
aHR: 1.25 1.01–1.54 —
CP: ICD-9 343–343.9 aHR: 3.39 2.54–4.52 —
Moster et al41(2008) Up to 5 ya Mental retardation: ICD-9 317–319; ICD-10 F70–F79 aRR: 1.6 1.4–1.8 ⬍.001b
Cerebral palsy: ICD-9 342–344; ICD-10 G80–G83 aRR: 2.7 2.2–3.3 ⬍.001b
Marret et al40(2007) 5 y Cognition: Kaufman ABC (Mental Processing Composite) aOR: 0.4c 0.2–1.2 .29
Cerebral Palsy: European CP Network definition aOR: 0.08c 0.01–0.60 ⬍.001
Morse et al36(2009) 0–3 y Developmental delay/disability: Early Intervention
Program participation up to 36 mo (stipulates a score of 1.5 SDs below the mean on a standardized assessment)
aRR: 1.36 1.29–1.43 —
3 and 4 y Disability in prekindergarten (3 y) aRR: 1.13 1.08–1.19 —
Disability in prekindergarten (4 y): participation in a program for children with diagnosis of a learning problem as a result of physical, motor, sensory, or behavioral impairment
aRR: 1.10 1.05–1.14 —
Baron et al39(2009) 3 y General cognition: DAS-II GCA Studentsttest: 2.16 — .033
DAS-II GCA: spatial cluster Studentsttest: 2.88 — .005
Motor/visuomotor: Beery VMI standard score Studentsttest: 2.57 — .012
Verbal fluency Studentsttest: 2.41 — .018
Animal fluency total, action-verb fluency total Studentsttest: 2.27 — .026 Educational ability
Academic performance
Chyi et al45(2008) 5–7 y Child assessments: test items adapted from Peabody
revised tests, Primary Test of Cognitive Skills, Tests of Early Reading and Early Mathematics Ability, and Woodcock Johnson Tests of Achievement-Revised
5 y Below-averageTscore: Reading aOR: 1.13 0.97–1.33 —
Below-averageTscore: Math aOR: 1.15 0.98–1.34 —
Below-averageTscore: Reading aOR: 1.24 1.06–1.45 —
7 y Below-averageTscore: Math aOR: 1.22 1.04–1.43 —
Teacher academic ratings: scaled evaluations of reading and math ability compared with classmates
5 y Below-average academic rating: Reading aOR: 1.30 1.07–1.59 —
Below-average academic rating: Math aOR: 1.25 1.05–1.49 —
7 y Below-average academic rating: Reading aOR: 1.28 1.06–1.54 —
Below-average academic rating: Math aOR: 1.19 0.99–1.43 —
Morse et al36(2009) 4 y Not ready to start school: 16-point checklist undertaken
by a teacher to assess preacademic skills
aRR: 1.04 1.00–1.09 —
5 y Retention in kindergarten: disciplinary code indicating temporary removal of a student from school, not exceeding 10 d
aRR: 1.11 1.07–1.15 —
Suspension in kindergarten: student is retained in the same grade at the end of the school year for failing to meet required performance levels
aRR: 1.16 1.10–1.29 —
Special education requirement
Chyi et al45(2008) 5 y Individualized Education Program requirement aOR: 1.38 1.00–1.89 —
Special education enrollment aOR: 2.13 1.56–2.90 —
7 y Individualized Education Program requirement aOR: 1.44 1.08–1.91 —
Special education enrollment aOR: 1.44 1.04–1.98 —
Morse et al36(2009) 5 y Exceptional student status: 16-point checklist 6 wk into
the school year undertaken by a teacher to assess preacademic skills
were defined in 1 aspect of this study as those who had a score of⬎3 in a skill area using a 5-point scale of diffi-culty in completing tasks, as assessed by teachers. Children born between 34 and 35 weeks’ gestation showed poor performance (with a score of⬎3) in writing/composition (34% and 33%, re-spectively), fine motor skills (29% and 33%), mathematics (29% and 31%), speaking/listening (18%), reading (21% and 22%), and physical education (8% and 9%). Morse et al36evaluated 4 school outcomes between healthy late-preterm and term infants: not ready to start school; retention in kindergar-ten; suspension in kindergarkindergar-ten; and special educational status (see Table 3). They reported statistically signifi-cant differences between LPIs and
term infants in 3 of the outcomes con-sidered, and results of additional anal-ysis indicated that infants born at 34 weeks’ gestation were more likely to be “not ready for school” than infants born at 35 or 36 weeks’ gestation. Chyi et al45compared learning difficulties between groups of infants born at 32 to 33 and 34 to 36 weeks’ gestation and term infants from kindergarten through to fifth grade (only data for children up to 7 years old are reported here) by using the Early Childhood Lon-gitudinal Study-Kindergarten Cohort data set. An adapted assessment in-cluding Peabody, Woodcock, Kaufman, and primary tests of cognition, read-ing, and math ability revealed that LPIs had lower reading and math scores than term infants in kindergarten and
first grade (P⬍.05). The risk of LPIs obtaining below-average academic rating scores remained elevated at first grade for reading and math in
comparison to that of term infants.
The second reported measure of school performance is that of a special education requirement. Chyi et al45 considered the presence of an Individ-ualized Education Program or special
education services as an indicator of learning difficulties. They concluded that, although the results were nonsig-nificant, more LPIs were enrolled in the Individualized Education Program than
term infants both in kindergarten (8.04% vs 6.18%) and first grade (10.54% vs 7.48%); special education services enrollment was also greater TABLE 3 Continued
Outcome Domain Age
Assessed
Outcome: Definition/Measurement Results 95% CI P
Early intervention
Kalia et al37(2009) 12⫾2 mo Early intervention (enrollment in any of the following:
physical therapy, occupational therapy, speech therapy, or special education)
aOR: 0.90d 0.20–4.00 —
Physical therapy aOR: 0.40 0.10–2.30 —
Occupational therapy aOR: 0.40 0.10–2.80 —
Speech therapy aOR: 0.60 0.10–4.80 —
Special education aOR: 0.50 0.00–6.80 —
Medical disability
Marret et al40(2007) 5 y Visual deficiency: visual acuity of⬍3/10 in 1 or both
eyes
Percentage: 0.8 — .31
Hearing deficiency: loss of⬎70 dB/hearing aid use in 1 or both ears
Percentage: 1.5 — .23
Moster et al41(2008) 5 ya Other major disability including epilepsy (ICD-9 345 and
ICD-10 G40–G41), blindness/low vision (ICD-9 369 and ICD-10 H54), hearing loss (ICD-9 389 and ICD-10 H90 and H91)
aRR: 1.50 1.20–1.80 ⬍.001b
Petrini et al42(2009) Up to 5 y Seizure disorders: ICD-9 345.0–345.9; 780.39 aHR: 1.27 0.69–2.32 —
Growth
Santos et al43(2009) 1 and 2 y Growth indicators:zscores for weight for age
(underweight), length for age (stunting), and weight for length (wasting)
1 y Underweight aOR: 2.57 1.27–5.23 .009
Stunting aOR: 2.35 1.49–3.70 ⬍.001
Wasting aOR: 3.98 1.07–14.85 .04
2 y Underweight aOR: 3.36 1.56–7.23 .002
Stunting aOR: 2.30 1.40–3.77 .001
Wasting aOR: 1.87 0.50–7.01 .351
Note that data from Gyamfi et al38(2009) and Huddy et al44(2001) are not included because of the absence of summary statistics. aHR indicates adjusted hazard ratio; aOR, adjusted odds ratio;
aRR, adjusted relative risk; GCA, General Conceptual Ability; VMI, Visual-Motor Integration.
aStudy includes data up to 36 years. bPvalue for trend.
cCompared with infants born at 30 weeks’ gestation.
in kindergarten and first grade. Huddy et al44also noted that support from a “nonteaching” assistant at school was required by 24% of children who were born at 34 to 35 weeks’ gestation; how-ever, no comparison group was avail-able. Furthermore, Morse et al36 re-ported that LPIs were at increased risk of being assigned “exceptional student status” in comparison to term infants.
Early-Intervention Requirement
In a retrospective cohort study, Kalia et al37 considered the requirement for early intervention (therapeutic ser-vices) by using a unique comparison group of very preterm infants (⬍32 weeks’ gestation). Overall, the percent-age uptake of early-intervention ser-vices was lower for LPIs when com-pared with those in the very preterm group. However, after controlling for neonatal comorbidities, including 5-minute Apgar scores, receipt of caf-feine for apnea of prematurity, bron-chopulmonary dysplasia, respiratory distress syndrome, and length of stay, in the very preterm infant group, there was no significant difference in enroll-ment in early-intervention services be-tween the late-preterm and very pre-term infants.
Medical Disabilities
Medical disabilities were not reported extensively within the late-preterm outcomes literature. However, the au-thors of 3 studies did report sen-sory impairment: visual impairment/ blindness; hearing impairment/ deafness; and seizure disorders.40–42 Moster et al41 recorded medical dis-ability as the occurrence of a single ICD code (see Table 3) denoting any of the above-listed conditions and reported a rate of 0.3% in the 34- to 36-weeks’ ges-tation group (adjusted relative risk: 1.5 [95% CI: 1.2–1.8];P⬍.001) compared with term infants. This analysis ex-cluded⬃2.3% of late-preterm children who died before their fifth birthday.
Vi-sual (0.8%) and hearing (1.5%) impair-ment were also reported by Marret et al40and did not vary significantly from infants born at 30 to 33 weeks. Seizure disorders were reported by Petrini et al42with an adjusted hazard ratio of 1.27 (95% CI: 0.69 –2.32) at 34 to 36 weeks compared with term infants. The general health status of LPIs be-yond 1 year was not identified in any of the studies.
Physical Growth
Physical growth was considered a pri-mary outcome in 1 population-based cohort of all births during 1 year from a middle-income country: the 2004 Pelotas Cohort (southern Brazil).43The authors reported rates of under-weight, stunting, and wasting in a late-preterm subgroup of all late-preterm in-fants in comparison with term inin-fants. LPIs were at increased risk of under-weight and stunting at 12 and 24 months of age (adjusted OR: 3.36 [95% CI: 1.56]7.23] and 2.30 [95% CI: 1.40 – 3.77], respectively). Wasting was sig-nificantly different between the groups in the first year of life; only a small number of the infants were reported to have wasting at both 12 and 24 months. Gyamfi38 also considered height and weight in LPIs in compari-son with term infants at 48 months (range: 32– 64 months) as a secondary outcome, and no significant difference between the 2 groups was reported.
Quality Assessment of Studies
Our quality assessment of studies us-ing the ISPOR Retrospective Database Checklist26and guidelines for assess-ing quality in prognostic studies25 is summarized in Table 4 and identified the following methodologic concerns. First, regarding study design and sam-ple size, 5 retrospective cohort studies used existing data sets,36,37,41,42,45 and only 1 of these studies fully outlined the quality assessment of the original data sources.42In addition, outcomes
were defined on the basis of existing data rather than being purposefully selected as measures of infant devel-opment. Although loss to follow-up and missing data are inherent concerns in longitudinal cohort studies, 8 of 9 of the included studies did account to some degree for missing data or loss to follow-up.36,37,40–45 Prospective and observational studies also tended to be limited by small sample sizes, and
2 studies lacked a comparison
group.40,44Second, the use of
nonstan-dardized outcome measurements
such as neurologic examination, care-giver report, and early-intervention up-take increases the risk of measure-ment bias and makes comparability between studies difficult. Indeed, al-though standardized ICD codes were used for defined outcomes in 2 stud-ies,41,42 the authors highlighted the subjective nature of diagnosis and the potential for missing data. Finally, al-though adjustment for previously re-ported potentially confounding perina-tal, maternal, and socioeconomic factors was noted across the included studies, neonatal and childhood co-morbidities were not considered at length.
DISCUSSION
LPIs were at increased risk of neurode-velopmental disabilities up to 7 years, poorer performance on standardized testing, and increased diagnoses of developmental delay in comparison to term infants. Significant development of the infant brain takes place during the last 4 to 6 weeks of pregnancy; there is a fourfold increase in cortical volume during the third trimester20 and an accrual of 35% of brain weight during the last 6 weeks of gestation.21 Preterm delivery as an interruption of these processes may contribute to ad-verse neurodevelopmental outcomes experienced by LPIs. In addition, com-plex medical problems in the early neonatal period may further com-pound the negative effect of early birth and associated neonatal admission. It is interesting that 1 included study, which reported a requirement for early intervention, noted a similar up-take of services between LPIs and very
preterm infants (⬍32 weeks) after ad-justment for neonatal comorbidities,37 which further highlights the influence of morbidity experienced in the early neonatal period on later childhood
de-velopment. Despite this observation, only 3 studies specifically reported the NIC admission status of infants. It is of particular note that the neonatal ad-mission status of infants and
comor-bidities experienced within the late-preterm group and their relationship to ensuing developmental outcomes have not been well addressed. At the time of this review, no identified study had used healthy nonadmitted LPIs as
a comparison group for complicated, admitted LPIs.
A consistent observation throughout the review is that LPIs have more favor-able outcomes than very preterm in-fants but less favorable outcomes than term infants. There seems to be a
con-tinuous relationship between decreas-ing gestational age and increasdecreas-ing risk of adverse outcomes such as neurode-velopmental disabilities and academic performance. This “scale” of prematu-rity identifies an important aspect of LPI development with an emphasis not on severe disability but potentially more and multiple subtle developmen-tal concerns. Winders-Davis47 high-lighted the complexity of identifying these milder disabilities and the ad-verse effect they have on global devel-opment and noted that if undetected by school age, these milder disabilities may have a negative cumulative effect on development. This effect was appar-ent in those studies relating to school performance and academic ability, in which LPIs performed less well than their term-born peers and required more special education or academic support.36,45 Developmental follow-up of infants born at late-preterm gesta-TABLE 4 Summary of Quality Assessment
Potential Bias and Domains Addressed Baron et al39
Kalia et al37
Morse et al36
Petrini et al42
Moster et al41
Santos et al43
Chyi et al45
Marret et al40
Huddy et al44
Data sourcea
1. Rationale for using data source defined NR ⬃ ⬃ ⫹ ⬃ NR ⬃ NR NR
2. Reliability/validity described 3. Linkages between sources detailed Study participationb
4. Source population clearly defined ⫺ ⫹ ⫹ ⬃ ⫹ ⫹ ⫹ ⫹ ⫹
5. Study population described
6. Study population represents source population or population of interest
Study attritionb
7. Completeness of follow-up described ⫺ ⬃ ⬃ ⫹ ⬃ ⫹ ⫹ ⬃ ⬃
8. Completeness of follow-up adequate Prognostic factor measurementb
9. Prognostic factors defined ⬃ ⬃ ⫹ ⫹ ⫹ ⫹ ⫹ ⫹ ⫹
10. Prognostic factors measured appropriately Outcome measurementb
11. Outcome defined ⫹ ⫹ ⬃ ⬃ ⬃ ⫹ ⬃ ⬃ ⬃
12. Outcome measured appropriately Confounding measurement and accountb
13. Confounders defined and measured ⬃ ⬃ ⫹ ⬃ ⫹ ⫹ ⬃ ⫹ ⫺
14. Confounding accounted for Analysisb
15. Analysis described ⬃ ⫹ ⫹ ⫹ ⫹ ⬃ ⫹ ⫹ ⫺
16. Analysis appropriate
17. Analysis provides sufficient presentation of data
Adapted from the ISPOR retrospective database checklist (Motheral et al26) and guidelines for assessing quality in prognostic studies (Hayden et al25).⫹indicates yes;⫺, no;⬃, partly; NR,
not relevant.
tions during preschool years may help
identify and alleviate subtle difficulties and potential learning problems en-countered at school age.48As the num-ber of LPIs delivered each year
contin-ues to rise,9the requirement for early intervention and early educational in-put becomes increasingly significant both in clinical follow-up and
educa-tional policy and planning.
The overarching aim of this review was to gain an understanding of early childhood development in the LPI pop-ulation. Although LPIs were previously
considered similar to term infants, emerging evidence suggests that
sig-nificant adverse developmental out-comes do exist among LPIs, which fur-ther indicates that longer-term outcomes of prematurity remain a concern even for those infants born at the more optimistic late-preterm stages of pregnancy.
CONCLUSIONS
In recent years, LPIs have increasingly been regarded as “at-risk” rather than “low-risk” infants. They are born devel-opmentally immature and with in-creased neonatal health concerns compared with term infants. The im-pact of early neonatal care on longer-term outcomes has not yet been well
considered; comorbidities, neonatal admission, and surrounding factors
have not been fully explored. System-atic measurement of early childhood outcomes, such as those already con-sidered for extremely preterm infant groups, is lacking in the late-preterm
population. There is a real need for fo-cused long-term follow-up studies to investigate early childhood develop-ment after late-preterm birth.
ACKNOWLEDGMENT
Ms McGowan receives a PhD
student-ship from the Department for Employ-ment and Learning (Northern Ireland).
REFERENCES
1. Stephens BE, Vohr BR. Neurodevelopmen-tal outcome of the preterm infant.Pediatr Clin North Am. 2009;56(3):631– 646, table of contents
2. Saigal S, Doyle LW. An overview of mortality and sequelae of preterm birth from infancy to adulthood. Lancet. 2008;371(9608): 261–269
3. Volpe JJ. Neurologic outcome of prematu-rity.Arch Neurol. 1998;55(3):297–300
4. Caravale B, Tozzi C, Albino G, Vicari S. Cogni-tive development in low risk preterm in-fants at 3– 4 years of life.Arch Dis Child Fetal Neonatal Ed. 2005;90(6):F474 –F479
5. Kramer MS. Late preterm birth: apprecia-ble risks, rising incidence.J Pediatr. 2009; 154(2):159 –160
6. Raju TNK, Higgins RD, Stark AR, Leveno KJ. Optimizing care and outcome for late-preterm (near-term) infants: a summary of the workshop sponsored by the National In-stitute of Child Health and Human Develop-ment.Pediatrics. 2006;118(3):1207–1214
7. Engle WA. A recommendation for the defini-tion of “late preterm” (near-term) and the birth weight-gestational age classification system.Semin Perinatol. 2006;30(1):2–7
8. Davidoff MJ, Dias T, Damus K, et al. Changes in gestational age distribution among U.S. singleton births: impact on rates of late preterm birth 1992–2002 [published cor-rection appears inSemin Perinatol. 2006; 30(5):313].Semin Perinatol. 2006;30(1): 8 –15
9. Martin JA, Hamilton BE, Sutton PD, et al. Births: final data for 2006.Natl Vital Stat Rep. 2009;57(7):1–104
10. Ma X, Huang C, Shouzeng L, et al; Provincial Collaborative Study Group for Late-Preterm Infants. The clinical outcomes of late pre-term infants: a multi-centre survey of Zheji-ang, China. J Perinat Med. 2009;37(6): 695– 699
11. McCall E, Craig S; Neonatal Intensive Care O u t c o m e s R e s e a r c h a n d E v a l u a t i o n (NICORE) Steering Group.Neonatal Care in Northern Ireland 2006. Belfast, Northern Ireland: Neonatal Intensive Care Outcomes Research and Evaluation Group; 2009
12. Kramer MS, Demissie K, Yang H, Platt RW, Sauve R, Liston R; Fetal and Infant Health Study of the Canadian Perinatal Surveil-lance SystemThe contribution of mild and moderate preterm birth to infant mortality. JAMA. 2000;284(7):843– 849
13. Tomashek KM, Shapiro-Mendoza CK, David-off MJ, Petrini JR. Differences in mortality between late-preterm and term singleton infants in the united states, 1995–2002.J Pediatr. 2007;151(5):450 – 456
14. Young PC, Glasgow TS, Li X, Guest-Warnick G, Stoddard G. Mortality of late-preterm (near-term) newborns in Utah.Pediatrics. 2007; 119(3). Available at: www.pediatrics.org/ cgi/content/full/119/3/e659
15. Santos IS, Matijasevich A, Silveira MF, et al. Associated factors and consequences of late preterm births: results from the 2004 Pelotas birth cohort.Paediatr Perinat Epi-demiol. 2008;22(4):350 –359
16. Wang ML, Dorer DJ, Fleming MP, Catlin EA. Clinical outcomes of near-term infants. Pe-diatrics. 2004;114(2):372–376
17. McIntire DD, Leveno KJ. Neonatal mortality and morbidity rates in late preterm births
compared with births at term.Obstet Gyne-col. 2008;111(1):35– 41
18. Lubow JM, How HY, Habli M, Maxwell R, Sibai BM. Indications for delivery and short-term neonatal outcomes in late preterm as com-pared with term births.Am J Obstet Gyne-col. 2009;200(5):e30 – e33
19. Shapiro-Mendoza CK, Tomashek KM, Ko-telchuck M, et al. Effect of late-preterm birth and maternal medical conditions on new-born morbidity risk. Pediatrics. 2008; 121(2). Available at: www.pediatrics.org/ cgi/content/full/121/2/e223
20. Hüppi PS, Warfield S, Kikinis R, et al. Quanti-tative magnetic resonance imaging of brain development in premature and mature newborns.Ann Neurol. 1998;43(2):224 –235
21. Guihard-Costa AM, Larroche JC. Differential growth between the fetal brain and its in-fratentorial part.Early Hum Dev. 1990;23(1): 27– 40
22. Adams-Chapman I. Neurodevelopmental outcome of the late preterm infant.Clin Perinatol. 2006;33(4):947–964
23. Jain L. Morbidity and mortality in late-preterm infants: more than just transient tachypnea!J Pediatr. 2007;151(5):445– 446
24. Altman DG. Systematic reviews of evalua-tions of prognostic variables. BMJ. 2001; 323(7306):224 –228
25. Hayden JA, Cote P, Bombardier C. Evaluation of the quality of prognosis studies in sys-tematic reviews. Ann Intern Med. 2006; 144(6):427– 437
Retrospective Databases. Value Health. 2003;6(2):90 –97
27. Darlow BA, Horwood LJ, Wynn-Williams MB, Mogridge N, Austin NC. Admissions of all gestations to a regional neonatal unit ver-sus controls: 2-year outcome.J Paediatr Child Health. 2009;45(4):187–193
28. Kerstjens JM, Butcher PR, Molen van der JL, et al. Development of late preterm infants at age 4 [Abstract].Eur J Public Health. 2007; 17(suppl 2):104
29. Pietz J, Peter J, Graf R, et al. Physical growth and neurodevelopmental outcome of non-handicapped low-risk children born pre-term.Early Hum Dev. 2004;79(2):131–143
30. Hediger ML, Overpeck MD, Ruan WJ, Tro-endle JF. Birthweight and gestational age effects on motor and social development. Paediatr Perinat Epidemiol. 2002;16(1): 33– 46
31. Hemgren E, Persson K. Motor performance and behaviour in preterm and full-term 3-year-old children.Child Care Health Dev. 2002;28(3):219 –226
32. Jennische M, Sedin G. Spontaneous speech at 6.5 years of age in children who required neonatal intensive care in 1986 –1989.Acta Paediatr. 2001;90(1):22–33
33. Jennische M, Sedin G. Linguistic skills at 6.5 years of age in children who required neo-natal intensive care in 1986 –1989.Acta Pae-diatr. 2001;90(2):199 –212
34. Jennische M, Sedin G. Speech and language
skills in children who required neonatal in-tensive care. I. Spontaneous speech at 6.5 years of age. Acta Paediatr. 1998;87(6): 654 – 666
35. Jennische M, Sedin G. Speech and language skills in children who required neonatal in-tensive care. II. Linguistic skills at 6.5 years of age.Acta Paediatr. 1999;88(4):371–383
36. Morse SB, Zheng H, Tang Y, Roth J. Early school-age outcomes of late preterm in-fants.Pediatrics. 2009;123(4). Available at: www.pediatrics.org/cgi/content/full/123/ 4/e622
37. Kalia JL, Visintainer P, Brumberg HL, Pici M, Kase J. Comparison of enrollment in inter-ventional therapies between late-preterm and very preterm infants at 12 months’ cor-rected age. Pediatrics. 2009;123(3): 804 – 809
38. Gyamfi C. Neonatal and developmental out-comes in children born in the late preterm period versus term.Am J Obstet Gynecol. 2008;199(6 suppl A):S45
39. Baron IS, Erickson K, Ahronovich MD, Coule-han K, Baker R, Litman FR. Visuospatial and verbal fluency relative deficits in “compli-cated” late-preterm preschool children. Early Hum Dev. 2009;85(12):751–754
40. Marret S, Ancel P, Marpeau L, et al; EPIPAGE Study Group. Neonatal and 5 year outcomes after birth at 30 –34 weeks of gestation. Ob-stet Gynecol. 2007;110(1):72– 80
41. Moster D, Terje Lie R, Markestad T.
Long-term medical and social consequences of preterm birth.N Engl J Med. 2008;359(3): 262–273
42. Petrini JR, Dias T, McCormick MC, Massolo ML, Green NS, Escobar GJ. Increased risk of adverse neurological development for late preterm infants.J Pediatr. 2009;154(2): 169 –176
43. Santos IS, Matijasevich A, Domingues MR, Barros AJ, Victora CG, Barros FC. Late pre-term birth is a risk factor for growth falter-ing in early childhood: a cohort study.BMC Pediatr. 2009;9:71–78
44. Huddy CL, Johnson A, Hope PL. Educational and behavioural problems in babies of 32–35 weeks gestation.Arch Dis Child Fetal Neonatal Ed. 2001;85(1):F23–F28
45. Chyi LJ, Lee HC, Hintz SR, Gould JB, Sutcliffe TL. School outcomes of late preterm infants: special needs and challenges for infants born at 32 to 36 weeks gestation.J Pediatr. 2008;153(1):25–31
46. Shevell MI. Present conceptualization of early childhood neurodevelopmental dis-abilities.J Child Neurol. 2010;25(1):120 –126
47. Winders-Davis D. Cognitive outcomes in school-age children born prematurely. Neo-natal Netw. 2003;22(3):27–38
APPENDIX 1 Single Electronic Search Strategy for Ovid Medline: Key-Word Search for Late-Preterm Infants and Single Specified Outcome (Motor Development)
1. (late ADJapreterm ADJ infant$1b). mpc. [mp⫽ti, ab, tx, ct, sh, de]
2. (near ADJ term ADJ infant$1).mp. 3. (late ADJ preterm ADJ birth).mp. 4. (near ADJ term ADJ birth).mp.
5. (moderate$ ADJ preterm ADJ infant$1).mp. 6. (moderate$ ADJ prematuraADJ infant$1).mp.
7. (moderate$ ADJ preterm ADJ birth$1).mp. 8. (moderate$ ADJ prematuraADJ birth).mp.
9. (low ADJ risk ADJ infant$1).mp. 10. (low ADJ risk ADJ birth).mp.
11. neonatal ADJ intensive ADJ care ADJ admission 12. neonatal ADJ admission
13. neonatal ADJ2 admi$ 14. special ADJ care
15. high ADJ dependency ADJ care 16. or/1–15
17. motor.mp.
18. (motor ADJ development).mp. 19. (motor ADJ function).mp. 20. development.mp. 21. neuromotor.mp. 22. locomotor.mp. 23. movement.mp. 24. outcome$1.mp. 25. or/17–24 26. 16 and 23
aADJ: the adjacent operator retrieves records with search terms next to each other.
b$n: limited truncation specifies a maximum number of characters that may follow the root word or phrase.
c[mp⫽ti, ab, tx, ct, sh, de] includes searching of the title, abstract, full text, controlled term, subject heading, and
APPENDIX 2 Quality-Assessment Guidelines
Potential Bias Items to Be Considered for Assessment
Data source: there is sufficient detail on the data source to limit selection and measurement bias (yes, partly, no, or unsure)a
Relevance: have the data attributes been described in sufficient detail for decision-makers to determine whether there was a good rationale for using the data source, the data source’s overall generalizability, and how the findings can be interpreted in the context of their own organization? Reliability and validity: have the reliability and validity of the data been described,
including any data quality checks and data-cleaning procedures?
Linkages: have the necessary linkages among data sources and/or different care sites been carried out appropriately taking into account differences in coding and reporting across sources?
Eligibility: have the authors described the type of data used to determine member eligibility?
Study participation: the study sample represents the population of interest on key characteristics sufficient to limit potential bias to the results (yes, partly, no, or unsure)b
The source population or population of interest is adequately described for key characteristics.
The sampling frame and recruitment are adequately described, possibly including methods to identify the sample (number and type used [eg, referral patterns in health care]), period of recruitment, and place of recruitment (setting and geographic location).
Inclusion and exclusion criteria are adequately described (eg, including explicit diagnostic criteria or “zero-time” description).
There is adequate participation in the study by eligible subjects. Study attrition: loss to follow-up (from sample to study population)
is not associated with key characteristics (ie, the study data adequately represent the sample), sufficient to limit potential bias (yes, partly, no, or unsure)b
Response rate (ie, proportion of study sample completing the study and providing outcome data) is adequate.
Attempts to collect information on participants who dropped out of the study are described. Reasons for loss to follow-up are provided.
Participants lost to follow-up are adequately described for key characteristics. There are no important differences between key characteristics and outcomes in
participants who completed the study and those who did not. Prognostic factor measurement: the prognostic factor of interest is
adequately measured in study participants to sufficiently limit potential bias (yes, partly, no, or unsure)b
A clear definition or description of the prognostic factor measured is provided (eg, including dose, level, duration of exposure, and clear specification of the method of measurement).
Continuous variables are reported or appropriate (ie, not data-dependent), and cut points are used.
An adequate proportion of the study sample has complete data for prognostic factors. The method and setting of measurement are the same for all study participants. Appropriate methods are used if imputation is used for missing prognostic factor data.
Outcome measurement: the outcome of interest is adequately measured in study participants to sufficiently limit potential (yes, partly, no, or unsure)b
A clear definition of the outcome of interest is provided, including duration of follow-up and level and extent of the outcome construct.
The outcome measure and method used are adequately valid and reliable to limit misclassification bias (eg, may include relevant outside sources of information on measurement properties, and may include characteristics, such as blind measurement and confirmation of outcome with valid and reliable test). Confounding measurement and account: important potential
confounders are appropriately accounted for, limiting potential bias with respect to the prognostic factor of interest (yes, partly, no, or unsure)b
All important confounders, including treatments (key variables in conceptual model), are measured.
Clear definitions of the important confounders measured are provided (eg, including dose, level, and duration of exposures).
Measurement of all important confounders is adequately valid and reliable (eg, may include relevant outside sources of information on measurement properties, and may include characteristics, such as blind measurement and limited reliance on recall).
Analysis: the statistical analysis is appropriate for the design of the study, limiting potential for presentation of invalid results (partly, no, or unsure)b
There is sufficient presentation of data to assess the adequacy of the analysis. The strategy for model-building (ie, inclusion of variables) is appropriate and is
based on a conceptual framework or model.
The selected model is adequate for the design of the study. There is no selective reporting of results.
Adapted from the ISPOR Retrospective Database Checklist (Motheral et al26) and guidelines for assessing quality in prognostic studies (Hayden et al25). aISPOR checklist for retrospective database studies.