*Address for correspondence E-mail: vasajan2001@hotmail.com
Prediction of Malnutrition Using Modified Subjective
Global Assessment-dialysis Malnutrition Score in
Patients on Hemodialysis
VASANTHA JANARDHAN*, P. SOUNDARARAJAN, N. VANITHA RANI, G. KANNAN, P. THENNARASU, ROSNEY ANN CHACKO AND C. UMA MAHESWARA REDDY
Department of Pharmacy Practice, Faculty of Pharmacy, Department of Nephrology, Sri Ramachandra University, Porur, Chennai - 600 116, India
Janardhan, et al.: Malnutrition in Hemodialysis
Malnutrition is widely prevalent among patients on hemodialysis. Malnutrition can be estimated using a fully quantitative scoring system Subjective Global Assessment-Dialysis Malnutrition Score which is simple, reliable and dynamic. The primary objective of the study was to assess the severity of malnutrition in patients with end stage renal disease and undergoing hemodialysis in a tertiary care teaching hospital in Chennai, using Subjective Global Assessment-Dialysis Malnutrition Score and correlate it with standard indicators of malnutrition like anthropometric and biochemical parameters of the study population by Pearson’s correlation. Anthropometric assessment included height, body weight, triceps skin fold thickness, mid arm circumference, mid arm muscle circumference % and biochemical parameters included serum albumin, transferrin, ferritin, total protein, total cholesterol, blood urea nitrogen and creatinine. Based on the scores, of the 66 patients, 91% were moderately malnourished. There was a significant negative correlation between modified Subjective Global Assessment-Dialysis Malnutrition Score and anthropometric measures such as triceps skin fold thickness, mid arm circumference, mid arm muscle circumference; biochemical markers such as albumin, transferrin and ferritin. The data obtained from this study confirm that a high degree of malnutrition was prevalent in patients on hemodialysis, as shown by anthropometric assessment, biochemical markers of malnutrition and Subjective Global Assessment-Dialysis Malnutrition Score. Nutritional status as determined by Subjective Global Assessment-Dialysis Malnutrition Score is a useful and reliable index for identifying patients at risk for malnutrition and it correlates well with anthropometric and biochemical assessment. may be integrated in regular assessment of malnutrition in patients on maintenance hemodialysis.
Key words: Anthropometry, hemodialysis, malnutrition, protein energy
Research
Paper
Protein energy malnutrition (PEM) is common in hemodialysis patients and is linked to increased morbidity and mortality[1]. There are several causes
of PEM in patients with advanced chronic renal failure (CRF). These include; inadequate food intake secondary to anorexia caused by uremic state, altered taste sensation, concurrent illness, emotional distress, impaired ability to procure, prepared or mechanically ingested foods, unpalatable prescribed diets; the catabolic response to superimposed illness; the dialysis procedure itself which may promote wasting by removing nutrients and may promote protein catabolism due to bio incompatibility; conditions associated with chronic inflammatory state and may
promote hyper catabolism and anorexia; loss of blood due to gastrointestinal bleeding, frequent blood sampling, blood sequestered in hemo dialyzer and tubing; endocrine disorders of uremia; possibly the accumulation of endogenously formed uremic toxins or the ingestion of exogenous toxins[2].
Numerous tools and scoring methods are used to screen for malnutrition in the community and hospitals[13-15].Most of these tools are either not validated clinically, or are not user friendly in busy clinics. Body mass index (BMI) is a simple and objective measurement for determining the nutritional status and is an important component of several malnutrition screening tools[16]. In the setting of widespread chronic energy deficiency, BMI may not be a reliable marker of malnutrition. Anthropometric measurements such as skin fold thickness, mid arm circumference (MAC) and mid arm muscle circumference (MAMC) are widely used. However, the sensitivity of these methods in detecting early malnutrition, their practicability and their applicability to hemodialysis patients has not been convincing. More elaborate methods, such as dual energy X–ray absorptiometry (DEXA), bioelectrical impedance, near infrared interactance, total body nitrogen determinations and total body potassium estimates, may give reliable results, however, the techniques are costly and their use is confined to a few major research centers[8].
Biochemical marker serum albumin is a valid and clinically useful measure of protein-energy nutritional status in MHD patients. Hypoalbuminemia is highly predictive of future mortality risk and measurement of serum albumin is inexpensive, easy to perform and widely available. However, despite their clinical utility, serum albumin levels may be insensitive to changes in nutritional status, and they do not necessarily correlate with changes in other nutritional parameters and can be influenced by non-nutritional factors like inflammation[17-19]. Serum prealbumin
may be a more useful marker of protein-energy nutritional status in patients with or without CRF due to its short half-life[20]. But, its use, as in case
of albumin, also has limitations. Serum transferrin compared to serum albumin is a more sensitive marker (due to its short half life) of nutritional status, and of the visceral protein pool in individuals with or without CRF. However, interpretations of serum transferrin can be complicated by increased iron requirements induced by chronic blood loss and treatment with erythropoietin. Serum creatinine and creatinine index are valid and clinically useful markers of protein-energy nutritional status in dialysis patients. Individuals with low pre dialysis or abalised serum creatinine (less than 10 mg/dl) should be evaluated for PEM and skeletal muscle wasting. A low creatinine
index and in the absence of substantial endogenous urinary creatinine clearance, a low serum creatinine concentration suggests low dietary protein intake and/ or diminished skeletal muscle mass and are associated with increased mortality rates[10]. Serum cholesterol can
be used as a screening tool for detecting chronically inadequate protein-energy nutritional status. Individuals undergoing MHD who have low-normal (less than 150 to 180 mg/dl) non fasting serum cholesterol have higher mortality than those with higher cholesterol levels and therefore such individuals should be investigated for possible nutritional deficits[21].
Subjective global assessment (SGA) scores, determined by medical history on seven items and clinical findings on four items, is a well-validated tool for screening for malnutrition[22-24]. Although the SGA scores are determined in a subjective manner, it is the only screening tool recommended by the American Society for Parenteral and Enteral Nutrition (ASPEN). Using components of conventional SGA, a fully quantitative scoring system consisting of 7 components with total score ranging between 7 (normal) and 35 (severely malnourished), has been recently developed and named as modified subjective global assessment score[1]. Because of its simplicity, the modified SGA
scoring can be done by paramedical staff.While there are no definite descriptions for the majority of components of SGA, it takes into consideration the hemodialysis duration and total result of it is mostly examiner dependent, the proposed method is fully quantitative, performed in few minutes, is free of cost, and definitely determines the nutritional status of hemodialysis patients. It seems that modified SGA is superior to conventional SGA and more suitable to detect the changing trend of nutritional status, which may be missed by one time anthropometry and biochemical methods[25-27].
of hemodialysis patients using standard techniques of assessment like anthropometry and biochemical parameters and correlate with modified SGA score.
MATERIALS AND METHODS
Sixty six patients (46 men and 20 women) undergoing hemodialysis in a South Indian tertiary care hospital, who had never changed their modality of treatment (from hemodialysis to peritoneal dialysis or transplantation), not hospitalized in the month prior to the study, had no signs of infection or disease activity (collagen vascular disease), were included in the study after obtaining the approval of Institutional ethical committee and informed consent of the patients. All of the patients entered into the study had been hemodialysed for 6 months and above.
Data including patient demographics, duration of hemodialysis and co-morbidities were obtained by a detailed history elucidation from the patients and their case records. Anthropometric measurements (height, body weight and skin fold thickness) were done after completion of the dialysis session. Triceps skin fold (TSF) thickness was measured using skin fold caliper. Mid arm circumference (MAC) was measured using an inch tape. Measurements were performed three times on the non-access arm of each dialysis patients and the average result of the three measurements was registered as the final MAC value. MAMC was calculated using the formula MAMC=MAC-(3.14×TSF). MAMC percentage was calculated with the standard formula (MAMC% = MAC/ 50th
×100) and interpreted using the following standards (>85% - acceptable; 76-85%- mild depletion; 65-75% -moderate depletion; <75%- severe depletion). The following laboratory parameters were measured on all patients after the dialysis session: Serum albumin, total protein, cholesterol, serum transferrin, ferritin, total iron binding capacity, creatinine and blood urea nitrogen. Total nutritional scoring for each patient, assessed by means of modified quantitative SGA was performed on all 66 dialysis patients using modified SGA-Dialysis Malnutrition Score.
Modified Subjective Global Assessment - Dialysis Malnutrition Score[1]:
SGA-Dialysis Malnutrition Score (DMS) consists of seven features; weight change, dietary intake, GI symptoms, functional capacity, co-morbidity, subcutaneous fat and signs of muscle wasting. Each
wasting were obtained by briefly examining seven sites: Temple, clavicle, scapula, ribs, quadriceps, knee and interosseous muscles. After completion of physical examinations, patients were placed in one of three groups, well nourished, mild to moderate malnutrition and severe malnutrition. These three groups were defined as 1, 3 and 5 in DMS respectively (Appendix-1).
Statistical analysis:
Descriptive statistics and regression analysis were carried out with the statistical software Minitab. All data were expressed as mean±SD. Pearson's correlation was used to assess the strength of association between SGA-DMS scores and anthropometric and biochemical parameters. A p-value of <0.05 was considered statistically significant.
RESULTS
A total of 66 patients (46 males (69.6%) with the mean age of 49.52±14.3 years and 20 females (30.3%) with the mean age of 46.3±16.4 years) undergoing hemodialysis were involved in the study. Majority of the patients were under the age range 51-70 years and they were severely malnourished. The duration of hemodialysis in the study patients ranged from 6 months to 4 years with a mean duration of 2.19±1.04 years. Majority of patients (35 males and 10 females) had been undergoing hemodialysis for a period of 2-3 years. The frequency of hemodialysis
was found to be once weekly, twice weekly and thrice weekly with a mean frequency of 2±1 per week. The co-morbidities of study population were found to be diabetes in 18 (27.27%) patients, hypertension in 36 (54.54%), diabetes and hypertension in 12 (18.18%) patients.
There was no significant correlation between the age, sex and SGA-DMS scores. Though years and frequency of dialysis had impact on the nutritional status, no significant correlation was found between SGA-DMS and duration and frequency of dialysis.
Subjective Global Assessment- Dialysis Malnutrition Score (Table 1):
SGA was used for assessing the malnutrition in the study population. A score of 7 is normal and 35 is considered severe malnourishment. The mean SGA score was 17.9±2.85 (17.3±3.2 in women and 18.2±2.6 in men). Based on the modified SGA scoring method, 91% patients were mild to moderately malnourished and the quantitative malnutrition scores were not significantly different between men and women suggesting that both men and women had equal tendency towards malnutrition.
Anthropometric assessment (Table 2):
The mean height of the patients was 65.51±2.95 inches (67±1.29 inches for males and 62.1±1.89 inches for females). As per the ICMR guidelines,
TABLE 1: SUBJECTIVE GLOBAL ASSESSMENT-DIALYSIS MALNUTRITION SCORE
Score No. of patients (N=66) Total
Males (n=46) Females (n=20)
n % n % n %
Mild (>7- <21)
Moderate (≥21 to <35)
Severe (35)
1 41
4
1.5 62.1 6.06
1 19
1.5 28.7
-2 60
4
3 90.9 6.06 91% of patients were moderately malnourished with a score of ≥ 21 to ≤ 35 based on subjective global assessment-dialysis malnutrition score.
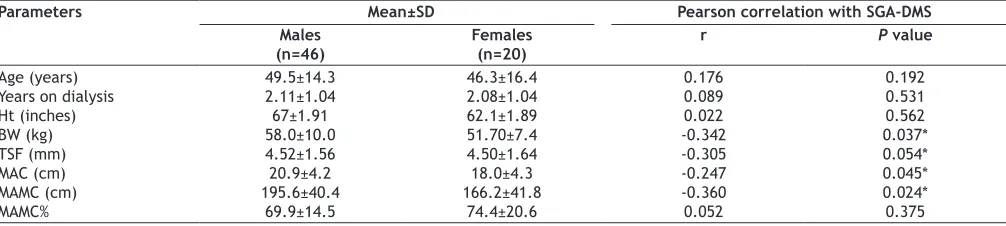
TABLE 2: ANTHROPOMETRIC PARAMETERS VS SGA-DMS
Parameters Mean±SD Pearson correlation with SGA-DMS
Males
(n=46) Females(n=20) r P value
Age (years) Years on dialysis Ht (inches) BW (kg) TSF (mm) MAC (cm) MAMC (cm) MAMC%
49.5±14.3 2.11±1.04 67±1.91 58.0±10.0 4.52±1.56 20.9±4.2 195.6±40.4
69.9±14.5
46.3±16.4 2.08±1.04 62.1±1.89 51.70±7.4 4.50±1.64 18.0±4.3 166.2±41.8
74.4±20.6
0.176 0.089 0.022 -0.342 -0.305 -0.247 -0.360 0.052
0.192 0.531 0.562 0.037* 0.054* 0.045* 0.024* 0.375
SGA-DMS - subjective global assessment-dialysis malnutrition score; Ht - height; BW - body weight; TSF - triceps skin fold; MAC - mid arm circumference;
average weight of men on hemodialysis should be 60 kg and that of women should be 55 kg. In the study, the mean body weight of males was 58.0±10 and females 51.70±7.4. Both men and women had less body weight than the standard which could have been due to malnutrition. Body weight showed a significant negative correlation with modified SGA-DMS (r = -0.342; P=0.037).
TSF estimates the subcutaneous fat deposits. The mean TSF value was found to be 4.51±1.57 mm (4.52±1.56 mm in males and 4.50±1.64 in mm females). TSF had a significant negative correlation with SGA (r = -0.305; P=0.054), indicating that lower the TSF values higher the SGA-DMS score fig. 1.
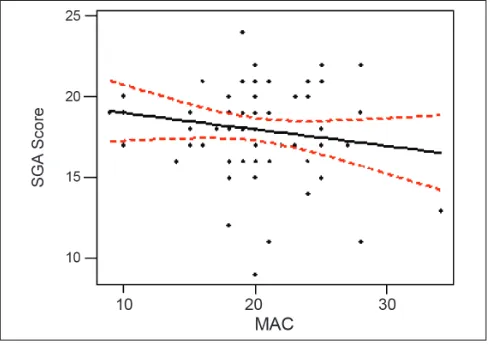
Mid arm circumference reflects the skeletal mass. Normal values for men should be >23 cm and women should be >22 cm. The mean value was 20.07±4.46 cm (20.9±4.2 cm for males and 18.0±4.3 cm for females). Both values are less than the standards. There was significant negative correlation with SGA (r = -0.247; P=0.045), which indicates that lower the MAC higher the SGA-DMS score fig. 2.
MAMC measure the protein status in the body. The mean MAMC value was 186.68±42.74 cm (195.6±40.4 cm in males and 166.2±41.8 cm in females). There was significant negative correlation with SGA (r = -0.360; P=0.024), which indicates that lower the MAMC higher the SGA-DMS score. The mean MAMC % was 71.25±16.57%
(69.9±14.5% in males and 74.4±20.6% in females). As per the standard value, < 75% is considered as severe depletion. The mean values were less than 75% for both males and females in the study, which indicates malnutrition. Men had severe depletion than women.
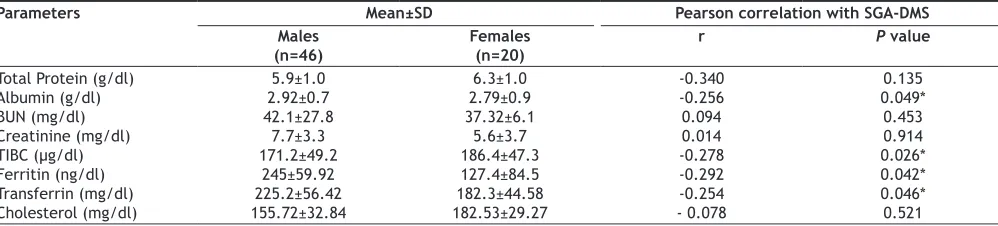
Biochemical markers:
Table 3 shows the correlation of SGA-DMS with biochemical markers of malnutrition. Serum albumin (r= -0.256; P=0.049), total iron binding capacity (r= -0.278; P=0.026), ferritin (r= -0.292; P=0.042) and transferrin(r= -0.254; p=0.046) showed a significant negative correlation with the SGA-DMS score. The total protein, BUN, creatinine and cholesterol levels had no significant correlation with the SGA-DMS.
DISCUSSION
Malnutrition is a frequent complication which affects quality of life and is associated with increased risk of mortality and morbidity in maintenance hemodialysis patients[3,4]. Compounding factors for malnutrition in
hemodialysis patients are numerous. Nevertheless, the nutritional status of dialysis patients is frequently ignored. Most indicators, especially biochemical markers such as serum albumin, transferrin or pre- albumin are useful in identifying high risk patients with malnutrition. They do not necessarily correlate with changes in other parameters and can be influenced by non nutritional factors. They can be confounded by concomitant liver disease, iron deficiency anemia and chronic inflammation[5,6].
Fig. 1: Correlation between TSF and SGA-DMS
TSF, triceps skin fold thickness; SGA-DMS, subjective global assessment–dialysis malnutrition score; Triceps skin fold thickness has a negative correlation with subjective global assessment–dialysis malnutrition score (r= - 0.305; P=0.054).
Fig. 2: Correlation between MAC and SGA-DMS
TABLE 3: BIOCHEMICAL PARAMETERS VS SGA-DMS
Parameters Mean±SD Pearson correlation with SGA-DMS
Males
(n=46) Females(n=20) r P value
Total Protein (g/dl) Albumin (g/dl) BUN (mg/dl) Creatinine (mg/dl) TIBC (µg/dl) Ferritin (ng/dl) Transferrin (mg/dl) Cholesterol (mg/dl)
5.9±1.0 2.92±0.7 42.1±27.8 7.7±3.3 171.2±49.2
245±59.92 225.2±56.42 155.72±32.84
6.3±1.0 2.79±0.9 37.32±6.1
5.6±3.7 186.4±47.3 127.4±84.5 182.3±44.58 182.53±29.27
-0.340 -0.256 0.094 0.014 -0.278 -0.292 -0.254 - 0.078
0.135 0.049* 0.453 0.914 0.026* 0.042* 0.046* 0.521
SGA-DMS - subjective global assessment-dialysis malnutrition score; BUN - blood urea nitrogen; TIBC - total iron binding capacity. *P value of
≤ 0.05 was considered significant.
Several methods of nutritional state evaluation are available ranging from anthropometric measurements to more elaborate techniques such as DEXA, Bio Impedance Assay but the reliability of these methods in detecting protein-calorie malnutrition and their practicability as not been proven. Moreover, more elaborate methods are costly and time–consuming, which restricts their use to a few research centers[22].
Detsky et al. further defined special methodology, named Subjective Global Assessment which was designed to circumvent many of these problems. It is easy to use and consists of only three discrete severity levels but closely correlated with more subjective measures. SGA is a reproducible and useful method for assessing the nutritional status of MHD patients. It is inexpensive, can be performed rapidly, requires only brief training and gives a global score of protein energy nutritional status. Disadvantages of this method include the fact that visceral protein levels are not included in the assessment; it is focused on nutrient intake and body composition[23].
Dialysis Malnutrition Score (DMS) is more objective than the SGA. In this study Dialysis malnutrition score negatively correlated with anthropometric measurements such as body weight, TSF and MAC and biochemical parameters such as complete blood count and most of the subjects were mild to moderately malnourished by modified SGA. Kalantar-Zadeh et al found that DMS was significantly correlated with anthropometric parameters like MAMC, MAC, BMI, BSF and TIBC[19].
This study did not find correlation with age, duration of hemodialysis and biochemical indicators of nutrition like total protein, creatinine and cholesterol. Various studies have shown that DMS is correlated
with age, years of hemodialysis and total protein either singly or in terms of multiple regression analysis[4,11,12]. The influence of dietary habits
on nutritional status was not considered and no correlations were made between SGA-DMS and dietary recall. This was because the dietary recall details were based on patients’ ability to recall their intake and it was not feasible for all patients.
This observational study was conducted to assess the malnutrition in hemodialysis patients using modified SGA and to find the correlation of this method with anthropometric as well as biochemical parameters. SGA correlated with anthropometric parameters like TSF and MAMC% and laboratory parameters albumin, transferrin and ferritin. Nutritional status estimation found that majority of the patients was mild to moderately malnourished. Malnutrition proves to be an important complication in chronic renal failure. SGA-DMS is a reliable method of assessing nutritional status in hemodialysis patients and useful in recommending nutritional support in these patients. However more comparative and longitudinal studies are needed to confirm the validity of this nutrition scoring system in Indian population.
Pharmacist has always been an essential member of the multidisciplinary nutrition support team, involved in providing technical advice on parenteral nutrition, as malnutrition is a common problem in many chronic ailments.
ACKNOWLEDGEMENTS
REFERENCES
1. Kalantar-Zadeh K, Kleiner M, Dunne E, Lee GH, Luft FC. A modified
quantitative subjective global assessment of nutrition for dialysis
patients. Nephrol Dial Transplant 1999;14:1732-8.
2. Must A, Dallal GE, Dietz WH. Reference data for obesity: 85th and 95th percentile for body mass index (wt/ht2) and triceps skin fold
thickness. Am J Clin Nutr 1991;53:839-46.
3. Neumayer LA, Smout RJ, Horn HG, Horn SD. Early and sufficient
feeding reduces length of stay and charges in surgical patients. J Surg Res2001;95:73-7.
4. Heys SD, Walker LG, Smith I, Eremin O. Enteral nutritional supplementation with key nutrients in patients with critical illness and
cancer: A meta-analysis of randomized controlled clinical trials. Ann
Surg1999;229:467-77.
5. Smedley F, Bowling T, James M, Stokes E, Goodger C, O’Connor O, et al. Randomized clinical trial of the effects of preoperative and postoperative oral nutritional supplements on clinical course and cost of care. Br J Surg2004;91:983-90.
6. Potter J, Langhome P, Roberts M. Routine protein energy supplementation in adults: Systematic review. Br Med J
1998;317:495-501.
7. Lewis SJ, Egger M, Sylvester PA, Thomas S. Early enteral feeding versus “nil by mouth” after gastrointestinal surgery: Systematic review
and meta-analysis of controlled trials. Br Med J2001;323:773-6.
8. Detsky AS, McLaughlin JR, Baker JP, Johnston N, Whittaker S, Mendelson RA, et al. What is subjective global assessment of
nutritional status? JPEN Parenter Enteral Nutr 1987;11:8-13.
9. Kalantar-Zadeh K, Kopple JD. Relative contributions of nutrition and
inflammation to clinical outcome in dialysis patients. Am J Kidney Dis
2001;38:1343-50.
10. Wolfson M. Pathogenesis and Treatment of Malnutrition in
Maintenance Dialysis. 2000;(2 screens). Available from: URL: http:/
www.blackwell-synergy.com/links/doi.htm. [Last accessed on 2004
Apr 3].
11. Lawson JA, Lazarus R, Kelly JJ. Prevalence and prognostic significance
of malnutrition in chronic renal insufficiency. J Ren Nutr 2001;11:
16-22.
12. Jones JM. The methodology of nutritional screening and assessment tools. J Hum Nutr Diet2002;15:59-71.
13. Kondrup J, Allison SP, Elia M, Vellas B, Plauth M. Educational and Clinical Practice Committee, European Society of Parenteral and Enteral Nutrition (ESPEN). ESPEN guidelines for nutrition screening 2002. Clin Nutr2003;22:415-21.
14. ASPEN Board of Directors and the Clinical Guidelines Task Force. Guidelines for the use of parenteral, enteral nutrition in adult and
pediatric patients. J Parenteral Enteral Nutr 2002;26:1SA-138SA.
15. Oksa H, Ahonen K, Pasternack A, Marnela KM. Malnutrition in hemodialysis patients. Scand J Urol Nephrol 1991;25:157-61.
16. Claris-Appoani A, Ardissino GL, Dacco V. Catch-up growth in children with chronic renal failure treated with long-term enteral nutrition. J Parent Enteral Nutr 1995;19:175-8.
17. Harmon WE, Spinozzi NS, Meyer A, Grupe WE. The use of protein catabolic rate to monitor pediatric hemodialysis. Dial Transpl
1981;10:324-30.
18. Nelson P, Stover J. Principles of nutritional assessment and management of child with ESRD. In: Gillit D, Stover J, editors. A Guide to Nutrition Care in ESRD. Chicago, IL: American Dietetic
Association; 1994. p. 209-26.
19. Kalantar-Zadeh K, Kopple JD, Block G, Humphreys MH. A malnutrition-inflammation score is correlated with morbidity and
mortality in maintenance hemodialysis patients. Am J Kidney Dis
2001;38:1251-63.
20. Kalantar-Zadeh K, Ikizler TA, Block G, Avram MM, Kopple JD. Malnutrition-inflammation complex syndrome in dialysis patients:
APPENDIX 1: SUBJECTIVE GLOBAL ASSESMENT-DIALYSIS MALNUTRTION SCORING CHART[1]
Patients related medical history:
1. Weight change (overall change in past 6 months)
1 2 3 4 5
No weight change Minor wt loss Wt loss 5 to 10% Wt loss 10 to15% Wt loss >15%
or gain (<5%) 2. Dietary intake
1 2 3 4 5
No change Sub-optimal solid diet Full liquid or Hypo caloric Starvation
Decrease moderate overall liquid
3. Gastrointestinal symptoms
1 2 3 4 5
No symptoms Nausea Vomiting or moderate Diarrhea Severe anorexia
GI symptoms
4. Functional capacity (nutritionally related functional impairment)
1 2 3 4 5
None (improved) Difficulty with Difficulty with Light activity Bed/chair
normal activity no/ little activity with Ambulation ridden
5. Co-morbidity
1 2 3 4 5
MDH<12 months MDH 1-2 yrs or MDH 2-4 yrs or MDH>4 yrs or Very severe
And healthy mild age>75 or moderate severe multiple
Otherwise co-morbidity co-morbidity co-morbidity co-morbidity
Physical exam:
1. Decreased fat stores or loss of subcutaneous fat (below eyes, triceps, biceps, chest)
1 2 3 4 5
None Moderate Severe
(no change)
2. Signs of muscle wasting (temple, clavicle, scapula, ribs, quadriceps, knee, interosseous)
1 2 3 4 5
None Mild Moderate Moderately severe Severe
(no change)
Causes and consequences. Am J Kidney Dis 2003;42:864-81.
21. Perunicic-Pekovic G, Rasic- Milutinovic Z, Pljesa S. Predictors of mortality in dialysis patients-association between malnutrition,
inflammation and atherosclerosis (MIA syndrome). Med Pregl
2004;57:149-52.
22. Detsky AS, Baker JP, Mendelson RA, Wolman SL, Wesson DE, Jeejeebhoy KN. Evaluating the accuracy of nutritional assessment techniques applied to hospitalized patients: Methodology and comparisons. J Parenter Enteral Nutr1984;8:1539.
23. Persson C, Sjoden PO, Glimelius B. The Swedish version of the
patient-generated subjective global assessment of nutritional status:
Gastrointestinal Vs urological cancers. Clin Nutr1999;18:71-7.
24. Julien JP, Combe C, Lasseur C. Subjective global assessment of nutrition a useful diagnostic tool for nurses. EDTNA/ERCA J
2001;27:193-6.
25. Wuhl E, Haffner D, Tonshoff B, Mehls O. Predictors of growth response to rh GH in short children before and after renal transplantation. German Study Group for Growth Hormone treatment
in Chronic Renal Failure. Kid Int Suppl 1993;43:S76-82.
26. Broyer M, Kleinknecht C, Loirat C. Growth in children treated with
long-termhemodialysis. J Pediatr 1974;84:642-49.
27. Jeejeebhoy KN. Clinical and functional assessments. In:Shils ME, Olson JA, Shike M, editors. Modern Nutrition in Health and Disease,
8th ed. Philadelphia: Lea and Febiger; 1994. p. 805-11.