Generational Shift in Parental Perceptions of
Overweight Among School-Aged Children
WHAT’S KNOWN ON THIS SUBJECT: There is a generational shift in social norms related to body weight among adult population; little is known about the secular change of paternal perceptions of their child’s weight.
WHAT THIS STUDY ADDS: A shift in body norms toward heavier weight statuses exists among parents of children, presenting a vast challenge to family-based childhood obesity prevention. Primary care providers can play a more active role in identifying the children with increased weight.
abstract
BACKGROUND:Parental perceptions of child’s weight status may infl u-ence family readiness to foster healthy behaviors. This study investi-gated the generational shifting of parental perceptions about children’s weight.
METHODS:Data were collected in the NHANES 1988–1994 (n= 2871) and 2005–2010 (n = 3202). Parents, mainly mothers, were asked whether they considered their child, ages 6 to 11 years, to be overweight, under-weight, or just about the right weight. The Centers for Disease Control and Prevention 2000 growth chart was used for reference. We ran Poisson regression to estimate the probability ratio between the 2 surveys for parents perceiving their child as overweight after con-trolling for actual weight.
RESULTS:The 10th percentile of BMI zscores for children who were
parentally perceived as overweight shifted with statistical significance from 84th percentile of reference population in the early survey to 91st percentile of reference population in the recent survey (P,.05). The meanzscore of children parentally perceived as overweight also increased between surveys with the largest increase among children from poor families (from 1.60 [SE: 0.20] to 1.98 [0.08], P , .05), followed by African Americans (from 1.65 [0.09] to 2.02 [0.05], P,
.05). The probability of overweight/obese children being correctly perceived as overweight by the parents declined by 24% between surveys (probability ratio = 0.76 [95% confidence interval: 0.67–0.87]).
CONCLUSIONS:Overweight/obese children were less likely to be
per-ceived as overweight in the recent survey compared with peers of sim-ilar weight but surveyed 10+ years earlier. The declining tendency among parents to perceive overweight children appropriately may in-dicate a generational shift in social norms related to body weight.
Pediatrics2014;134:481–488 AUTHORS:Andrew R. Hansen, DrPH,aDustin T. Duncan,
ScD,bYelena N. Tarasenko, DrPH,c,dFei Yan, MD, PhD,eand
Jian Zhang, MD, DrPHc
Departments ofaCommunity Health Behavior and Education, cEpidemiology, anddHealth Policy and Management, Jiann-Ping Hsu College of Public Health, Georgia Southern University, Statesboro, Georgia;bDepartment of Population Health, New York University School of Medicine, New York, New York; andeDepartment of Biostatistics and Social Medicine, School of Public Health, Fudan University, Shanghai, China
KEY WORDS
NHANES, BMI, obesity, overweight, social norms, children, parental perception
ABBREVIATIONS
CDC—Centers for Disease Control and Prevention CI—confidence interval
PIR—poverty income ratio PR—probability ratio
Dr Zhang conceived of and designed the study, acquired, and interpreted the data, drafted the article, and critically revised it. Dr. Zhang had full access to all of the data in the study, takes responsibility for the integrity of the data and the accuracy of the data analysis; Drs Hansen, Duncan, Tarasenko, and Yan assisted in designing, analyzing, and interpreting the data and revising the manuscript; and all authors approved thefinal manuscript as submitted.
www.pediatrics.org/cgi/doi/10.1542/peds.2014-0012
doi:10.1542/peds.2014-0012
Accepted for publication Jun 4, 2014
Address correspondence to Jian Zhang, MD, DrPH, Jiann-Ping Hsu College of Public Health, Georgia Southern University, PO Box 8015, Statesboro, GA 30460. E-mail: jianzhang@georgiasouthern. edu
PEDIATRICS (ISSN Numbers: Print, 0031-4005; Online, 1098-4275).
Copyright © 2014 by the American Academy of Pediatrics
FINANCIAL DISCLOSURE:The authors have indicated they have nofinancial relationships relevant to this article to disclose.
FUNDING:No external funding.
POTENTIAL CONFLICT OF INTEREST:The authors have indicated they have no potential conflicts of interest to disclose.
United States.1 Multiple determinants
contribute to obesity and are targeted in obesity prevention and control pro-grams, but have yielded only modest results.2Parent failure to recognize the
overweight status of their child, and maternal misperceptions in particu-lar,3–6may be one reason for the less
than satisfactory results of pediatric obesity prevention and control. Paren-tal perceptions of their child’s weight may influence family readiness to foster healthy behaviors. Parents play a crucial role in establishing children’s eating behaviors through food availability and modeling.7Emerging evidence suggests
that parental perceptions of child weight is implicated in children’s health behav-iors, such as healthy eating and active living,8and whether a parent would elect
to have their child participate in an obesity prevention intervention.9
Correlates of parental perceptions of their child’s weight include child weight status,3–6,10,11 age,10,12 gender,13,14 and
parental education level.11,13However,
few studies have assessed the broader social context that as childhood obesity rates have increased over time, par-ental perceptions of their child’s weight may have also changed. It has been observed among adults that as obesity prevalence increased, the perceived
“normal” weight increased.15,16In line
with social comparison theory, in which individuals assess their weight status in relation to others rather than against an absolute scale,17the shifting of
per-ceived normal weight could lead to an increase in parental misperceptions of their child’s actual weight status.18
Research demonstrates an increasing trend in misperceptions of weight sta-tus among adult populations.12,19–23
However, to the best of our knowledge, no studies have examined trends re-lated to parental perceptions of child
fine-tuning strategies for childhood obe-sity prevention. Hence, the purpose of the current analyses is (1) to examine the generational shifting of parental perceptions of the weight status of their child, and (2) to identify the sub-population among which the shifting occurs most noticeably.
METHODS
Study Population
The study participants were children ages 6 to 11 years, who were proxy-interviewed in the NHANES III conducted during 1988–1994 or the continuous NHANES conducted during 2005–2010. Study participants were sampled through a complex, multistage proba-bility design, and data were collected through interviews and physical exam-inations that include anthropometric measurements (eg, weight and height). A total of 3233 children from the 1988– 1994 survey, and 3508 children from the 2005–2010 survey were selected for the current analyses. We excluded 436 individuals because of missing data on family income level. Because the pri-mary goal of the current study was to examine the shifting of perceptions re-lated to overweight children, we also excluded 114 children from the 1988– 1994 survey and 104 children from the 2005–2010 who were underweight (BMI
,5 percentile). A total of 2871 children in the 1988–1994 survey and 3202 chil-dren in the 2005–2010 survey were retained for the current analysis.
Data Collection and Variable Definitions
Parental Assessment of Children’s Weight Status
NHANES interviews are conducted in English and Spanish by trainedfield staff. Questionnaires were administered in
paper-and-pen method). Data for proxy’s assessment of child’s weight status were obtained from Household Youth Questionnaires for the 1988–1994 survey and were collected in the Early Child-hood section of the 2005–2010 survey. Question wording was“Do you consider [child’s name] to be overweight, un-derweight, just about the right weight, or don’t know”in the year 1988–1994 and 2005–2008, and as“how do you consider [child’s name]’s weight? – overweight, underweight, about the right weight, or don’t know”in the year 2009–2010. The data on relationship (eg, mother, father, grandparent, etc) between proxy and sampled child were not available for the 2005–2010 survey. Hence, we were not able to differentiate proxies and did not exclude the children whose proxies were not mothers in the 2005–2010 survey. In the 1988–1994 survey, 89.7% of the proxies were mothers; hence, the term
“parental”used in the current report at large refers to“maternal.”
Directly Measured Weight Status
Anthropometric data were collected in the Mobile Examination Center by trained health technicians using a standard protocol. Body weight was measured to the nearest 0.05 kg (Toledo 2181 Scale, Columbus, OH), and height to the nearest 0.1 cm with standardized measuring equipment (Holtain Height Stadiometer Holtain, Crymych, United Kingdom). All anthropometric data were reviewed for unusual and erroneous values. Values above the 99th percentile or below the
first percentile for a particular age or age-gender group were flagged and reassessed.24BMI was calculated in kg/m2
were then assigned to an obese stratum (BMI $95th percentile), an overweight stratum (85th percentile to 94th percen-tile), or a normal weight stratum (,85th percentile) in accordance with recom-mendations of the American Academy of Pediatrics expert panel on childhood obesity25and the Institute of Medicine.26
Variables for Stratifications
Race/ethnicity was reported by partic-ipants and classified by NHANES as“ non-Hispanic white,” “non-Hispanic black,”or
“Hispanic American,” and “other.” In-come was reported as a range for the previous calendar year. A poverty in-come ratio (PIR) was calculated by comparing the midpoint of the selected income range value to the appropriate poverty threshold based on family size and composition.27The PIR values below
1.00 were categorized as below the offi -cial poverty threshold. For this study, 4 categories of PIR were considered:
“poor”(PIR,1.0),“near poor”(1#PIR
,2),“middle-income”(2# PIR,4), and“high-income”(PIR$4).28
Analytic Procedures
With appropriate weighting and nesting variables, we used SAS (version 9.3, SAS Institute, Inc, Cary, NC) to calculate the weighted study populations and asso-ciated SEs for each socio-demographic stratum separately for both surveys. The analyses were conducted in 3 steps. First, we assessed the trend in mismatch between parentally perceived and di-rectly measured body weight status (Fig 1). This step was conducted with all children, including normal weight, overweight, and obese children. Sec-ondly, we calculated and compared the means, medians, skewness, and kurto-sis of the distribution of age- and gender-standardized BMI z scores of parentally perceived overweight chil-dren to assess the overall shift of the
zscore distribution between the years 1988–1994 and 2005–2010 (Fig 2). We also tried to assess the shifting of the
minimum BMIz scores (threshold) for being parentally perceived overweight. Theoretically, the very end of the left tail of the z score distribution should be used to estimate the parental threshold for perceiving their child as overweight. However, relatively small sample sizes for the end of the distribution precluded us from making a stable estimation. Therefore, we used the 10th percentile of the BMI z score distributions from both surveys to estimate the shift in parental thresholds of BMIzscore and the percentile (against the reference population) for perceiving their child as overweight. The differences in means of
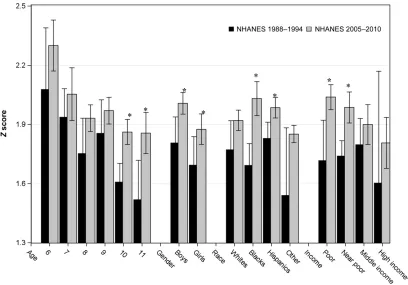
z scores among children parentally perceived as overweight were further examined by the socio-demographic stratum (ie, boys and girls; whites, Afri-can AmeriAfri-cans, and Hispanics, and oth-ers; poor, near poor, middle, and high income) to identify the subpopulation experiencing the most shifting (Fig 3). The second step was conducted among parentally perceived overweight chil-dren only. Shifting mean and median of
z scores among children parentally perceived as overweight may be driven by an increasing average body weight among the entire child population.15
Therefore, in the third step of analyses, we controlled for the BMIzscore to as-sess the probability ratios (PRs; 2005– 2010 over 1988–1994) of being paren-tally perceived as overweight between the 2 surveys for children with the same BMIzscores (Table 1). The third step was conducted among directly measured overweight children only. The PRs were used to measure the parental tendency to perceive their child as overweight among actually overweight/obese chil-dren. We combined the data from the 1988–1994 and 2005–2010 surveys and created a dummy variable to compare the parameters of 2 surveys. Modified Poisson regression was used to do multivariable adjustment.29 In addition
to the dummy variable, child’s BMI z
score, gender, race/ethnicity, age, and
family income level were included in the multivariable adjusted models when-ever appropriate.
RESULTS
Figure 1 highlights the mismatch be-tween parental perceptions and chil-dren’s BMI level calculated from directly measured body weight and height. More than three-quarters of parents interviewed in the 2005–2010 survey perceived their overweight children as
“about the right weight,”83% for boys (Fig 1B) and 78% for girls (Fig 1E). The changes between 1988–1994 and 2005– 2010 were statistically significant for both genders (P,.01), but relatively smaller for boys (from 78% to 83%; Fig 1B) than for girls (from 61% to 78%; Fig 1E). Roughly one-third of the parents per-ceived their obese child as about the right weight in the 2005–2010 survey (Fig 1 C and F), but in the 1988–1994 survey, only 21% of parents perceived their daughters as about the right weight (Fig 1F). The gender-specific mismatch of parental perceptions existing with the 1988–1994 survey diminished in 2005–2010. For ex-ample, in the 1988–1994 survey, 21% of the parents with overweight boys and 39% of the parents with overweight girls perceived their children as overweight. In the 2005–2010 survey, thesefigures de-clined to 16% for boys and 22% for girls.
The BMI z score distributions among parentally perceived overweight chil-dren (unweightedn= 486 in the 1988– 1994 survey, andn= 546 in the 2005– 2010 survey) were presented in Fig 2. Compared with that of the 1988–1994 survey, the distribution ofzscores for the children surveyed in 2005–2010 skewed negatively (skewness = 20.96 for 1988–1994 and21.20 for 2005–2010), and was lessflat (Kurtosis = 1.83 for early and 3.67 for recent). The threshold
percentile corresponding to the thresh-old z score for being parentally per-ceived as overweight was 84th of 2000 CDC growth chart in 1988–1994, and in-creased to 91st in 2005–2010. Both the mean and median of the distribution shifted toward the right tail. However, no statistically significant shifting was ob-served for the 90th percentile. The peaked distribution indicates that per-ceptions regarding what is overweight were becoming converged at the pop-ulation level. When the study poppop-ulation was stratified by demographic stratum (Fig 3), the largest increase inzscores between the 2 surveys occurred among perceived overweight children from poor families (from 1.72 [95 confidence interval (CI): 1.51–1.92] to 2.04 [1.98–2.10],
P,.05), followed by African Americans (1.69 [1.58–1.80] to 2.03 [1.94–2.12],
P,.05). African American children who
were parentally perceived as over-weight had the highest mean zscores compared with their peers from other races/ethnicities.
Overall, the probability of overweight/ obese children being correctly per-ceived as overweight by parents declined by 16% (PR = 0.84 [95% CI: 0.75–0.95]), from 0.51 (0.45–0.56) in 1988–1994 to 0.44 (0.45–0.53) in 2005–2010 (Table 1). After adjustment forzscore, the proba-bility of accurately being parentally perceived as overweight declined fur-ther by 24% in 2005–2010 when com-pared with 1988–1994 (PR = 0.76 [0.67– 0.87]). The relative decrease was greater for girls (PR = 0.72 [0.60–0.86]) than for boys (PR = 0.83 [0.69–0.99]).
DISCUSSION
Using nationally representative data collected from parent interviews, mainly
from mothers, the current study
con-firmed the observation from previous studies4,6,10–12,30–33 that a substantial
percentage of parents falsely catego-rized their overweight children as being normal weight. We further observed that there was a secular increase in the BMIzscore threshold for being paren-tally perceived as overweight. With BMI
zscores under control, we estimated that there was a 24% decline in the tendency among parents to correctly perceive their overweight child as overweight, suggesting a generational shift in social norms related to children’s body weight.
There are multiple potential reasons underlying the declining tendency to perceive an overweight child appropri-ately. Parents may also lack an un-derstanding of what“being overweight” means because of the potentially con-fusing nature of being overweight. The
assessment of body weight in children, in particular peri-pubertal children, is formidable because this group is con-tinuously experiencing changes in body composition and size.34,35 Instead of
setting thresholds for categorization, the BMI percentile is used to allow for comparison among children of the same gender and age. The definition of overweight is even more confusing.36In
1994, the Expert Committee on Clinical Guidelines for Overweight in Adolescent Preventive Services recommended that children with a BMI $95th percentile based on the CDC 2000 growth chart for age and gender should be considered overweight.37 In 2005, the Institute of
Medicine purposely elected to define children with a BMI of$95th percentile for age and gender as obese to convey the urgency of childhood obesity.26The
changes of being overweight took place between the 2 surveys used by the current study, and may explain a sub-stantial amount of the confusion parents struggled with. Previous investigations conducted among low-income mothers who incorrectly perceived their over-weight preschool children as about the right weight revealed that these mothers expressed a distrust of growth charts,6,38
and that the charts are ethnically biased and therefore invalid.38,39 There is also
a possibility that parents were reluctant to
admit that their child was overweight be-cause of social pressure to maintain a lower weight, and the stigma attached to obesity.
Thefindings of the current study are supported by the social comparison theory. The theory postulates that indi-viduals assess themselves in relation to others rather than against an absolute scale.17,40 In the wake of the obesity
pandemic, more and more parents may compare their child to peers or friends of their child to maintain a positive im-age of their own child. The numbers, mathematical calculations, and growth charts recommended by professional organizations or health professionals are more remote from parent’s thoughts
FIGURE 2
Shifting distribution of BMIzscores between the 2 survey periods. Parentally perceived overweight children ages 6 to 11 years, NHANES 1988–1994 and 2005– 2010. BMI percentiles were calculated age-gender-specifically based on directly measured height and weight by using the CDC 2000 growth chart and ex-cluding extreme values (ie,zscore.4).24The statistics were calculated by using SAS survey procedures with appropriate weighting and nesting variables; however, the histograms were generated without weighting and nesting variables by using PROC UNIVARIATE of SAS.aThe Kurtosis refers to“excess kurtosis.” The standard normal distribution has a kurtosis of 0, positive Kurtosis indicates a“peaked”distribution, and a negative one indicates a“flat”distribution. *P
value for the difference between 2 surveys,.05.
than children of the same age, and are less likely to be used by parents as the reference. Hence, as the prevalence of pediatric obesity has tripled within
dec-ades, the socially accepted ideal body weight may also be shifting accordingly.
Health-related behavior of school-aged children remains largely under the
in-fluence and control of their parents32;
however, a majority of obesity inter-ventions are school based with limited parent involvement.41 Crucial to
pa-rental involvement in weight reduction or maintenance efforts among children is parental recognition of their child’s overweight status. This recognition and the associated health risks are the main driving force motivating parents to take action.10,42,43Parents with accurate
per-ceptions have a greater readiness to make weight related behavioral changes and are more effective in making it happen.42,44 Various recommendations
and great efforts have been made to improve maternal perception and in-crease parental involvement and commit-ment.45However, the declining tendency to
appropriately classify overweight/obese children among parents revealed that the efforts have been unsatisfactorily successful.
calculated by using weighted population. The lower and upper limits of the 95% CIs were calculated by using SAS survey procedures with appropriate weighting and nesting variables. The asterisk indicates that the difference between the 2 surveys was statistically significant.aDue to the small sample sizes, the 95% lower CI for the high income group (unweightedn= 23) in 1988–1994 was 1.04, smaller than the minimum value presented in the chart, which is 1.30.
TABLE 1 The Probability of Being Parentally Perceived as Overweight. Sample of Directly Measured Overweight/Obese Children Ages 6–11 y, NHANES 1988–1994 and 2005–2010
Survey Period Unweighted Sample Size Probability of Being Parentally Perceived as Overweight
Parentally Perceived
Directly Measured
Probability PR (95% CI)
Overweight Overweight/ Obesea
(95% CI) Unadjusted Adjustedb
Overall
1988–1994 433 806 0.51 (0.45–0.56) 1 (reference) 1 (reference) 2005–2010 531 1168 0.44 (0.45–0.53) 0.84 (0.75–0.95) 0.76 (0.67–0.87) Boys
1988–1994 197 400 0.45 (0.35–0.55) 1 (reference) 1 (reference) 2005–2010 266 589 0.43 (0.38–0.47) 0.91 (0.77–1.09) 0.83 (0.69–0.99) Girls
1988–1994 236 406 0.57 (0.50–0.63) 1 (reference) 1 (reference) 2005–2010 265 579 0.45 (0.40–0.49) 0.78 (0.66–0.93) 0.72 (0.60–0.86) aBMI was calculated by using directly measured body weight and height. Overweight/obese was defined as
age-gender-specific BMI equal to or greater than 85th percentile.25
bThe NHANES III (1988–1994) was used as the reference years. Modified Poisson regression was used to adjust for the BMIz
Thefindings of the current report could also be examined from an alternative perspective. It is well established that overweight/obese children experience psychological distress, including poor self-esteem and depression.30,42,46,47
In-creasing evidence indicates that it might be the perceived body weight rather than actual body weight that appears to be the potent force leading to psycho-logical distress.30,42,46,47 An increasing
percentage of parents classifying their overweight child as about the right weight may suggest a reduction in social pressure to lose weight, and that parents have become more receptive: more willing to admit the fact and re-ceive help and take a more active role in family-based intervention. There are no family members more important than parents to children. Weight-related teas-ing from parents would have a devastat-ing impact on a child’s psycho-emotional wellbeing.32,46 Weight-related teasing is
less likely to occur among receptive parents. The parents’attitude toward a child’s physical health and psychological development as well should be vigilantly protected and carefully maneuvered to enhance family-based childhood obesity prevention efforts.
The current study has limitations. With-out data specifying the relationship
between proxies and children in the 2005–2010 survey, we failed to focus on maternal perception exclusively. It may be more meaningful to examine the issue from the maternal perspective because mothers still take more responsibility for shopping and preparing food, and have a stronger influence on a child’s life style.48The small sample sizes for several
demographic strata prevent us from making definitive conclusions. The bias is also possible because of slight differ-ences in wording for parental descrip-tions in the year 2009–2010. In spite of its cross-sectional nature, observations from different survey years are instructive for overall trends. However, more than 2 cross-sections may be necessary to assess generational shifting of social norms in a time-scale longer than the current study. The current study has its unique strengths as well. To the best of our knowledge, this is the first study using nationally representative sam-ples with consistently high response rates (.85%) to investigate generational shifting of weight-related social norms from a parental perspective.49The
spec-trum of participants, including 3 ma-jor ethnicities and other demographic diversity, gave us the ability to exam-ine the issue among a diverse scope of children.
CONCLUSIONS
From the year 1988 to 2010, the proba-bility of weight status being appropriately perceived by parents declined by 24% among overweight peri-pubertal chil-dren, presenting a vast challenge to family-based pediatric obesity pre-vention. Novel strategies should be de-veloped to target parental recognition of their child’s weight status. Sensitive and culturally competent dialogues to en-courage parental involvement are needed to unleash parental power.31
Frontline clinical care providers can play a crucial role in identifying children with unhealthy weight and assisting parents with appropriate family-based obe-sity prevention strategies. By alerting each parent whose child has a weight issue and providing evidence-based interventions, we can effectively re-duce the burden of childhood obesity in the United States.
ACKNOWLEDGMENTS
We thank Dr Wei Wang, Fudan University, Shanghai, China, for her timeless effort and patience in analytic supports. We gratefully acknowledge the assistance of the graduate students in Georgia Southern University, Statesboro, who provided im-measurable contributions to the project.
REFERENCES
1. Ogden CL, Carroll MD, Kit BK, Flegal KM.
Prevalence of childhood and adult obesity in the United States, 2011-2012.JAMA. 2014; 311(8):806–814
2. Anzman SL, Rollins BY, Birch LL. Parental influence on children’s early eating envi-ronments and obesity risk: implications for prevention.Int J Obes (Lond). 2010;34(7): 1116–1124
3. Baughcum AE, Powers SW, Johnson SB, et al. Maternal feeding practices and beliefs and their relationships to over-weight in early childhood. J Dev Behav
Pediatr. 2001;22(6):391–408
4. Carnell S, Edwards C, Croker H, Boniface D,
Wardle J. Parental perceptions of
over-weight in 3-5 y olds.Int J Obes (Lond). 2005; 29(4):353–355
5. Etelson D, Brand DA, Patrick PA, Shirali A. Childhood obesity: do parents recognize this health risk?Obes Res. 2003;11(11):1362–1368
6. Jain A, Sherman SN, Chamberlin LA, Carter Y, Powers SW, Whitaker RC. Why don’t low-income mothers worry about their preschoolers being overweight?Pediatrics. 2001;107(5):1138–1146
7. Birch LL, Fisher JO. Development of eating behaviors among children and adoles-cents.Pediatrics. 1998;101(3 pt 2):539–549
8. Mathieu ME, Drapeau V, Tremblay A. Parental misperception of their child’s body weight status impedes the assessment of the child’s lifestyle behaviors. Int J Pediatr. 2010.
Avail-able at: http://www.hindawi.com/journals/
ijpedi/2010/306703/. Accessed June 24, 2014
9. Taveras EM, Hohman KH, Price SN, et al. Correlates of participation in a pediatric primary care-based obesity prevention in-tervention.Obesity (Silver Spring). 2011;19 (2):449–452
10. Eckstein KC, Mikhail LM, Ariza AJ, Thomson JS, Millard SC, Binns HJ; Pediatric Practice Research Group. Parents’ perceptions of their child’s weight and health.Pediatrics. 2006;117(3):681–690
11. Baughcum AE, Chamberlin LA, Deeks CM, Powers SW, Whitaker RC. Maternal per-ceptions of overweight preschool children.
Pediatrics. 2000;106(6):1380–1386
1231
13. Fisher L, Fraser J, Alexander C. Caregivers’ inability to identify childhood adiposity: a cross-sectional survey of rural children and their caregivers’attitudes.Aust J Rural Health. 2006;14(2):56–61
14. Jeffery AN, Voss LD, Metcalf BS, Alba S, Wilkin TJ. Parents’awareness of overweight in themselves and their children: cross sectional study within a cohort (EarlyBird 21).BMJ. 2005;330(7481):23–24
15. Burke MA, Heiland FW. Social dynamics of obesity.Econ Inq. 2007;45(3):571–591
16. Burke MA, Heiland FW, Nadler CM. From “overweight” to “about right”: evidence of a generational shift in body weight norms.
Obesity (Silver Spring). 2010;18(6):1226–1234
17. Festinger L. Social psychology and group processes.Annu Rev Psychol. 1955;6:187–216
18. Maximova K, McGrath JJ, Barnett T, O’Loughlin J, Paradis G, Lambert M. Do you see what I see? Weight status mis-perception and exposure to obesity among children and adolescents.Int J Obes (Lond). 2008;32(6):1008–1015
19. Johnson-Taylor WL, Fisher RA, Hubbard VS, Starke-Reed P, Eggers PS. The change in weight perception of weight status among the overweight: comparison of NHANES III (1988–1994) and 1999–2004 NHANES.Int J Behav Nutr Phys Act. 2008;5:9
20. Johnson F, Wardle J. Dietary restraint, body dissatisfaction, and psychological distress: a prospective analysis.J Abnorm Psychol. 2005;114(1):119–125
21. Marques-Vidal P, Melich-Cerveira J, Marcelino G, Paccaud F. High- and persistent- body-weight misperception levels in overbody-weight and obese Swiss adults, 1997-2007.Int J Obes (Lond). 2011;35(12):1549–1550
22. Salcedo V, Gutiérrez-Fisac JL, Guallar-Castillón P, Rodríguez-Artalejo F. Trends in overweight and misperceived overweight in Spain from 1987 to 2007.Int J Obes (Lond). 2010;34(12): 1759–1765
23. Johnson F, Cooke L, Croker H, Wardle J. Changing perceptions of weight in Great Britain: comparison of two population surveys.BMJ. 2008;337:a494
24. Centers for Disease Control and Pre-vention. A SAS program for the CDC growth charts. Available at: www.cdc.gov/nchs/ nhanes/about_nhanes.htm. Accessed June 7, 2012
25. Krebs NF, Himes JH, Jacobson D, Nicklas TA, Guilday P, Styne D. Assessment of child and
tee on Prevention of Obesity in Children and Youth. Preventing childhood obesity: health in the balance: executive summary.J Am Diet Assoc. 2005;105(1):131–138
27. Housing and Household Economic Statistics Division, US Census Bureau. How the Cen-sus Bureau measures poverty (official measure). September 29, 2009. Available at: https://www.census.gov/hhes/www/poverty/ about/overview/measure.html. Accessed April 30, 2014
28. Bloom B, Cohen RA, Freeman G. Summary health statistics for U.S. children: National Health Interview Survey, 2008.Vital Health Stat 10. 2009; (244):1–81
29. Spiegelman D, Hertzmark E. Easy SAS cal-culations for risk or prevalence ratios and differences. Am J Epidemiol. 2005;162(3): 199–200
30. McCormack LA, Laska MN, Gray C, Veblen-Mortenson S, Barr-Anderson D, Story M. Weight-related teasing in a racially diverse sample of sixth-grade children.J Am Diet Assoc. 2011;111(3):431–436
31. Hager ER, Candelaria M, Latta LW, et al. Maternal perceptions of toddler body size: accuracy and satisfaction differ by toddler weight status.Arch Pediatr Adolesc Med. 2012;166(5):417–422
32. He M, Evans A. Are parents aware that their children are overweight or obese? Do they care?Can Fam Physician. 2007;53(9):1493–1499
33. Warschburger P, Kröller K. Maternal percep-tion of weight status and health risks asso-ciated with obesity in children. Pediatrics. 2009;124(1). Available at: www.pediatrics.org/ cgi/content/full/124/1/e60
34. Adair LS. Child and adolescent obesity: epidemiology and developmental per-spectives.Physiol Behav. 2008;94(1):8–16
35. Wang Y. Epidemiology of childhood obesity —methodological aspects and guidelines: what is new?Int J Obes Relat Metab Disord. 2004;28(suppl 3):S21–S28
36. Duncan DT, Wolin KY, Scharoun-Lee M, Ding EL, Warner ET, Bennett GG. Does perception equal reality? Weight misperception in re-lation to weight-related attitudes and behaviors among overweight and obese US adults.Int J Behav Nutr Phys Act. 2011;8:20
37. Himes JH, Dietz WH; The Expert Committee on Clinical Guidelines for Overweight in Adolescent Preventive Services. Guidelines for overweight in adolescent preventive ser-vices: recommendations from an expert committee.Am J Clin Nutr. 1994;59(2):307–316
(11):1548–1555
39. Thompson LS, Story M. Perceptions of overweight and obesity in their community:
findings from focus groups with urban, African-American caretakers of preschool children.J Natl Black Nurses Assoc. 2003; 14(1):28–37
40. Suls J, Martin R, Wheeler L. Social compar-ison: why, with whom, and with what effect?
Curr Dir Psychol Sci. 2002;11:159–163
41. Cleland V, McNeilly B, Crawford D, Ball K. Obesity prevention programs and policies: practitioner and policy-maker perceptions of feasibility and effectiveness. Obesity
(Silver Spring). 2013;21(9):E448–E455
42. Rhee KE, De Lago CW, Arscott-Mills T, Mehta
SD, Davis RK. Factors associated with pa-rental readiness to make changes for overweight children. Pediatrics. 2005;116 (1). Available at: www.pediatrics.org/cgi/ content/full/116/1/e94
43. Howard KR. Childhood overweight: parental perceptions and readiness for change. J Sch Nurs. 2007;23(2):73–79
44. Grimmett C, Croker H, Carnell S, Wardle J. Telling parents their child’s weight status:
psychologi-cal impact of a weight-screening program.
Pediatrics. 2008;122(3). www.pediatrics.org/cgi/ content/full/122/3/e682
45. Mazzeschi C, Pazzagli C, Laghezza L, De Giorgi G, Reboldi G, De Feo P. Parental alli-ance and family functioning in pediatric obesity from both parents’ perspectives.
J Dev Behav Pediatr. 2013;34(8):583–588
46. Bang KS, Chae SM, Hyun MS, Nam HK, Kim JS, Park KH. The mediating effects of per-ceived parental teasing on relations of
body mass index to depression and self-perception of physical appearance and global self-worth in children.J Adv Nurs. 2012;68(12):2646–2653
47. Ikeda JP, Crawford PB, Woodward-Lopez G. BMI screening in schools: helpful or harmful.Health Educ Res. 2006;21(6):761– 769
48. Harden J. Food andfinance: mothers’food practices with young children, on a low income. August 1, 2013. Research Briefing
4. Scottish School of Public Health
49. Centers for Disease Control and
DOI: 10.1542/peds.2014-0012 originally published online August 25, 2014;
2014;134;481
Pediatrics
Andrew R. Hansen, Dustin T. Duncan, Yelena N. Tarasenko, Fei Yan and Jian Zhang
Children
Generational Shift in Parental Perceptions of Overweight Among School-Aged
Services
Updated Information &
http://pediatrics.aappublications.org/content/134/3/481 including high resolution figures, can be found at:
References
http://pediatrics.aappublications.org/content/134/3/481#BIBL This article cites 44 articles, 11 of which you can access for free at:
Subspecialty Collections
http://www.aappublications.org/cgi/collection/public_health_sub Public Health
http://www.aappublications.org/cgi/collection/obesity_new_sub Obesity
following collection(s):
This article, along with others on similar topics, appears in the
Permissions & Licensing
http://www.aappublications.org/site/misc/Permissions.xhtml in its entirety can be found online at:
Information about reproducing this article in parts (figures, tables) or
Reprints
DOI: 10.1542/peds.2014-0012 originally published online August 25, 2014;
2014;134;481
Pediatrics
http://pediatrics.aappublications.org/content/134/3/481
located on the World Wide Web at:
The online version of this article, along with updated information and services, is
by the American Academy of Pediatrics. All rights reserved. Print ISSN: 1073-0397.