INTERNATIONAL RESEARCH JOURNAL OF PHARMACY
www.irjponline.com
ISSN 2230 – 8407
Research Article
STABILITY INDICATING HPTLC METHOD DEVELOPMENT FOR SIMULTANEOUS ESTIMATION OF
ACYCLOVIR AND HYDROCORTISONE IN API AND PHARMACEUTICAL DOSAGE FORM
Pallavi R Chopra
1, Janhavi R Rao
1* and Chaitali Dhale
21
Department of Pharmaceutical Chemistry, Bharati Vidyapeeth (Deemed to be university), Poona College of Pharmacy,
Pune, Maharashtra, India
2
Department of Quality Assurance, Bharati Vidyapeeth (Deemed to be university), Poona College of Pharmacy, Pune,
Maharashtra, India
*Corresponding Author Email:[email protected]
Article Received on: 26/07/19 Approved for publication: 07/09/19
DOI: 10.7897/2230-8407.1010301
ABSTRACT
An accurate, precise, sensitive, selective stability indicating High Performance Thin Layer Chromatographic method has been developed and validated for simultaneous estimation of Acyclovir and Hydrocortisone in API and Pharmaceutical dosage form. Chromatographic separation of both the drugs were achieved by using TLC aluminum plates precoated with silica gel 60 F 254 as stationary phase and Toluene: Methanol: Glacial acetic acid in the ratio of 6:4:0.05 v/v/v as mobile phase. Densitometric analysis was carried out in absorbance mode at 250 nm. The Rf value was found to be 0.30 ± 0.02 and 0.73 ± 0.02 for Hydrocortisone and Acyclovir respectively. The method was validated in compliance with ICH guidelines for linearity, Precision, Robustness, Repeatability, Limit of detection, Limit of quantification, Accuracy and Assay. Linear regression analysis data for the calibration curves shows good linear correlation relationship over the concentration ranges from 1000-6000 ng/spot with R² = 0.9997 and 20-1200 ng/spot with R² = 0.9997 for Acyclovir and Hydrocortisone respectively. The Limit of detection and Limit of quantification were 240 and 720 ng/spot for Acyclovir while 400 and 1220 ng/spot for Hydrocortisone. The recoveries of Hydrocortisone and Acyclovir were found to be 98.6 and 99.8%. The drugs were subjected to acidic, basic, neutral, oxidative, thermal and photolytic conditions with below 20% degradation.
Keywords: Acyclovir, Hydrocortisone, HPTLC, Stability indicating study, Validation
INTRODUCTION
Acyclovir is an antiviral drug, viral (HSV-1, HSV-2, and VZV). Thymidine kinase converts acyclovir to acyclovir monophosphate which is then converted to diphosphate by cellular guanylate kinase and finally to triphosphate by phosphoglycerate kinase, phosphoenolpyruvate kinase and pyruvate kinase. Acyclovir triphosphate competitively inhibits viral DNA polymerase and competes with natural deoxyguanosine triphosphate for the incorporation into viral DNA. Once incorporated Acyclovir triphosphate inhibits DNA synthesis by acting as chain terminator1-2.
The anti-inflammatory actions of corticosteroids are thought to involve lipocortins, phospholipase A2 inhibitory proteins which, through inhibition of arachidonic acid, control the biosynthesis of prostaglandins and leukotrienes. Specifically, glucocorticoids induce lipocortin-1 (annexin-1), synthesis which then binds to cell membrane preventing phospholipase (A2) from coming in contact with arachidonic acid. This leads to diminished eicosanoid production3-4.
Glucocorticoids also stimulate the lipocortin-1 escaping to the extracellular space, where it binds to the leukocyte membrane receptors and inhibits various inflammatory events: epithelial adhesion, emigration, chemo taxis, phagocytosis, respiratory
chemokines etc.) from neutrophils, macrophages and mastocytes.5
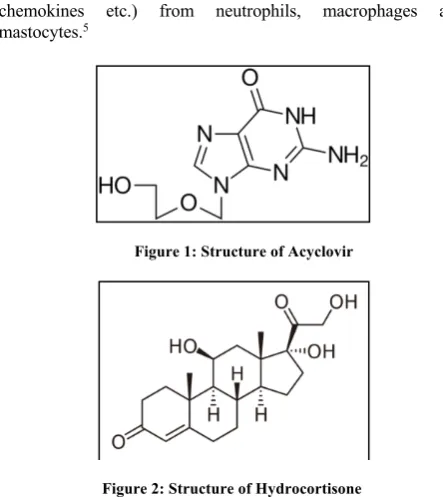
Figure 1: Structure of Acyclovir
Figure 2: Structure of Hydrocortisone
simultaneous estimation of Acyclovir and Hydrocortisone and no stability studies are reported.6-7
So there was a need to develop HPTLC method because of its enormous flexibility, parallel separation of many samples with minimum time requirement and simultaneous visual evaluation of many samples and its components.8-9
The main objective of this method is to develop simple, precise, cost effective stability indicating HPTLC method with a wide linear range and good reproducibility for simultaneous estimation of Acyclovir and Hydrocortisone in API and pharmaceutical dosage forms.
MATERIALS AND METHODS
ACY and HYDRO were provided as gift samples from Apotex Pharmaceuticals, Bangalore. Marketed formulation consists of 5 mg of Acyclovir and 1 mg of Hydrocortisone was procured from local market of Chhattisgarh. Analytical grade solvents and TLC aluminum plates precoated with silica gel F 254 used for this study were purchased from Merck Pvt. Ltd, Mumbai
Equipments
Chromatographic separation of drug was performed by using precoated silica gel TLC plates F 254, 20 x 20 cm size. Samples were applied on the TLC plates in the form of bands, width 6 mm using Hamilton micro liter syringe (100 µl). Linear ascending development was carried out in 10 × 10 cm twin trough glass chamber (CAMAG) using mobile phase which consists of Toluene: Methanol: Glacial acetic acid in the ratio of 6:4:0.05 v/v/v. The slit dimension was kept as 5 × 0.45 mm. The optimized saturation time for mobile phase was 30 min. Chromatogram was run till the distance of 8 cm. After development the plate was dried and densitometric analysis was performed on a Camag TLC. Scanner equipped with win CATS software version 1.4.4.6337 at 250 nm. The source of radiation utilized was deuterium lamp.
Method development
Preparation of standard stock solution (S1)
10 mg of Acyclovir and 10 mg of Hydrocortisone were weighed accurately and transferred into separate 10 ml volumetric flask and the volume was made up to mark and with methanol to get standard stock solution of Acyclovir A1 (1000 μg/ml) and Hydrocortisone H1 (1000 μg/ml) respectively.10-19
Preparation of working standard solution (S2)
5 ml of standard stock solution of Acyclovir A1 (1000 μg/ml) was diluted with methanol up to 10 ml to get working stock solution of ACY (A2, 500μg/ml). 1 ml of standard stock solution of Hydrocortisone H1 (1000 μg/ml) was diluted with methanol up to 10 ml to get working stock solution of HYDRO (H2, 100 μg/ml) solutions.
Preparation of mixed standard solution (S3)
5 ml working stock solution of ACY (A2, 500 μg/ml) and 5 ml of
Optimization of Chromatographic method
The main objective in developing stability indicating HPTLC method is to achieve a good resolution of Acyclovir and Hydrocortisone and its degradation products.
Validation of Analytical Method
The following parameters were used for validation of the developed method. The method was validated as per the ICH guideline for linearity, Precision, Robustness, and Repeatability, limit of detection, limit of quantification, accuracy and assay.20-21
Linearity
The mixed standard solution of Hydrocortisone (100 μg/mL) 0.2, 0.4, 0.6, 0.8, 1.2 µl and Acyclovir (500 μg/mL) 1, 2, 3, 4, 5 and 6 µl was applied on TLC plate. The linear regression data for calibration curves (n = 3) showed good linear relationship over a concentration range of 200-1200 ng/spot for Hydrocortisone and 1000-6000 ng/spot for Acyclovir. The calibration curves were developed by plotting peaks of areas vs. concentrations.22-25
Precision
The precision of the method was verified by Intraday and Interday precision studies.2, 4 and 6 µl spots of Acyclovir and 0.4, 0.8 and 1.2 µl spot of Hydrocortisone were applied on TLC plate. % RSD was calculated by analyzing standard stock solution of Acyclovir and Hydrocortisone within the calibration range, three times in a day for Intraday precision and three consecutive different days for Interday precision.
LOD and LOQ
The sensitivity measurement of Acyclovir and Hydrocortisone was determined in terms of the LOD and LOQ. The LOD and LOQ were calculated using the equation.
LOD = 3.3 (SD) X S LOQ = 10 (SD) X S
Where SD is standard deviation and S = slope of the linear regression equation
Robustness
Robustness studies were done by making small, deliberate changes in optimized condition like mobile phase composition; saturation time and wavelength (n = 3). The acceptance criterion for % RSD was NMT 2% which is within the accepted range.
Repeatability
Repeatability of sample application was assessed by spotting 2 µl spot of Acyclovir and 0.4 µl spot of Hydrocortisone on TLC plate. This procedure was repeated 6 times. The repeatability of method was evaluated by calculating % RSD.
Recovery
Assay
The percentage purity is not less than 98.5% and not more than 101.0% for Acyclovir while for hydrocortisone it is not less than 96% and not more than 104.0% as per Indian Pharmacopeia
Forced degradation studies
Forced degradation studies for various parameters were performed as per ICH guidelines. According to ICH guidelines the degradation should be between 5 to 20%.
Following procedures were applied for all the studies after carrying out acidic, basic, oxidative, thermal and photolytic degradation as per ICH guidelines.
Acid Degradation
5 ml of mixed standard solution of Acyclovir and Hydrocortisone (S3) and 5 ml of 0.1N HCl was kept at room temperature for 8 hrs. Standard solution of Acyclovir (500 μg/ml), standard solution of Hydrocortisone (100 μg/ml) and the degraded respective samples of Acyclovir and Hydrocortisone were spotted on TLC plates of size 7 x 10 cm and the plate was run with mobile phase consisting of Toluene: Methanol: Glacial Acetic acid in the ratio of 6:4:0.05 v/v/v. The plate was dried and scanned at 250 nm. Densitogram was recorded and % degradations were calculated.
Base degradation
5 ml of mixed standard solution of Acyclovir and Hydrocortisone (S3) and 5 ml of 0.1N NaOH was kept at room temperature for 8 hrs. Standard solution of Acyclovir (500 μg/ml), standard solution of Hydrocortisone (100 μg/ml) and the degraded respective samples of Acyclovir and Hydrocortisone were spotted on TLC plates of size 7 x 10 cm and the plate was run with mobile phase consisting of Toluene: Methanol: Glacial Acetic acid in the ratio of 6:4:0.05 v/v/v. The plate was dried and scanned at 250 nm. Densitogram was recorded and % degradations were calculated.
Oxidative degradation
5 ml of mixed standard solution of Acyclovir and Hydrocortisone (S3) and 5 ml of 3% H2O2 was kept at room temperature for 8 hrs.
Standard solution of Acyclovir (500 μg/ml), standard solution of Hydrocortisone (100 μg/ml) and the degraded respective samples of Acyclovir and Hydrocortisone were applied on TLC plate and the plate was run with mobile phase consisting of Toluene: Methanol: Glacial Acetic acid in the ratio of 6:4:0.05 v/v/v. The plate was dried and scanned at 250 nm. Densitogram was recorded and % degradations were calculated.
Thermal degradation
10 mg of Acyclovir and 10 mg of Hydrocortisone powder was kept in a petridish. Petridish was kept in hot air oven at 60˚C. Powdered sample of 1 mg were withdrawn after 30 min, 1 h, 2 h, 3 h and 4 h till 8 h intervals and diluted with methanol. Spot of mixed standard solution and resultant degraded solution was applied on TLC plate and the plate was run with mobile phase consisting of Toluene: Methanol: Glacial Acetic acid in the ratio
of 6:4:0.05 v/v/v. The plate was dried and scanned at 250 nm. Densitogram was recorded and % degradations were calculated.
Photolytic degradation
The photochemical stability of the drug was studied by exposing the working standard solution of Acyclovir and Hydrocortisone to direct sunlight for 8 h. Powdered sample of 1 mg were withdrawn after 30 min, 1 h, 2 h, 3 h and 4 h till 8 h intervals and diluted with methanol. The resultant solution was applied on TLC plate and the plate was run with mobile phase consisting of Toluene: Methanol: Glacial Acetic Acid in the ratio of 6:4:0.05v/v/v. The plate was dried and scanned at 250 nm. Densitogram was recorded and % degradations were calculated.
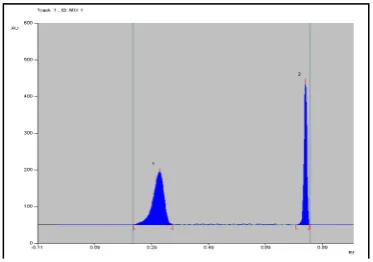
Figure 3: Representative Densitogram of Acyclovir and Hydrocortisone by HPTLC method
Figure 4: Linearity Graph of Acyclovir
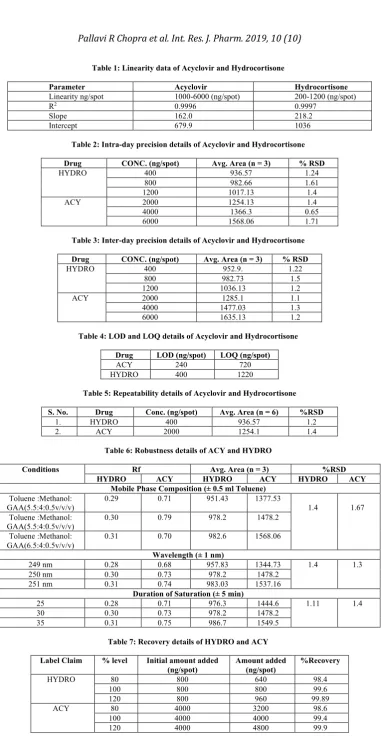
Table 1: Linearity data of Acyclovir and Hydrocortisone
Parameter Acyclovir Hydrocortisone
Linearity ng/spot 1000-6000 (ng/spot) 200-1200 (ng/spot) R2 0.9996 0.9997
Slope 162.0 218.2 Intercept 679.9 1036
Table 2: Intra-day precision details of Acyclovir and Hydrocortisone
Drug CONC. (ng/spot) Avg. Area (n = 3) % RSD
HYDRO 400 936.57 1.24 800 982.66 1.61 1200 1017.13 1.4 ACY 2000 1254.13 1.4 4000 1366.3 0.65 6000 1568.06 1.71
Table 3: Inter-day precision details of Acyclovir and Hydrocortisone
Drug CONC. (ng/spot) Avg. Area (n = 3) % RSD
HYDRO 400 952.9. 1.22 800 982.73 1.5 1200 1036.13 1.2 ACY 2000 1285.1 1.1 4000 1477.03 1.3 6000 1635.13 1.2
Table 4: LOD and LOQ details of Acyclovir and Hydrocortisone
Drug LOD (ng/spot) LOQ (ng/spot)
ACY 240 720 HYDRO 400 1220
Table 5: Repeatability details of Acyclovir and Hydrocortisone
S. No. Drug Conc. (ng/spot) Avg. Area (n = 6) %RSD
1. HYDRO 400 936.57 1.2 2. ACY 2000 1254.1 1.4
Table 6: Robustness details of ACY and HYDRO
Conditions Rf Avg. Area (n = 3) %RSD
HYDRO ACY HYDRO ACY HYDRO ACY
Mobile Phase Composition (± 0.5 ml Toluene)
Toluene :Methanol: GAA(5.5:4:0.5v/v/v)
0.29 0.71 951.43 1377.53
1.4 1.67 Toluene :Methanol:
GAA(5.5:4:0.5v/v/v) 0.30 0.79 978.2 1478.2 Toluene :Methanol:
GAA(6.5:4:0.5v/v/v)
0.31 0.70 982.6 1568.06
Wavelength (± 1 nm)
249 nm 0.28 0.68 957.83 1344.73 1.4 1.3 250 nm 0.30 0.73 978.2 1478.2
251 nm 0.31 0.74 983.03 1537.16
Duration of Saturation (± 5 min)
25 0.28 0.71 976.3 1444.6 1.11 1.4 30 0.30 0.73 978.2 1478.2
35 0.31 0.75 986.7 1549.5
Table 7: Recovery details of HYDRO and ACY
Label Claim % level Initial amount added
(ng/spot)
Amount added (ng/spot)
%Recovery
Table 8: Assay details of HYDRO and ACY
Drug Rf Drug Content (%) Mean %
HYDRO 0.30 99.8 99.76 99.6
99.89
ACY 0.73 98.6 99.3 99.4
99.9
Figure 6: Acid Degradation of Hydro cortisone and Acyclovir with 0.1N HCl
Table 9: Details of acid degradation study
Peak Rf %
Std Hydrocortisone (H1) 0.30 - Degradant peak (H2) 0.42 13.8
Std Acyclovir (A1) 0.72 - Degradant Peak (A2) 0.84 8.4
Figure 7: Base Degradation of Hydrocortisone and Acyclovir with 0.1N NaOH
Table 10: Details of base degradation study
Peak Rf %
Std Hydrocortisone (H1) 0.30 - Degradant peak (H2) 0.42 7.10
Std Acyclovir (A1) 0.73
Degradant Peak (A2) 0.85 16.07
Figure 8: Oxidative degradation of Hydrocortisone and Acyclovir with 3% Hydrogen peroxide
Table 11: Details of oxidative degradation study
S. No. Peak Rf %
1. Std Hydrocortisone (H1) 0.30 - 2. Degradant peak (H2) 0.43 8.8 3. Std Acyclovir (A1) 0.73 - 4. Degradant Peak (A2) 0.84 16.4
Figure 9: Thermal Degradation of Hydrocortisone and Acyclovir
Table 12: Details of thermal degradation study
S. No. Peak Rf %
1. Std Hydrocortisone (H1) 0.30 - 2. Degradant peak (H2) 0.42 6.06 3. Std Acyclovir (A1) 0.73 - 4. Degradant Peak(A2) 0.85 2.3
Table 13: Details of Photolytic degradation study
S. No. Peak Rf %
1. Std Hydrocortisone 0.30 - 2. Degradant peak 0.42 9.6 3. Std Acyclovir 0.73 4. Degradant Peak 0.81 6.8
RESULTS AND DISCUSSION
The separation was achieved by linear ascending development in 10 cm × 10 cm twin trough glass chamber using Toluene: methanol: Glacial acetic acid in the ratio of 6:4:0.05 v/v/v as mobile phase and detection was carried out at 250 nm. The retention factors were found to be 0.30 ± 0.02 and 0.73 ± 0.02 for Hydrocortisone and Acyclovir respectively.
The developed HPTLC method was validated as per ICH guidelines. The developed method found to be linear within the range of 1000-6000 ng/spot with R2 = 0.9997 and 200-1200
ng/spot with R2 for Acyclovir and Hydrocortisone respectively.
The accuracy of the method was determined at 80%, 100% and 120% level. The percentage recoveries of Acyclovir and Hydrocortisone were found to be 99.7 and 99.3% respectively. The Limit of detection and Limit of quantification of Acyclovir were found to be 240 and 720 ng/spot while Limit of detection and Limit of quantification of Hydrocortisone was 400 and 1220 ng/spot. The developed method was found to be precise as the % RSD values were not more than 2%. The method was found to be robustness as indicated by % RSD values were not more than 2%. The content of Acyclovir and Hydrocortisone in cream has 5 mg of Acyclovir and 1 mg of Hydrocortisone shows no interference from the excipients commonly present in cream.
Forced Degradation study for Acyclovir and Hydrocortisone such as acid degradation shows % degradation at 8.4 and 13.8%, base degradation shows at16.07 and 7.10%, oxidative degradation shows at 16.4 and 8.8%, Thermal degradation shows at 2.3 and 6.06% and photolytic degradation shows at 6.8 and 9.6% degradations.
Densitogram of Acyclovir and Hydrocortisone was shown in Figure 3 whereas densitograms for forced degradation studies were given in Figure 6-10 and results were given in Table 9-13.
CONCLUSION
A simple, specific, precise and accurate HPTLC method has been established as stability indicating method for simultaneous estimation of HYDRO and ACY respectively in API and pharmaceutical dosage form. ICH guidelines were followed throughout the study for method validation and stress testing. Developed HPTLC method effectively separate principle drug peak from degradation product peaks; it can be employed as a stability indicating method.
The intrinsic stability of Acyclovir and Hydrocortisone are established using various ICH recommended stress conditions. The drug Acyclovir was found to be degraded in acid, base, and oxidative conditions, while the drug Hydrocortisone was degraded in acid, alkali, oxidative, neutral and thermal conditions. As the method could effectively separate principle drug peak from degradation product peak, it can be employed as
ACKNOWLEDGEMENTS
I am thankful to Bharati Vidyapeeth (Deemed to be university), Poona College of Pharmacy for providing necessary facilities which helped me a lot in successful completion of project.
REFERENCES
1. Tripathi. KD. Essentials of Medical Pharmacology; 2013. p. 799-800
2. Douglas A. Skoog F. James Holler and Stanley R. Crouch. Instrumental analysis; 2007. p. 13-14.
3. Gurdeep R. Chatwal, Sham K Anand. Instrumental Methods of Chemical Analysis; p. 2.566-2.567
4. Yallapu MM, Jaggi M, Chauhan SC. Curcumin nano-formulations: a future nano-medicine for cancer 2012; 17: 71-80.
5. Lunn G. HPLC methods for recently approved pharmaceuticals. John Wiley and Sons; 2005.
6. Zovirax dosing, indications, interactions, adverse effects, and more; 2014.
7. Acyclovir. The American Society of Health Pharmacists; 2015.
8. Tzanavaras PD and Themelis DG. High-throughput HPLC assay of acyclovir and its major impurity guanine using a monolithic column and a flow gradient approach. Journal of Pharmaceutical and Biomedical Analysis 2007; 4(9): 1526– 1530.
9. Ravi SS.Text book of Pharmaceutical Analysis. Rx. Tirunelveli, India; 2010. p. 183-184.
10.Hussain MF, Bhadra S, Kumar U, Rouf SS. Stress Degradation studies on aceclofenac and development of a validated stability-indicating reversed-phase HPLC assay in tablet dosage form 2013; 6(3): 131-146.
11.Roy A, Yohannan D, Lalitha K, Saha RN. Development of rapid UV spectrophotometric methods for estimation of celecoxib and acyclovir in formulations. Indian Journal of Pharmaceutical Education Research 2008; 7(24): 215-216. 12.Pant P, Saradhi V, Felice SC, Gurung B, Divya VG, Rao NM.
Spectrophotometric determination of acyclovir through oxidative coupling of with 2, 2’-Bipyridine by Horsradish peroxidase HRP 2009; 18(1): 7-12.
13.Reddy SA, Chakra borty R, Sen S, Parameshappa B. Spectrophotometric determination and validation of Acyclovir 2011; 3(9): 328-32.
14.Patel J, Patel D, Desai S. Simultaneous Spectrophotometric estimation of Naphazoline Nitrate and Hydrocortisone in nasal Drops 2016; 6 (20): 1-4.
15.Reepmeyer JC. Screening for corticosteroids in topical pharmaceuticals by HPLC with a scanning ultraviolet detector. Journal of liquid chromatography and related technology 2001; 2(11): 693-09.
16.Priyanka Agrawal, Janhavi R Rao, Chaitali Dhale. Development and Validation of stability indicating HPTLC method for simultaneous estimation of Aspirin, Clopidogrel Bisulphate and Rosuvastatin calcium in bulk and pharmaceutical dosage formulation 2018; 11(1): 85-93. 17.Prachi Sabne, Dr Janhavi Rao, Chaitali Dhale. Stability
International Journal of Pharmaceutical Sciences and Research 2018; 17(3): 2-11.
19.Kanchan Shelar, Janhavi R Rao and Chaitali Dhale. Stability indicating HPTLC method development and validation for simultaneous estimation of Amlodipine besylate and Losartan Potassium and characterization of acid degradant product of Losartan, International Journal of Pharmaceutical Sciences and Research 2019; 3(10): 14-21.
20.International Conference on Harmonization, Q1A R2 Stability Testing of New Drug Substances and Products; 2003.
21.ICH, Validation of Analytical Procedures; Methodology, Q2 R11996
22.ICH guidelines Q1C, 1997 Stability Testing for New Dosage Forms
23.ICH guidelines Q2 R1, 1996 Validation of Analytical Procedure
24.ICH guidelines Q2A, 1994 Text on validation of Analytical Procedures.
25.ICH guidelines Q2B, 1996 Validation of Analytical Procedures-Methodology.
Cite this article as:
Pallavi R Chopra et al. Stability indicating HPTLC method development for simultaneous estimation of Acyclovir and Hydrocortisone in API and Pharmaceutical dosage form. Int. Res. J. Pharm. 2019;10(10):70-76 http://dx.doi.org/10.7897/2230-8407.1010301
Source of support: Nil, Conflict of interest: None Declared