University of Pennsylvania
ScholarlyCommons
Publicly Accessible Penn Dissertations
2019
Cortical And Subcortical Mechanisms For Sound
Processing
Jennifer Blackwell
University of Pennsylvania, [email protected]
Follow this and additional works at:https://repository.upenn.edu/edissertations Part of theNeuroscience and Neurobiology Commons
This paper is posted at ScholarlyCommons.https://repository.upenn.edu/edissertations/3275
For more information, please [email protected]. Recommended Citation
Blackwell, Jennifer, "Cortical And Subcortical Mechanisms For Sound Processing" (2019).Publicly Accessible Penn Dissertations. 3275.
Cortical And Subcortical Mechanisms For Sound Processing
Abstract
The auditory cortex is essential for encoding complex and behaviorally relevant sounds. Many questions remain concerning whether and how distinct cortical neuronal subtypes shape and encode both simple and complex sound properties. In chapter 2, we tested how neurons in the auditory cortex encode water-like sounds perceived as natural by human listeners, but that we could precisely parametrize. The stimuli exhibit scale-invariant statistics, specifically temporal modulation within spectral bands scaled with the center frequency of the band. We used chronically implanted tetrodes to record neuronal spiking in rat primary auditory cortex during exposure to our custom stimuli at different rates and cycle-decay constants. We found that, although neurons exhibited selectivity for subsets of stimuli with specific statistics, over the population responses were stable. These results contribute to our understanding of how auditory cortex processes natural sound statistics. In chapter 3, we review studies examining the role of different cortical inhibitory interneurons in shaping sound responses in auditory cortex. We identify the findings that support each other and the mechanisms that remain unexplored. In chapter 4, we tested how direct feedback from auditory cortex to the inferior colliculus modulated sound responses in the inferior colliculus. We optogenetically activated or suppressed cortico-collicular feedback while recording neuronal spiking in the mouse inferior colliculus in response to pure tones and dynamic random chords. We found that feedback modulated sound responses by reducing sound selectivity by decreasing responsiveness to preferred frequencies and increasing
responsiveness to less preferred frequencies. Furthermore, we tested the effects of perturbing intra-cortical inhibitory-excitatory networks on sound responses in the inferior colliculus. We optogenetically activated or suppressed parvalbumin-positive (PV) and somatostatin-positive (SOM) interneurons while recording neuronal spiking in mouse auditory cortex and inferior colliculus. We found that modulation of neither PV-nor SOM-interneurons affected sound-evoked responses in the inferior colliculus, despite significant
modulation of cortical responses. Our findings imply that cortico-collicular feedback can modulate responses to simple and complex auditory stimuli independently of cortical inhibitory interneurons. These experiments elucidate the role of descending auditory feedback in shaping sound responses. Together these results implicate the importance of the auditory cortex in sound processing.
Degree Type
Dissertation
Degree Name
Doctor of Philosophy (PhD)
Graduate Group
Neuroscience
First Advisor
Maria N. Geffen
Second Advisor
Yale Cohen
Subject Categories
Neuroscience and Neurobiology
CORTICAL AND SUBCORTICAL MECHANISMS FOR SOUND PROCESSING
Jennifer M. Blackwell
A DISSERTATION
in
Neuroscience
Presented to the Faculties of the University of Pennsylvania
in
Partial Fulfillment of the Requirements for the
Degree of Doctor of Philosophy
2019
Supervisor of Dissertation
_________________________
Maria N. Geffen, PhD
Associate Professor of Otorhinolaryngology
Graduate Group Chairperson
________________________
Joshua I. Gold, PhD Professor of Neuroscience
Dissertation Committee:
Yale Cohen, Professor of Otorhinolaryngology
Steven Eliades, Assistant Professor of Otorhinolaryngology Christopher Fang-Yen, Associate Professor of Neuroscience
ii
ACKNOWLEDGMENTS
There are so many people who have helped and supported me through my graduate school
journey. First, I want to thank my advisor, Maria, for all the years of unwavering support.
There were few ups and many downs during my time here and Maria was always able to
stay positive and provide the space I needed to work through any difficulties I was facing.
I also want to thank her for her support of my passion in teaching alongside my research.
Even though the Geffen lab was always slightly too cold, the people have always been
warm, supportive, and willing to help each other out in any way. I want to thank Laetitia
Mwilambwe-Tshilobo, Drs. Mark Aizenberg, Ryan Natan, and Isaac Carruthers for their
guidance when I first joined the lab. Our numbers have now expanded, but the lab
environment continues to be friendly and collaborative. Thank you to Solymar
Rolon-Martinez, Xiaomao Ding, Aaron Williams, Karmi Oxman, and Drs. Melanie Tobin and
Linda Garami. I especially want to thank Chris Angeloni for always having the answers to
all of my questions (Cy Twombly will always be the worst though) and Dr. Kath Wood for
being, like me, willing to talk about literally anything (a kindred spirit). My fellow NGG
students, Drs. Peter Dong, Preetika Gupta, Greg Artiushin, and CC Angelakos for the many
years of friendship and laughter – I cannot imagine these years without you. For years of
love and support, bringing me dinner when I was stuck in lab late at night, sending me
terrible jokes from Reddit and many pictures of adorable animals just to brighten my day,
I want to thank Dr. Andrew Moberly. Dad – thank you for being there while I was growing
up and for introducing me to Terry Pratchett, who has gotten me through a lot of stressful
iii
that there is nothing in the world you would not do to help me achieve my dreams, including
staying up to read my textbooks just to help me with my homework, or writing out math
equations on our napkins at the dinner table. Thank you for always being there to talk about
my achievements and my failures whenever I need, and also to bake some crazy things
when I really just needed a break. You never pushed me into one career or another, yet
iv
ABSTRACT
CORTICAL AND SUBCORTICAL MECHANISMS FOR SOUND PROCESSING
Jennifer M. Blackwell
Maria N. Geffen
The auditory cortex is essential for encoding complex and behaviorally relevant
sounds. Many questions remain concerning whether and how distinct cortical neuronal
subtypes shape and encode both simple and complex sound properties. In chapter 2, we
tested how neurons in the auditory cortex encode water-like sounds perceived as natural
by human listeners, but that we could precisely parametrize. The stimuli exhibit
scale-invariant statistics, specifically temporal modulation within spectral bands scaled with the
center frequency of the band. We used chronically implanted tetrodes to record neuronal
spiking in rat primary auditory cortex during exposure to our custom stimuli at different
rates and cycle-decay constants. We found that, although neurons exhibited selectivity for
subsets of stimuli with specific statistics, over the population responses were stable. These
results contribute to our understanding of how auditory cortex processes natural sound
statistics. In chapter 3, we review studies examining the role of different cortical inhibitory
interneurons in shaping sound responses in auditory cortex. We identify the findings that
support each other and the mechanisms that remain unexplored. In chapter 4, we tested
how direct feedback from auditory cortex to the inferior colliculus modulated sound
responses in the inferior colliculus. We optogenetically activated or suppressed
cortico-collicular feedback while recording neuronal spiking in the mouse inferior colliculus in
v
sound responses by reducing sound selectivity by decreasing responsiveness to preferred
frequencies and increasing responsiveness to less preferred frequencies. Furthermore, we
tested the effects of perturbing intra-cortical inhibitory-excitatory networks on sound
responses in the inferior colliculus. We optogenetically activated or suppressed
parvalbumin-positive (PV) and somatostatin-positive (SOM) interneurons while recording
neuronal spiking in mouse auditory cortex and inferior colliculus. We found that
modulation of neither PV- nor SOM-interneurons affected sound-evoked responses in the
inferior colliculus, despite significant modulation of cortical responses. Our findings imply
that cortico-collicular feedback can modulate responses to simple and complex auditory
stimuli independently of cortical inhibitory interneurons. These experiments elucidate the
role of descending auditory feedback in shaping sound responses. Together these results
vi
TABLE OF CONTENTS
ACKNOWLEDGMENTS ... II
ABSTRACT ... IV
TABLE OF CONTENTS ... VI
CHAPTER 1: INTRODUCTION ... 1
SCALE-INVARIANT PROPERTIES OF NATURAL SOUNDS ... 2
THE ROLE OF INHIBITORY INTERNEURONS IN SHAPING ACTIVITY IN THE AUDITORY CORTEX ... 4
DESCENDING MODULATION FROM AUDITORY CORTEX ... 9
REFERENCES ... 12
CHAPTER 2: STABLE ENCODING OF NATURAL SOUNDS IN THE AUDITORY CORTEX ... 24
ABSTRACT ... 24
2.1INTRODUCTION ... 25
2.2RESULTS ... 27
2.3DISCUSSION ... 57
2.4METHODS ... 63
2.4REFERENCES ... 72
vii
3.1REFERENCES ... 108
CHAPTER 4: THE ROLE OF FEEDBACK FROM THE AUDITORY CORTEX IN SHAPING RESPONSES TO SOUNDS IN THE INFERIOR COLLICULUS . 120 ABSTRACT ... 120
4.1INTRODUCTION ... 121
4.2RESULTS ... 124
4.3DISCUSSION ... 146
4.4METHODS ... 149
4.4REFERENCES ... 157
CHAPTER 5: CONCLUSIONS ... 166
1
CHAPTER 1: Introduction
Acoustic signals from the peripheral auditory system enter the cochlear nucleus in
the brainstem via the auditory nerve. From the brainstem, information travels through the
auditory midbrain, the inferior colliculus, to the auditory thalamus, the medial geniculate
body, to the auditory cortex (AC). The auditory cortex is essential for encoding complex
and behaviorally relevant sounds (Nelken, 2004; Aizenberg and Geffen, 2013; Carruthers
et al., 2013, 2015; Mizrahi et al., 2014; Aizenberg et al., 2015). In this dissertation we
address questions about processing of sounds important for everyday hearing in the
auditory cortex.
The goal of our work is to elucidate whether and how distinct cortical neuronal
subtypes and projections shape and encode both simple and complex sound properties. We
address the following questions about auditory processing in the auditory cortex: (1) How
does the auditory cortex encode the statistics of a natural sound such as water?
Experimental auditory stimuli are typically designed to uniformly sample stimulus space.
The particular spectro-temporal statistics of natural sounds are not captured by these
stimuli. Testing how the auditory system processes these stimulus statistics is important
for understanding how organisms interact with behaviorally relevant sounds. (2) How do
inhibitory-excitatory networks shape sound responses in the auditory cortex? Extensive
work has been done to characterize how different cortical neuronal subtypes interact
2
found and mechanisms that remain unclear. (3) How does feedback from the auditory
cortex to the inferior colliculus shape sound processing in the inferior colliculus? Whereas
information is typically thought of as integrated along the auditory system in a hierarchical
fashion, there is extensive feedback within the auditory pathway, including from the
auditory cortex, that can modulate auditory processing and auditory behaviors. However,
the mechanisms by which information processing is shaped via the descending feedback
pathway remain poorly characterized. Modulating direct feedback projections allows us to
test the contributions of feedback in sound processing.
Understanding how different classes of neurons auditory cortex process simple and
complex sounds provides insight into the role of auditory cortex in sound processing and,
thus, auditory behaviors. To introduce these topics, we will describe scale-invariant
properties of natural sounds and known functions of intracortical networks and feedback
in shaping auditory processing.
SCALE-INVARIANT PROPERTIES OF NATURAL SOUNDS
In a rich and complex sensory world, an organism’s sensory systems must extract
and encode a plethora of behaviorally relevant signals from the environment. However, the
computational capacity of neurons places physiological limits on the amount information
we can process. The efficient coding hypothesis postulates that, to compensate for this, the
brain evolved to efficiently process natural inputs by adapting to the statistics of natural
3
sounds, exhibit scale-invariant statistics. These statistical regularities can be used by the
auditory system to recognize categories of sounds even with certain types of modulation,
such as compression of an audio file. One characteristic of natural sounds, like music and
speech, is that the power spectrum scales inversely with the frequency, following the 1/f
statistics law (Voss and Clarke, 1975; Attias and Schreiner, 1997; Singh and Theunissen,
2003). The temporal modulation spectrum also obeys scale-invariant statistics within
frequency bands (Voss and Clarke, 1975, 1978; Attias and Schreiner, 1997; Nelken et al.,
1999; Singh and Theunissen, 2003; Garcia-Lazaro et al., 2006; Rodríguez et al., 2010;
McDermott and Simoncelli, 2011).
Sounds with these statistical regularities in their structure are perceived as natural
by human listeners and varying the correlation of spectro-temporal modulations affects the
naturalness of this perception (Voss and Clarke, 1978; Geffen et al., 2011). There are also
neural correlates demonstrating preference for these characteristics, in particular 1/f
temporal modulation (Escabí and Read, 2005; Garcia-Lazaro et al., 2006; Rodríguez et al.,
2010).
In chapter 2, we used an artificial stimulus perceived as natural water sounds, but
that can be parametrized precisely (Geffen et al., 2011), to test how populations of neurons
in auditory cortex encode different sets of parameters contributing to the ‘naturalness’ of
4
THE ROLE OF INHIBITORY INTERNEURONS IN SHAPING
ACTIVITY IN THE AUDITORY CORTEX
In AC, interactions between excitation and inhibition shape sound responses in
excitatory cell populations. Cortical inhibitory interneurons are comprised of a vastly
diverse population, with cells differing both morphologically and physiologically (Figure 1.1). Hundreds of inhibitory neuronal subtypes can be identified depending on the characteristics used for classification (Kawaguchi, 1997; DeFelipe et al., 2013; Kepecs and
Fishell, 2014; Tremblay et al., 2016). The two most predominant classes in the sensory
cortices, classified based on molecular markers, are: parvalbumin-positive (PV) and
somatostatin-positive (SOM) interneurons (Rudy et al., 2011). PVs, the most common
class in the sensory cortex, include the "basket cells", which target excitatory neuronal cell
bodies (Wang et al., 2002). SOMs, the second most common class, contain a large
population of Martinotti cells (Wang et al., 2004), which target the distal dendrites of
excitatory neurons. These differences may have consequences in how PVs and SOMs
shape sound tuning in auditory cortex. PVs are thought to provide global inhibition to
excitatory neuronal populations (Packer and Yuste, 2011), while SOMs could exert a more
specific effect of modulating excitatory neuronal responses to stimuli (Vu and Krasne,
1992; Urban-Ciecko and Barth, 2016). In the auditory cortex, activating PVs decreased
frequency selectivity and increased tone-evoked responses of excitatory neurons (Hamilton
et al., 2013; Aizenberg et al., 2015), producing a mixture of subtractive and divisive shifts
in frequency tuning (Seybold et al., 2015). Suppression of PV interneurons had the opposite
5
tuning were still observed (Phillips and Hasenstaub, 2016). Activating or suppressing
SOMs decreased or increased the activity of excitatory neurons respectively (Seybold et
al., 2015; Phillips and Hasenstaub, 2016), but the effect was more often multiplicative
when SOM activity was reduced as compared with PVs.
Activity in the auditory cortex change with stimulus temporal history, exhibiting
stimulus-specific adaptation (SSA) by reducing response to repeated stimuli (Ulanovsky et
al., 2003; Natan et al., 2015). Inhibitory-excitatory networks support this transformation,
and PVs and SOMs were found to play a differential role in cortical adaptation. SSA is
quantified as the change in response to a rare ‘deviant’ tone presented as part of a sequence
with a common ‘standard’ tone. Suppressing either PVs or SOMs increased the response
to repeated stimuli in excitatory neurons (Natan et al., 2015). However, suppression of
SOMs increased excitatory responses to the standard, but not the deviant tones, whereas
suppressing PVs led to a non-specific response increase (Natan et al., 2015). PVs and
SOMs also differentially affected frequency tuning following adaptation. SOM
suppression increased tone-evoked response to an adapted stimulus, but not upon initial
presentation of the stimulus, specifically for preferred frequencies. In contrast, PV
suppression increased tone-evoked responses to non-preferred frequencies consistently
across stimulus repeats (Natan et al., 2017). These results suggest SOM inhibition
increased with stimulus repetition, while PV inhibition remained stable.
A third class of cortical inhibitory interneuron, the vasoactive intestinal
polypeptide-positive interneurons (VIPs) (Rudy et al., 2011; Tremblay et al., 2016), target
both SOM (Lee et al., 2013; Pfeffer et al., 2013; Pi et al., 2013; Jiang et al., 2015; Walker
6
SOMs. Since SOM and PV interneurons target excitatory cells, VIP interneurons are
ideally placed to modulate cortical activity through disinhibition of excitatory cells via
inhibition of SOM interneurons (Pfeffer et al., 2013). In the auditory cortex, activation of
VIPs caused an additive shift in frequency response curves, increasing in tone-evoked
responses of putative excitatory cells across frequencies (Pi et al., 2013). Activating
cholinergic inputs, which target VIPs, increased frequency selectivity of cortical excitatory
cells by decreasing responses to preferred frequencies and increasing responses to less
preferred frequencies (Nelson and Mooney, 2016). These findings are consistent with VIPs
role in disinhibition of excitatory neurons.
In chapter 3, we discuss previous studies on the function of inhibitory neurons and
microcircuits in audition and, in chapter 4, we test whether and how modulation of cortical
inhibitory-excitatory microcircuits propagates to the inferior colliculus by optogenetically
activating or suppressing cortical PV or SOM inhibitory interneurons and measuring the
7
8
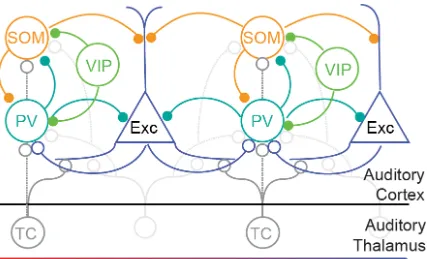
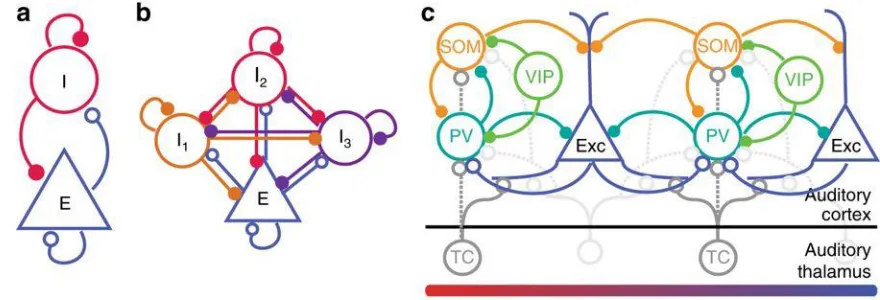
Figure 1.1 Schematic diagram of connectivity between select neurons in the auditory cortex (note that layer-specific information is omitted here): Exc: Excitatory neurons;
PV: parvalbumin-positive interneurons; SOM: somatostatin-positive interneurons; VIP:
vasopressin-positive interneurons; TC: Thalamo-cortical projection neurons. All neuron
types receive additional inputs from other brain areas, which were omitted from the
diagram for simplicity. Open circles: excitatory synapses; closed circles: inhibitory
synapses. Solid lines indicate dominant projections; dashed lines indicate occasional
9
DESCENDING MODULATION FROM AUDITORY CORTEX
Descending feedback allows for modulation of inputs from nuclei earlier in the
ascending pathway. There is extensive feedback within the auditory pathway, which drive
changes in auditory processing and behaviors.
The auditory cortex sends descending projections to the auditory thalamus and
auditory nuclei in the brainstem. Feedback to the medial geniculate body (MGB), the
auditory thalamus, is one of the largest descending auditory pathways. Cortico-thalamic
projections originate from AC layer 5 and 6 (Ojima, 1994; Bajo et al., 1995; Prieto and
Winer, 1999; Williamson and Polley, 2019) and targets both principal neurons as well as
thalamic inhibitory interneurons (Guo et al., 2017). Modulation of AC activity affected
frequency tuning by shifting best frequency of thalamic neurons (Zhang et al., 1997), but
inactivation by cooling had mixed effects on bandwidth, increasing or decreasing
frequency tuning bandwidth in distinct thalamic subpopulations (Villa et al., 1991).
Electrical stimulation of AC increased sound-evoked responses in MGB, although a small
subpopulation of neurons was also suppressed (He et al., 2002). Consistent with this
finding, activation of direct feedback also induced an increase in sound-evoked responses
and similar patterns of change in frequency selectivity are seen in MGB and AC which
depending on timing of activation (Guo et al., 2017). Selectively ablating
cortico-thalamic feedback impaired detection of sound harmonicity (Homma et al., 2017) and
activation modulated discrimination and detection of simple sounds depending on timing
of activation (Guo et al., 2017). These mixed effects are not unexpected given that
10
Projections from auditory cortex terminate in the auditory brainstem, specifically
in the lateral lemniscus (Beneyto et al., 1998; Budinger et al., 2000), superior olivary
complex (Doucet et al., 2003; Coomes and Schofield, 2004), cochlear nucleus (Schofield
and Coomes, 2005; Meltzer and Ryugo, 2006), and the pontine nuclei (Schofield and
Coomes, 2005; Perales et al., 2006). Similar to the cortico-collicular projections,
feedback to brainstem nuclei also originate exclusively in AC layer 5. There is evidence
that modulation of auditory cortex indirectly affects activity of cochlear hair cells (Xiao
and Suga, 2002; Perrot et al., 2006), but the role of cortical feedback in shaping upstream
auditory processing in the brainstem is unclear.
The auditory cortex also sends extensive projections to the inferior colliculus (IC),
the auditory midbrain nucleus, which have been observed in monkeys (Winer et al., 2002),
cats (Winer and Prieto, 2001; Winer et al., 2002), ferrets (Bajo et al., 2007), guinea pigs
(Coomes et al., 2005), gerbils (Bajo and Moore, 2005), and rats (Herbert et al., 1991;
Saldaña et al., 1996; Doucet et al., 2003). This pathway originates predominantly from
ipsilateral layer 5, but also includes projections from layer 6 (Saldaña et al., 1996; Winer
et al., 1998; Doucet et al., 2003; Bajo and Moore, 2005; Coomes et al., 2005; Bajo et al.,
2007; Schofield, 2009). There are also a small subset of projection neurons originating
from the contralateral auditory cortex (Schofield, 2009; Bajo et al., 2010). Projections are
not restricted to a specific region of auditory cortex, but rather from all regions of the
auditory cortex (Winer et al., 1998), although the primary areas of cortex send the densest
projections (Bajo et al., 2007). Cortico-collicular feedback is also tonotopically organized
11
2015), which provides a mechanism by which cortico-collicular feedback could modulate
tuning properties of neurons in IC.
Previous studies demonstrated that neuronal responses to sounds in IC are altered
by focal electrical stimulation and inactivation of AC. Cortical stimulation shifted tuning
properties of IC neurons toward those of the stimulated neurons in frequency (Jen et al.,
1998; Yan and Suga, 1998; Ma and Suga, 2001a; Jen and Zhou, 2003; Yan et al., 2005;
Zhou and Jen, 2007), amplitude (Jen and Zhou, 2003; Yan et al., 2005; Zhou and Jen,
2007), azimuth (Zhou and Jen, 2005, 2007), and duration (Ma and Suga, 2001b).
Stimulation of AC had mixed effects on sound-evoked responses in IC, increasing and
decreasing responses in different subpopulations of neurons (Jen et al., 1998; Zhou and
Jen, 2005). AC inactivation studies, on the other hand, found less consistent effects on IC
responses. Cooling AC altered IC interaural level difference (ILD) sensitivity, causing
shifts in preferred ILDs and increased selectivity bandwidth, although a subset of cells
were unaffected (Nakamoto et al., 2008). It has been found that pharmacological
inactivation of AC caused a shift in best frequency in IC neurons (Zhang et al., 1997).
However, several studies show inactivation of AC had no effect on frequency selectivity
in IC (Jen et al., 1998), but rather modulated sound-evoked and spontaneous activity
(Gao and Suga, 1998; Popelář et al., 2003, 2016).
There is limited data exploring the role of direct cortico-collicular feedback in
shaping sound responses in the inferior colliculus. Activation of cortico-collicular axon
terminals in IC increased sound-evoked responses in IC, while suppression decreased
sound-evoked responses (Xiong et al., 2015). Consistent with the findings that electrical
12
of IC neurons, different patterns of direct cortico-collicular activation enhanced or
suppressed white noise-induced responses in IC (Vila et al., 2019).
Cortico-collicular feedback is also critical for auditory learning. Pairing electrical
leg stimulation with a tone induced a shift in best frequency of IC neurons, while
presentation of a tone alone was insufficient to alter sound responses (Gao and Suga, 1998,
2000). Furthermore, cortico-collicular feedback is necessary for learning to adapt to a
unilateral earplug during a sound localization task (Bajo et al., 2010). Furthermore,
activation of cortico-collicular feedback can induce running in mice and feedback
suppression attenuates running in response to a loud noise (Xiong et al., 2015), implicating
the importance of this feedback pathway in an innate fear response to aversive sounds.
Overall, these findings suggest that AC can modulate sound responses in IC and that the
direct feedback pathway may play an important role in auditory learning.
In chapter 4, we test how direct feedback from the auditory cortex to the inferior
colliculus shapes sound-evoked responses in the inferior colliculus by optogenetically
activating or suppressing direct cortico-collicular projection neurons and measuring
responses to pure tones and dynamic random chords in the inferior colliculus.
REFERENCES
Aizenberg M, Geffen MN (2013) Bidirectional effects of aversive learning on perceptual
acuity are mediated by the sensory cortex. Nat Neurosci 16:994–996.
13
Bidirectional Regulation of Innate and Learned Behaviors That Rely on Frequency
Discrimination by Cortical Inhibitory Neurons. PLoS Biol 13:1–32.
Attias H, Schreiner CE (1997) Temporal Low-Order Statistics of Natural Sounds. Adv
Neural Inf Process Syst 9:27–33.
Attneave F (1954) Some informational aspects of visual perception.
Bajo VM, Moore DR (2005) Descending projections from the auditory cortex to the
inferior colliculus in the gerbil, Meriones unguiculatus. J Comp Neurol 486:101–
116.
Bajo VM, Nodal FR, Bizley JK, Moore DR, King a. J (2007) The Ferret Auditory
Cortex: Descending Projections to the Inferior Colliculus. Cereb Cortex 17:475–
491.
Bajo VM, Nodal FR, Moore DR, King AJ (2010) The descending corticocollicular
pathway mediates learning-induced auditory plasticity. Nat Neurosci 13:253–260.
Bajo VM, Rouiller EM, Welker E, Clarke S, Villa AEP, Ribaupierre Y de, Ribaupierre F
de (1995) Morphology and spatial distribution of corticothalamic terminals
originating from the cat auditory cortex. Hear Res 83:161–174.
Barlow HB (1961) Possible Principles Underlying the Transformations of Sensory
Messages. In: Sensory Communication (Rosenblith WA, ed), pp 217–234. MIT
Press.
14
Microarchitecture of the Mouse Dorsal Inferior Colliculus Revealed through In Vivo
Two-Photon Calcium Imaging. J Neurosci 35:10927–10939.
Beneyto M, Winer JA, Larue DT, Prieto JJ (1998) Auditory connections and
neurochemistry of the sagulum. J Comp Neurol 401:329–351.
Budinger E, Heil P, Scheich H (2000) Functional organization of auditory cortex in the
Mongolian gerbil (Meriones unguiculatus). IV. Connections with anatomically
characterized subcortical structures. Eur J Neurosci 12:2452–2474.
Carruthers IM, Laplagne DA, Jaegle A, Briguglio JJ, Mwilambwe-Tshilobo L, Natan
RG, Geffen MN (2015) Emergence of invariant representation of vocalizations in
the auditory cortex. J Neurophysiol 114:2726–2740.
Carruthers IM, Natan RG, Geffen MN (2013) Encoding of ultrasonic vocalizations in the
auditory cortex. J Neurophysiol 109:1912–1927.
Coomes DL, Schofield BR (2004) Projections from the auditory cortex to the superior
olivary complex in guinea pigs. Eur J Neurosci 19:2188–2200.
Coomes DL, Schofield RM, Schofield BR (2005) Unilateral and bilateral projections
from cortical cells to the inferior colliculus in guinea pigs. Brain Res 1042:62–72.
DeFelipe J et al. (2013) New insights into the classification and nomenclature of cortical
GABAergic interneurons. Nat Rev Neurosci 14:202–216.
Doucet JR, Molavi DL, Ryugo DK (2003) The source of corticocollicular and
15
Escabí MA, Read HL (2005) Neural Mechanisms for Spectral Analysis in the Auditory
Midbrain, Thalamus, and Cortex. Int Rev Neurobiol 70:207–252.
Gao E, Suga N (1998) Experience-dependent corticofugal adjustment of midbrain
frequency map in bat auditory system. PNAS 95:12663–12670.
Gao E, Suga N (2000) Experience-dependent plasticity in the auditory cortex and the
inferior colliculus of bats : Role of the corticofugal system. PNAS 97:8081–8086.
Garcia-Lazaro JA, Ahmed B, Schnupp JWH (2006) Tuning to Natural Stimulus
Dynamics in Primary Auditory Cortex. Curr Biol 16:264–271.
Geffen MN, Gervain J, Werker JF, Magnasco MO (2011) Auditory Perception of
Self-Similarity in Water Sounds. Front Integr Neurosci 5:15.
Guo W, Clause AR, Barth-Maron A, Polley DB (2017) A Corticothalamic Circuit for
Dynamic Switching between Feature Detection and Discrimination. Neuron 95:180–
194.e5.
Hamilton LS, Sohl-Dickstein J, Huth AG, Carels VM, Deisseroth K, Bao S (2013)
Optogenetic activation of an inhibitory network enhances feedforward functional
connectivity in auditory cortex. Neuron 80:1066–1076.
He J, Yu Y-Q, Xiong Y, Hashikawa T, Chan Y-S (2002) Modulatory Effect of Cortical
Activation on the Lemniscal Auditory Thalamus of the Guinea Pig. J Neurophysiol
88:1040–1050.
16
cortex to the inferior colliculus in the rat. J Comp Neurol 304:103–122.
Homma NY, Happel MFK, Nodal FR, Ohl FW, King AJ, Bajo VM (2017) A Role for
Auditory Corticothalamic Feedback in the Perception of Complex Sounds. J
Neurosci 37:6149–6161.
Jen PH-S, Chen QC, Sun XD (1998) Corticofugal regulation of auditory sensitivity in the
bat inferior colliculus. J Comp Physiol A 183:683–697.
Jen PH-S, Zhou X (2003) Corticofugal modulation of amplitude domain processing in the
midbrain of the big brown bat, Eptesicus fuscus. Hear Res 184:91–106.
Jiang X, Shen S, Cadwell CR, Berens P, Sinz F, Ecker AS, Patel S, Tolias AS (2015)
Principles of connectivity among morphologically defined cell types in adult
neocortex. Science (80- ) 350:aac9462.
Kawaguchi Y (1997) Neostriatal cell subtypes and their functional roles. Neurosci Res
27:1–8 Available at:
https://www.sciencedirect.com/science/article/pii/S0168010296011340?via%3Dihu
b [Accessed March 19, 2019].
Kepecs A, Fishell G (2014) Interneuron cell types are fit to function. Nature 505:318–
326.
Lee S, Kruglikov I, Huang J, Fishell G, Rudy B (2013) A disinhibitory circuit mediates
motor integration in the somatosensory cortex. Nat Neurosci 16:1662–1670.
17
Projections From Primary Auditory Cortex to the Central Nucleus of the Inferior
Colliculus in Guinea Pig. J Neurophysiol 97:1413–1427.
Ma X, Suga N (2001a) Plasticity of Bat’s Central Auditory System Evoked by Focal
Electric Stimulation of Auditory and/or Somatosensory Cortices. J Neurophysiol
85:1078–1087.
Ma X, Suga N (2001b) Corticofugal modulation of duration-tuned neurons in the
midbrain auditory nucleus in bats. PNAS 98:14060–14065.
Markovitz CD, Tang TT, Lim HH (2013) Tonotopic and localized pathways from
primary auditory cortex to the central nucleus of the inferior colliculus. Front Neural
Circuits 7:1–11.
McDermott JH, Simoncelli EP (2011) Sound Texture Perception via Statistics of the
Auditory Periphery: Evidence from Sound Synthesis. Neuron 71:926–940.
Meltzer NE, Ryugo DK (2006) Projections from auditory cortex to cochlear nucleus: A
comparative analysis of rat and mouse. Anat Rec Part A Discov Mol Cell Evol Biol
288:397–408.
Mizrahi A, Shalev A, Nelken I (2014) Single neuron and population coding of natural
sounds in auditory cortex. Curr Opin Neurobiol 24:103–110.
Nakamoto KT, Jones SJ, Palmer AR (2008) Descending projections from auditory cortex
modulate sensitivity in the midbrain to cues for spatial position. J Neurophysiol
18
Natan RG, Briguglio JJ, Mwilambwe-Tshilobo L, Jones SI, Aizenberg M, Goldberg EM,
Geffen MN (2015) Complementary control of sensory adaptation by two types of
cortical interneurons. Elife 4:1–27.
Natan RG, Rao W, Geffen Correspondence MN, Geffen MN (2017) Cortical
Interneurons Differentially Shape Frequency Tuning following Adaptation.
CellReports 21:878–890.
Nelken I (2004) Processing of complex stimuli and natural scenes in the auditory cortex.
Curr Opin Neurobiol 14:474–480.
Nelken I, Rotman Y, Yosef OB (1999) Responses of auditory-cortex neurons to structural
features of natural sounds. Nature 397:154–157.
Nelson A, Mooney R (2016) The Basal Forebrain and Motor Cortex Provide Convergent
yet Distinct Movement-Related Inputs to the Auditory Cortex. Neuron 90:635–648.
Ojima H (1994) Terminal Morphology and Distribution of Corticothalamic Fibers
Originating from Layers 5 and 6 of Cat Primary Auditory Cortex. Cereb Cortex
4:646–663.
Packer AM, Yuste R (2011) Dense, Unspecific Connectivity of Neocortical
Parvalbumin-Positive Interneurons: A Canonical Microcircuit for Inhibition? J Neurosci
31:13260–13271.
Perales M, Winer JA, Prieto JJ (2006) Focal projections of cat auditory cortex to the
19
Perrot X, Ryvlin P, Isnard J, Guénot M, Catenoix H, Fischer C, Mauguière F, Collet L
(2006) Evidence for Corticofugal Modulation of Peripheral Auditory Activity in
Humans. Cereb Cortex 16:941–948.
Pfeffer CK, Xue M, He M, Huang ZJ, Scanziani M (2013) Inhibition of inhibition in
visual cortex : the logic of connections between molecularly distinct interneurons.
Nat Publ Gr 16:1068–1076 Available at: http://dx.doi.org/10.1038/nn.3446.
Phillips EA, Hasenstaub AR (2016) Asymmetric effects of activating and inactivating
cortical interneurons. Elife 5:1–22.
Pi H-J, Hangya B, Kvitsiani D, Sanders JI, Huang ZJ, Kepecs A (2013) Cortical
interneurons that specialize in disinhibitory control. Nature 503:521–524.
Popelář J, Nwabueze-Ogbo FC, Syka J (2003) Changes in Neuronal Activity of the
Inferior Colliculus in Rat after Temporal Inactivation of the Auditory Cortex.
Physiol Res 52:615–628.
Popelář J, Šuta D, Lindovský J, Bureš Z, Pysanenko K, Chumak T, Syka J (2016)
Cooling of the auditory cortex modifies neuronal activity in the inferior colliculus in
rats. Hear Res 332:7–16.
Prieto JJ, Winer JA (1999) Layer VI in cat primary auditory cortex: Golgi study and
sublaminar origins of projection neurons. J Comp Neurol 404:332–358.
Rodríguez FA, Chen C, Read HL, Escabí MA (2010) Neural modulation tuning
characteristics scale to efficiently encode natural sound statistics. J Neurosci
20
Rudy B, Fishell G, Lee S, Hjerling-Leffler J (2011) Three groups of interneurons account
for nearly 100% of neocortical GABAergic neurons. Dev Neurobiol 71:45–61.
Saldaña E, Feliciano M, Mugnaini E (1996) Distribution of descending projections from
primary auditory neocortex to inferior colliculus mimics the topography of
intracollicular projections. J Comp Neurol 371:15–40.
Schofield BR (2009) Projections to the inferior colliculus from layer VI cells of auditory
cortex. Neuroscience 159:246–258 Available at:
http://linkinghub.elsevier.com/retrieve/pii/S0306452208016734 [Accessed October
2, 2015].
Schofield BR, Coomes DL (2005) Auditory cortical projections to the cochlear nucleus in
guinea pigs. Hear Res 199:89–102.
Seybold BA, Elizabeth AK, Schreiner CE, Hasenstaub AR, Seybold BA, Phillips EAK,
Schreiner CE, Hasenstaub AR (2015) Inhibitory Actions Unified by Network
Integration Viewpoint Inhibitory Actions Unified by Network Integration. Neuron
87:1181–1192.
Singh NC, Theunissen FE (2003) Modulation spectra of natural sounds and ethological
theories of auditory processing. J Acoust Soc Am 114:3394.
Straka MM, Hughes R, Lee P, Lim HH (2015) Descending and tonotopic projection
patterns from the auditory cortex to the inferior colliculus. Neuroscience 300:325–
337.
21
Cellular Properties to Circuits. Neuron 91:260–292.
Ulanovsky N, Las L, Nelken I (2003) Processing of low-probability sounds by cortical
neurons. Nat Neurosci 6:391–398.
Urban-Ciecko J, Barth AL (2016) Somatostatin-expressing neurons in cortical networks.
Nat Rev Neurosci 17:401–409.
Vila C-H, Williamson RS, Hancock KE, Polley DB (2019) Optimizing optogenetic
stimulation protocols in auditory corticofugal neurons based on closed-loop spike
feedback. bioRxiv.
Villa AEP, Rouiller EM, Simm GM, Zurita P, De Ribaupierre Y, De Ribaupierre F
(1991) Corticofugal modulation of the information processing in the auditory
thalamus of the cat.
Voss RF, Clarke J (1975) “1/f noise” in music and speech. Wiley.
Voss RF, Clarke J (1978) “‘1/f noise’” in music: Music from 1/f noise. Cit J Acoust Soc
Am 63:258.
Vu ET, Krasne FB (1992) Evidence for a Computational Distinction Between Proximal
and Distal Neuronal Inhibition. Science (80- ) 255:1710–1712.
Walker F, Möck M, Feyerabend M, Guy J, Wagener RJ, Schubert D, Staiger JF, Witte M
(2016) Parvalbumin- and vasoactive intestinal polypeptide-expressing neocortical
interneurons impose differential inhibition on Martinotti cells. Nat Commun
22
Wang Y, Gupta A, Toledo-Rodriguez M, Wu CZ, Markram H (2002) Anatomical,
Physiological, Molecular and Circuit Properties of Nest Basket Cells in the
Developing Somatosensory Cortex. Cereb Cortex 12:395–410.
Wang Y, Toledo-Rodriguez M, Gupta A, Wu C, Silberberg G, Luo J, Markram H (2004)
Anatomical, physiological and molecular properties of Martinotti cells in the
somatosensory cortex of the juvenile rat. J Physiol 561:65–90.
Williamson RS, Polley DB (2019) Parallel systems for sound processing and functional
connectivity among layer 5 and 6 auditory corticothalamic neurons. bioRxiv
doi:10.1101/447276.
Winer JA, Chernock ML, Larue DT, Cheung SW (2002) Descending projections to the
inferior colliculus from the posterior thalamus and the auditory cortex in rat, cat, and
monkey. Hear Res 168:181–195.
Winer JA, Larue DT, Diehl JJ, Hefti BJ (1998) Auditory cortical projections to the cat
inferior colliculus. J Comp Neurol 400:147–174.
Winer JA, Prieto JJ (2001) Layer V in cat primary auditory cortex (AI): Cellular
architecture and identification of projection neurons. J Comp Neurol 434:379–412.
Xiao Z, Suga N (2002) Modulation of cochlear hair cells by the auditory cortex in the
mustached bat. Nat Neurosci 5:57–63.
Xiong XR, Liang F, Zingg B, Ji X, Ibrahim LA, Tao HW, Zhang LI (2015) Auditory
cortex controls sound-driven innate defense behaviour through corticofugal
23
Yan J, Zhang Y, Ehret G, Yan J (2005) Corticofugal shaping of frequency tuning curves
in the central nucleus of the inferior colliculus of mice. J Neurophysiol 93:71–83.
Yan W, Suga N (1998) Corticofugal modulation of the midbrain frequency map in the
bat. Nat Neurosci 1:54–58.
Zhang Y, Suga N, Yan J (1997) Corticofugal modulation of frequency processing in bat
auditory system. Nature 387:900–903.
Zhou X, Jen PH-S (2005) Corticofugal modulation of directional sensitivity in the
midbrain of the big brown bat, Eptesicus fuscus. Hear Res 203:201–215.
Zhou X, Jen PH-S (2007) Corticofugal Modulation of Multi-Parametric Auditory
24
CHAPTER 2: STABLE ENCODING OF NATURAL SOUNDS
IN THE AUDITORY CORTEX
Adapted from: Blackwell JM, Taillefumier TO, Natan RG, Carruthers IM, Magnasco MO,
Geffen MN (2016) Stable encoding of sounds over a broad range of statistical parameters
in the auditory cortex, Eur. J. Neurosci. 43:751-764
ABSTRACT
Natural auditory scenes possess highly structured statistical regularities, which are dictated
by the physics of sound production in nature, such as scale-invariance. We recently
identified that natural water sounds exhibit a particular type of scale invariance, in which
the temporal modulation within spectral bands scales with the center frequency of the band.
Here, we tested how neurons in the mammalian primary auditory cortex encode sounds
that exhibit this property, but differ in their statistical parameters. The stimuli varied in
spectro-temporal density and cyclo-temporal statistics over several orders of magnitude,
corresponding to a range of water-like percepts, from pattering of rain to a slow stream.
We recorded neuronal activity in the primary auditory cortex of awake rats presented with
these stimuli. The responses of the majority of individual neurons were selective for a
subset of stimuli with specific statistics. However, as a neuronal population, the responses
25
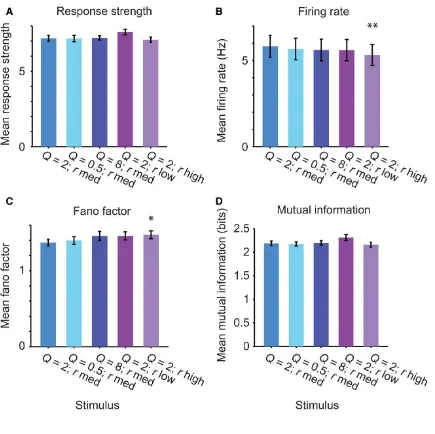
in firing rate, response strength, variability and information rate, and only minor variation
in receptive field parameters. This pattern of neuronal responses suggests a potentially
general principle for cortical encoding of complex acoustic scenes: while individual
cortical neurons exhibit selectivity for specific statistical features, a neuronal population
preserves a constant response structure across a broad range of statistical parameters.
2.1 INTRODUCTION
Natural environmental sounds span a broad range of frequencies, and possess
characteristic spectro‐temporal statistical regularities in their structure (Voss and Clarke,
1975; Singh and Theunissen, 2003). Encoding information about these statistical
regularities is an important processing step in the central auditory pathway, required for
accurate analysis of an auditory scene (Chandrasekaran et al., 2009). Spectro‐temporal
statistical regularities in sounds can be used by the auditory system to recognize specific
sounds and distinguish them from each other (Woolley et al., 2005; Geffen et al., 2011;
McDermott and Simoncelli, 2011; McDermott et al., 2013; Gervain et al., 2014).
The power spectrum of natural sounds scales inversely with the frequency,
following the 1/f statistics law (Voss and Clarke, 1975; Attias and Schreiner, 1997; Singh
and Theunissen, 2003). Furthermore, the overall power spectrum and the temporal
modulation spectrum also obey scale‐invariant statistics. Neurons in the central auditory
pathway encode small variations in spectro‐temporally modulated stimuli (Elhilali et al.,
26
1999; Woolley et al., 2005), and 1/f frequency spectrum in particular (Escabí and Read,
2005; Garcia-Lazaro et al., 2006; Rodríguez et al., 2010). Changes in the statistical
structure of stimuli, including the spectro‐temporal density, or the spectro‐temporal range,
affect response properties of cortical neurons, leading to gain adaptation in their firing rate
(Blake and Merzenich, 2002; Valentine and Eggermont, 2004; Asari and Zador, 2009;
Pienkowski and Eggermont, 2009; Eggermont, 2011; Rabinowitz et al., 2011; Natan et al.,
2015).
Recently, we identified an additional form of scale‐invariance in environmental
sounds (Geffen et al., 2011; Gervain et al., 2014). In sounds of running water, a subset of
environmental sounds, the temporal modulation spectrum across spectral bands scales with
the center frequency of the band (Geffen et al., 2011; Gervain et al., 2014). When the
recording of running water was stretched or compressed temporally, it was still perceived
as a natural, water‐like sound (Geffen et al., 2011). Such a relationship corresponds to the
optimal representation of a sound waveform under sparse coding assumptions (Lewicki,
2002; Garcia-Lazaro et al., 2006; Smith and Lewicki, 2006). Sounds that obeyed the
invariant scaling relationship but which varied in cyclo‐temporal coefficients and spectro‐
temporal sound density evoked different percepts, ranging from pattering of rain to sound
of a waterfall to artificial ringing. In the present study, we adapted this set of stimuli to the
hearing range of rats to examine how changing spectro‐temporal statistical properties affect
responses of neurons in the primary auditory cortex (A1), an essential area for encoding
complex and behaviorally meaningful sounds (Nelken, 2004; Aizenberg and Geffen, 2013;
27
We recorded the responses of neurons in A1 of awake rats to naturalistic, scale‐
invariant sounds, designed to mimic the variety of natural water sounds, as their statistical
structure was varied. We found that individual neurons exhibited tuning for a specific
cyclo‐temporal coefficient and spectro‐temporal density of the stimulus, yet over the
population of neurons, sounds with vastly different statistics evoked a similar range of
response parameters.
2.2 RESULTS
We characterized the responses of neurons in the auditory cortex to acoustic stimuli
designed to capture the statistical properties of natural water sounds. To construct these
stimuli, we adapted the random droplet stimuli that were originally constructed to mimic
the sound percept of water sounds (Geffen et al., 2011; Gervain et al., 2014), for
presentation in the electrophysiological recordings to rats by expanding the frequency
range and sample rate. The stimulus consisted of a superposition of gammatones, which
can be thought of as individual droplet sounds, that are uniformly distributed in log‐
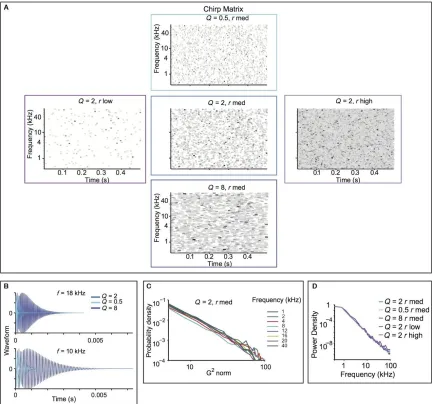
frequency space, and in time (Figure 2.1A). The amplitude of each droplet sound was drawn from a random probability distribution, as described in the Methods. The length of
each droplet sound was scaled relative to its frequency, to mimic the statistical structure of
environmental sounds (Figure 2.1B) (Geffen et al., 2011).
We varied two stimulus parameters: the cyclo‐temporal coefficient, Q, and the
28
decay for the individual droplets, and their center frequency. As such, it regulates how
many cycles are contained within each droplet. Sounds with high Q have a sustained quality
to them, sounding metallic. Sounds with Q = 2 sound natural, water‐like. Sounds with low
Q sound like pattering of rain. For very low Q, sounds are static‐like, resembling fire
crackling or similar fire‐like sounds. r specifies how many droplets per second are
combined to generate the stimulus. Sounds with r high and Q = 2 sound like a fast waterfall,
and with r low and Q = 2 sound like dripping water (Geffen et al., 2011).
To cover the range of variability expected from natural sounds, we selected three
values of Q and r to construct five random droplet stimuli (Geffen et al., 2011) (Figure 2.1A). The probability density of the stimulus gammatone transform exhibited a logarithmic relationship within distinct spectral bands. The density curves overlapped
across a vast range of frequencies, demonstrating that the stimulus preserved the self‐
similar scaling structure, from 1 to 40 kHz (Figure 2.1C). Furthermore, these stimuli had a logarithmic power spectrum (Figure 2.1D). This indicates that these sounds possessed scale‐invariance not just in the power spectrum, but also in temporal statistics across
spectral channels. The random droplet stimulus allowed us to measure not only the
response strength, but also the temporal and spectral time course of the dependency of the
30
Figure 2.1 The random droplet stimulus mimics scale‐invariant structure of natural stimuli,
while allowing spectro‐temporal constant (Q) and density (rate) to vary. A Droplet onset
matrix for the five stimuli used in the study. Each line depicts an individual droplet, plotted
according to its center frequency and onset time. Color depicts relative maximum
amplitude, darker colors corresponding to higher amplitudes. Width corresponds to Q. B
Time course of the waveform for individual droplets. Top: center frequency of 18 kHz.
Bottom: center frequency of 10 kHz. Droplets are depicted for Q = 0.5, 2 and 8. C
Histogram of the gammatone transform of the Q = 2, rmed stimulus. D Power spectrum
31
The stimulus reliably drives auditory‐evoked responses in the primary auditory cortex
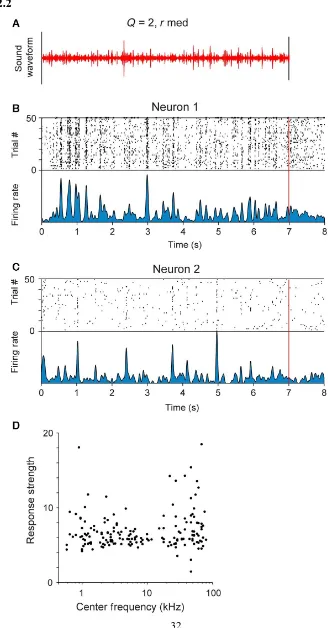
We recorded the activity of 654 units in the primary auditory cortex in awake rats,
in response to the five variants of the random droplet stimulus. We used the stimulus with
Q = 2, rmed, as the baseline stimulus, as this stimulus was perceived as most natural by
human listeners (Geffen et al., 2011). Individual units reliably followed the stimulus,
repeated 50 times, exhibiting a significantly modified level of activity during the stimulus
presentation, as compared with baseline responses (n = 368 out of 654, response strength
> 6, Figure 2.2A–C).
The types of responses ranged from sparse, time‐locked responses to sustained
responses (Figure 2.2B, C). Two representative neuronal responses are depicted in Figure 2.2B and C. Neuron 1 exhibited elevated responses throughout the stimulus presentation
(Figure 2.2B), whereas neuron 2 exhibited sparse responses (Figure 2.2C).
The recorded units spanned a broad range of best frequencies, corresponding to the
hearing range of rats. Neurons across the full range of best frequencies exhibited significant
32
33
Figure 2.2 Neurons in primary auditory cortex exhibit reliable responses to the stimulus.
A Stimulus waveform for the baseline stimulus (Q = 2, rmed). B, C Raster plot and firing
rate of responses of a representative unit showing time‐locking responses to the stimulus.
Top panel: raster plot – each black line denotes an action potential produced by the neuron
at a particular delay from stimulus onset (x‐axis) in a particular trial (y‐axis). Bottom panel:
34
Selectivity of neuronal responses for specific stimulus statistics
We next tested whether and how changing the spectro‐temporal statistical structure
of the stimulus affected neuronal response patterns. The responses of the same neuron to
variants of the stimuli included time‐locked excitatory responses, elevated sustained
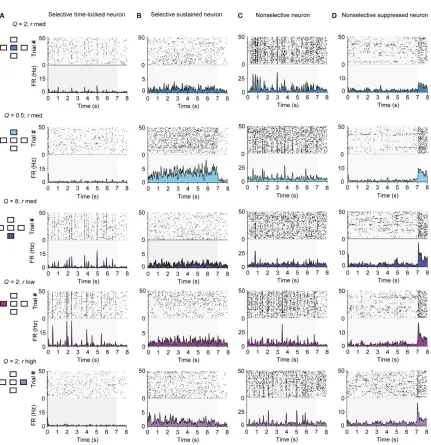
responses or suppressed responses (Figure 2.3).
The majority of recorded units exhibited selectivity for a subset of the stimuli.
Time‐locked responses to a subset of stimuli were more common (Figure 2.3A). Figure 2.3A depicts a neuron that exhibited time‐locked, sparse responses to stimuli of Q = 2, rlow
or rmed, and Q = 8, rate rhigh. The faster fluctuating (Q = 0.5) or more dense (rhigh) stimuli
were less efficient in driving this neuron. Some neurons exhibited sustained responses
(Figure 2.3B). The neuron whose response is depicted in Figure 2.3B exhibited an elevated firing rate, but not precise time locking to the stimulus. It was most responsive for the
stimulus with Q = 0.5, rmed. Some neurons responded significantly to all five stimuli
35
36
Figure 2.3Neurons in primary auditory cortex exhibit diverse responses to the five stimuli used in the study. Responses of four sample units to the five stimuli used in the study. Each
row depicts raster plot and firing rate of responses to one of the five stimuli. Left inset:
diagram depicting which stimulus was used (compare with Figure 2.1A). A Responses of a selective time‐locked neuron. B Responses of a selective sustained neuron. C Responses
37
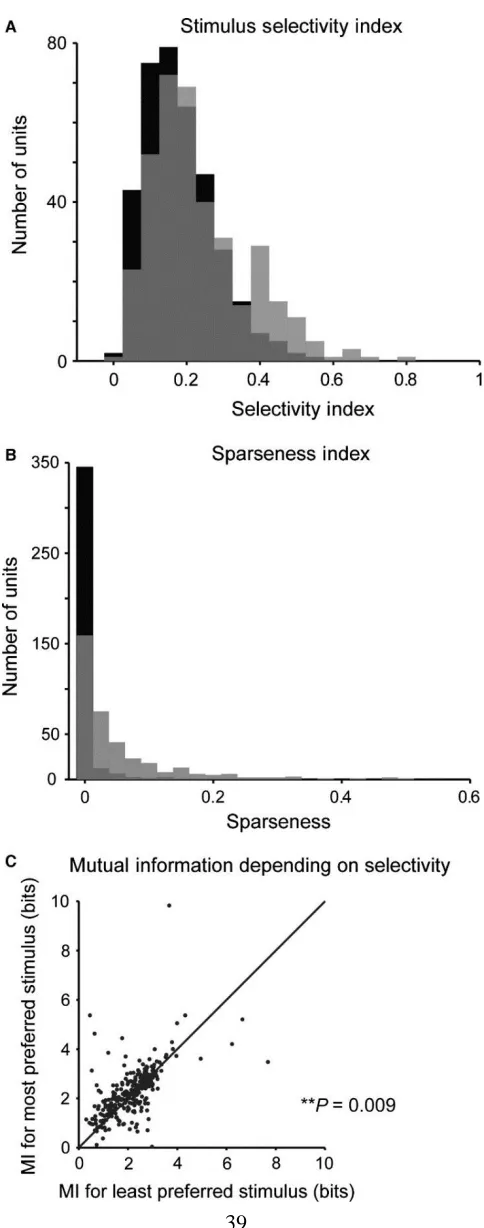
To assay selectivity in neuronal responses to different stimuli, we computed the
selectivity index and the sparseness index. The selectivity index was measured as the
difference between the strongest and the mean response strength to the five stimuli for each
unit, normalized by the strongest response (Figure 2.4A). This measure is 1 if the neuron responds to only one stimulus and 0 if it responds to all stimuli with equal strength. The
sparseness index quantified how specific the neuronal responses were to a particular
stimulus (Figure 2.4B). We found that, typically, neurons were responsive to more than a single stimulus. Still, most neurons exhibited a non‐zero selectivity ratio (mean selectivity
index = 0.24) and sparseness index (mean sparseness index = 0.069). These values were
higher than when responses were randomly shuffled across stimuli (Figure 2.4, selectivity: P = 1.9e‐9; sparseness, P = 4.1e‐57, Wilcoxon sign rank test), such that ~50% of neurons
were above the 5% significance threshold for the shuffled data. These results indicate that
most neurons exhibited higher selectivity for a subset of stimuli than would be expected by
chance.
Did selectivity for a specific stimulus imply that a neuron encoded more
information about its structure? We estimated the information conveyed about the stimulus
by neuronal responses across different stimulus conditions. We applied an information‐
theoretic calculation following a previously developed procedure (Magri et al., 2009;
Kayser et al., 2010) by estimating the information (in bits) in six successive 2‐ms bins
between the neuronal responses and the stimulus over seven 1‐s stimulus ‘chunks’.
38
responded most strongly as compared with those that they responded to least strongly
(Figure 2.4C, n = 304, P = 0.009).
Mutual information may be increased due to an increase in reliability of neuronal
responses (Kayser et al., 2010). Consistently, we found a positive correlation between
mutual information and the inverse of the Fano factor for responses of neurons to both most
and least preferred stimuli (most preferred: correlation coefficient = 0.12, P = 0.04; least
preferred: correlation coefficient = 0.31, P = 2.1e‐8). However, there was no difference in
the Fano factor between responses to the most preferred and the least preferred stimulus
(sign rank test, P > 0.05). Therefore, the increase in mutual information may be attributed
39
40
Figure 2.4 Neurons in primary auditory cortex exhibit selectivity for specific spectro‐ temporal statistics. A Histogram of stimulus selectivity index across the recorded neuronal population (grey) and for randomly shuffled responses (black). Many units exhibit
selective responses to a subset of stimuli. The selectivity index is higher for recorded than
for shuffled responses. B Histogram of the sparseness of responses across the recorded neuronal population (grey) and for randomly shuffled responses (black). Sparseness is
higher for the recorded population than for shuffled responses. C Mutual information between the responses and the stimulus is higher for the stimulus, for which the neuron
41
Droplet onset and spectrogram fits of the linear/non‐linear model to neuronal responses
We next sought to characterize which parameters of neuronal responses change
with the spectro‐temporal statistics of the stimuli. Responses of neurons in the auditory
cortex to an acoustic stimulus have previously been successfully modelled through a
linear/non‐linear (LN) model (Eggermont et al., 1983b; deCharms et al., 1998; Depireux
et al., 2001; Escabí and Read, 2003; Linden et al., 2003; Gourévitch and Eggermont, 2008).
This model is used to predict the firing rate of a neuron in response to a new stimulus by
first convolving the stimulus with a linear filter, and then passing the linear prediction
through an instantaneous non‐linearity (Geffen et al., 2007, 2009). The linear filter can be
thought of as the receptive field of the neuron, and the instantaneous non‐linearity to
represent the transformation from inputs that change membrane voltage to neuronal
spiking.
We fitted the parameters of the linear and non‐linear components of the responses
of each neuron to the stimulus. There was, however, an important problem in comparing
these parameters. Typically, the receptive field of the neuron is computed as the reverse
correlation of the firing rate of the neuron to the spectrogram of the stimulus. In the case
of a white noise stimulus, this operation is equivalent to a spike‐triggered average of the
stimulus. The changing cyclo‐temporal coefficient of the stimulus introduces dependencies
across time within spectro‐temporal channels, resulting in temporal correlations. These
correlations are further exaggerated in the spectrogram‐based representation of the
42
a standard approach is to use decorrelation, in which the linear prediction from the spike‐
triggered average is divided by the auto‐correlation of the stimulus (Theunissen et al., 2001;
Baccus and Meister, 2002). We applied this approach to the spectrogram‐based
representation of the stimulus. However, the time scale of correlations would typically
dominate over the time course of neuronal responses, effectively smoothing them and
therefore precluding the analysis of the receptive field changes across different statistics of
the stimulus.
The construction of the droplet‐based stimulus allowed us to innovatively extend
an existing approach to estimate the linear filter (deCharms et al., 1998). Instead of the
spectrogram‐based representation, the stimulus was represented by the droplet‐onset
matrix. This matrix, by construction, does not contain any correlations, and therefore the
optimal filter can be computed as the spike‐triggered average of the droplet‐onset matrix,
normalized by mean amplitude of each spectral channel. The droplet‐onset matrix does not
contain information about Q, so the matrix is the same for all stimuli at the same rate. Using
this matrix as the stimulus representation allowed us to test the hypothesis that the neurons
respond predominantly to the onsets of the droplets in the stimulus, rather than their
sustained structure. In other words, the information about the sustained ‘ringing’ of
droplets may prove less important to the majority of neurons than the timing of the droplet
onsets. Such a response pattern would allow the neurons to create a sparse representation
of the stimulus, and would be consistent with previous hypotheses on sparse representation
of natural acoustic stimuli in the auditory cortex (Smith and Lewicki, 2006; Hromádka et
43
for representing acoustic stimuli (Lyon, 1982; Meddis et al., 1990). In a cochleagram, the
acoustic waveform is transformed across spectro‐temporally delimited channels using
kernels that scale the bandwidth relative to the center frequency (Smith and Lewicki, 2006;
McDermott et al., 2013).
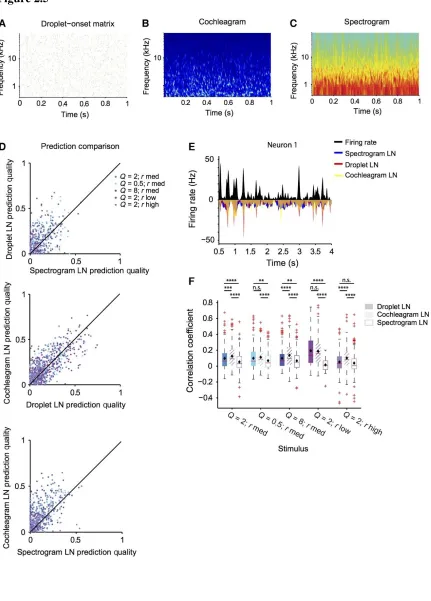
Therefore, we fitted the LN model to the responses of each neuron under three
different representations of the stimulus. The stimulus was represented as either a
spectrogram or a cochleagram, and the filter was computed as the spectro‐temporal
receptive field; or in the droplet onset representation, in which only the information about
the droplet onset time, amplitude and frequency was contained –DTRF (Figure 2.5A–C). We analyzed the performance of the model by fitting it based on responses on a
random subset of 50% of trials, and computing the correlation coefficient between the
prediction for the firing rate and the measured firing rate for the remaining 50% of the trials
(Carruthers et al., 2013; Ahn et al., 2014). We found that the droplet‐based and
cochleagram‐based representation provided more accurate predictions of the neuronal
responses than the spectrogram‐based model (Figure 2.5D–F, n = 232). This relationship held when computed over all stimuli [Droplet: 45%, P (all stimuli) = 2.2e‐15,
Cochleagram: 60%, P (all stimuli) = 5.8e‐43], but also for most individual stimuli [Droplet:
P (Q = 2, rmed) = 2.7e‐6; P (Q = 0.5, rmed) = 0.0031; P (Q = 8, rmed) = 0.0026; P (Q = 2, rlow)
= 2.8e‐8; P (Q = 2, rhigh) > 0.05 ‐ not significant, Cochleagram: P (Q = 2, rmed) = 7.5e‐13;
P (Q = 0.5, rmed) = 1.1e‐6; P (Q = 8, rmed) = 7.6e‐10; P (Q = 2, rlow) = 1.3e‐8; P (Q = 2, rhigh)
= 2.8e‐10], except Q = 2, rhigh. Because this stimulus Q = 2, rlow corresponds to the highest
44
being more similar to the droplet matrix under the fastest stimulus dynamics as compared
to the other stimuli. The predictions based on the cochleagram‐based representations were
more accurate than the droplet‐based representations over all stimuli, but the improvement
was not as great as for droplet‐based prediction over the spectrogram‐based prediction
[35%, P (all stimuli) = 7.7e‐12] and for stimuli 1, 3 and 5 [P (Q = 2, rmed) = 2.9e‐4; P (Q =
0.5, rmed) > 0.05, not significant; P (Q = 8, rmed) = 9.3e‐6; P (Q = 2, rlow) > 0.05, not
significant; P (Q = 2, rhigh) = 1.7e‐8]. In some studies, neurons in the auditory cortex have
been shown to be more sensitive to stimulus onsets, rather than the prolonged ‘ringing’ of
distinct spectral components. This observation may provide an explanation for the
improved performance of the LN model when using droplet‐based representation of the
45
46
Figure 2.5 LN model based on droplet‐onset matrix predicts responses to the stimulus better than spectrogram‐based LN model. A Representation of the acoustic waveform of the droplet stimulus as a droplet‐onset matrix. B Representation of the acoustic waveform of the droplet stimulus as a spectrogram. C Representation of the acoustic waveform of the droplet stimulus as a cochleagram. D Prediction quality based on the droplet, spectrogram, or cochleagram‐based prediction. Prediction quality is significantly higher for droplet and
cochleagram‐based prediction than spectrogram (for droplet: P (all stimuli) = 2.2e‐15; for
cochleagram: P (all stimuli) = 5.8e‐43]. E LN prediction and recorded firing rate (black) for the spectrogram‐based (blue), droplet‐based (red) and cochleagram‐based (yellow)
model for a representative neuron. F Quartile plot for the prediction quality for the droplet, spectrogram and cochleagram based prediction (filled bars: droplet‐temporal receptive
field‐based prediction, open bars: spectro‐temporal receptive field‐based prediction, cross‐
hatched bars: cochleagram‐based prediction). **P < 0.01, ***P < 0.001, ****P < 0.0001,
47
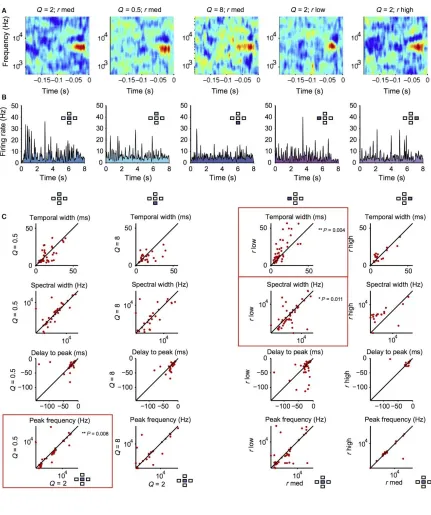
Response parameters of the receptive field of A1 neurons do not exhibit systematic change with changing cyclo‐temporal constant
We next examined whether there were any systematic changes in the time course
and the spectral structure of the receptive field depending on the stimulus (Figure 2.6). We measured the spectral width, temporal delay and temporal length of the positive lobes of
the cyclo‐temporal receptive fields (the linear component of the model computed using the
droplet‐onset matrix as the stimulus) of the recorded units (Woolley et al., 2006; Shechter
and Depireux, 2007; Schneider and Woolley, 2010). Across the neuronal population, there
were only modest changes in a small subset of DTRF parameters (Figure 2.6C): for Q = 0.5, r med stimulus, the peak frequency was slightly reduced (P = 0.008); for Q = 2, r low
stimulus, temporal width of DTRF increased (P = 0.004) whereas spectral width decreased
(P = 0.011) as compared with the baseline Q = 2, rmed stimulus. This difference is attributed
to the temporal delay between droplet onsets in the low‐droplet‐rate stimulus, which allows
for more sustained neuronal responses. This suggests that rather than scaling the receptive
field's temporal response with changing Q and droplet rate, over the population of neurons,
the receptive fields cover the same range of parameters despite the change in the statistical
structure of the stimulus.
We also tested whether over repeated presentations of the same stimulus there was
adaptation in the receptive field parameters over time. We computed DRTFs separately for
both the first and the last 20 trials and the first and last five trials of each stimulus repeat.
We found no significant differences for any parameters for any stimulus over the first and