Use of Neural Networks to Model
M o l e c u l a r
S t r u c t u r e
and
F u n c t i o n
A thesis submitted for the degree of Doctor of Philosophy of the
University of London
Jonathan Darrell Hirst
October 1993
Biomolecular Modelling Laboratory
Imperial Cancer Research Fund
44 Lincoln's Inn Fields
London WC2A 3PX
a n d
The Department of Biochemistry and Molecular Biology
University College London
Gow er Street
ProQuest Number: 10055867
All rights reserved
INFORMATION TO ALL USERS
The quality of this reproduction is dependent upon the quality of the copy submitted.
In the unlikely event that the author did not send a complete manuscript and there are missing pages, these will be noted. Also, if material had to be removed,
a note will indicate the deletion.
uest.
ProQuest 10055867
Published by ProQuest LLC(2016). Copyright of the Dissertation is held by the Author.
All rights reserved.
This work is protected against unauthorized copying under Title 17, United States Code. Microform Edition © ProQuest LLC.
ProQuest LLC
789 East Eisenhower Parkway P.O. Box 1346
A b s t r a c t
This thesis is a study of some ap p lica tio ns of neural
ne tw o rk s - a recen t c o m p u t er alg or ith m - to m od el l in g the
structure and function of biologically important molecules.
In Chapter 1, an introduction to neural networks is given. An o v e r v i e w o f q u a n t i t a t i v e st ru c tu r e a ct iv it y r e l a t i o n s h i p s
(Q SA R s) is presented. The applications of neural ne tworks to
QSAR and to the prediction of structural and functional features
of protein and nucleic acid sequences are reviewed. The neural
network algorithms used are discussed in Chapter 2.
In Chapter 3, a two-layer feed-forward neural network has
been trained to recogn ise an A T P / G T P - bi n di ng local sequence m o ti f . A c o m p a r a b l y s o p h i s t i c a t e d s t a t i s t i c a l m e t h o d was
de vel ope d, which pe rfo rm ed marg inal ly better than the neural
n e t w o r k .
In a second study, described in Chapters 4 and 5, one of the
largest data sets available for developing a quantitative structure activity relationship - the inhibition of dihydrofolate reductase by
2 , 4 - d i a m i n o - 6 , 6 - d i m e t h y l - 5 - p h e n y l d i h y d r o t r i a z i n e d e r i v a t i v e s -
has been used to be nchmark several co mp utational methods. A
hidden-layer neural network, a decision tree and inductive logic
p r o g r a m m i n g have been c o m p a r e d with the m or e estab lish ed
m et ho d s of linear regression and n ear est neigh bou r. The data
parameters and by a new set of descriptors designed to allow the formulation of rules relating the activity of the inhibitors to their
chem ical structure.
The p e rf o r m a n c e of neural ne tw o rk s has been assessed r i g o u r o u s l y in two dist inct areas of b i o m o l e c u l a r modelling:
seq uen ce analysis and drug design. The c o n c l u s i o n s of these
C o n t e n t s
Title page
A b s t r a c t
C o n t e n t s
List of Figures
List of Tables
List of Abbreviations
A c k n o w l e d g e m e n t s
1
2
4
10
1 4
1 7
1 9
C h a p t e r 1
I n t r o d u c t i o n
1.1 S y n o p s i s 2 1
1.2 I n t r o d u c t i o n 2 2
1.3 M e t h o d o l o g y 2 3
1.3.1 Introduction to neural ne tworks 2 3
1.3.2 Lea rni ng algori thms 2 9
1.3.2.1 The perceptron algorithm 2 9
1.3.2.2 The backpropagation of errors
a l g o r i t h m 3 2
1.3.2.3 The Kohonen net 3 6
1.4 An overview of QSAR 3 6
1.4.1 The aim of QSAR 3 6
1.4 .2 The H a m m e tt equation 3 7
1.4.3 The Hansch approach 3 8
1.4.5 Principal component analysis 3 9
1.4.6 Three-dimensional QSAR 4 0
1.4.6.1 Minimal Steric Difference (MSD) 4 0
1.4.6.2 Molecular Shape Analysis (MSA) 41
1.4.6.3 Distance ge ometry 4 2
1.4.6.4 Comparative Molecular Field
Analysis (CoMFA) 4 3
1.4.6.5 Mole cul ar similarity 4 4
1.4.7 N o n - p a r a m e t r i c t e c h n i q u e s 4 4
1.4.7.1 Pattern r ec og n iti o n 4 4
1.4.7.2 Artificial intelligence meth ods 4 6
1.4.8 Neural network applications 4 7
1.4.9 Quantum theoretical methods 4 8
1 .4 . 1 0 S t r u c tu r e - b a s e d st ra te g ie s 4 9
1.5 Se quence analysis 5 0
1.5.1 Nucleic acid sequence analysis by
neural n e tw o rk s 5 0
1.5.1.1 Translational initiation sites
in £. coli 5 0
1.5.1.2 Splice junctions 5 2
1.5.1.3 Promoter sites in E. coli 5 6
1.5. 2 Protein sequence analysis by
neural n e tw o r k s 5 8
1.5.2.1 Protein secondary structure
p r e d i c t i o n 5 8
1.5.2.2 Specific protein secondary
struc tur e p r e d i c t i o n 6 2
1.5.2.3 Tertiary protein structure
1.5.2.4 Prediction of structural class/fold 6 6
1.5.2.5 Other protein structure
a p p l i c a t i o n s 6 6
1.6 I m p le m e n t at i on and evaluation 6 8
1.6.1 Sequence encoding 6 8
1.6.2 The number of input units 6 9
1.6.3 Hidden units 7 0
1.6.4 I n t e r p r e t i n g re s ul ts 7 2
1.6.5 Multiple min im a 7 3
1.6.6 Data pr esentation 7 4
1.6.7 M e m o r i s a t i o n 7 5
1.6.8 Testing protocols 7 5
1.7 Scope of thesis 7 6
C h a p t e r 2
Theory of neural networks
2.1 S y n o p s i s 7 8
2 . 2 The elementary perceptron algori thm 7 9
2. 3 The backpropagation of errors algorithm 8 2
2.3.1 Conside rations for i mp le me nta tio n 8 6
2 . 4 An expository problem 8 7
2.5 The Gear algorithm 91
2.5.1 Fixed step steepest gradient descent 91
2 . 5 . 2 Stiff coupled ordinary differential equations 9 4
2.5 .3 Outline of the Gear algorithm 9 5
C h a p t e r 3
Prediction of an ATP/GTP-binding motif: a comparison of a
perceptron type neural network and a consensus sequence
m e t h o d
3.1 S y n o p s i s
3 .2 I n t r o d u c t i o n
3. 3 M e t h o d
3 .4 R e s u l t s
3.5 Conclusion
100
101 1 0 4
1 1 5 1 2 4
C h a p t e r 4
Qua ntitativ e structure-activity relationships: neural networks and inductive logic programming compared to statistical
methods. The inhibition of dihydrofolate reductase by
p y r i m i d i n e s
4.1 S y n o p s i s 1 3 0
4 .2 I n t r o d u c t i o n 13 1
4.3 M e t h o d s 131
4.3.1 Da ta 13 1
4 . 3 . 2 Ha n sc h p a ra m e t e r s 1 3 7
4. 3 .3 Physicochemical attributes (PCAs) 1 4 0
4 . 3 . 4 Line ar regre ss ion 1 4 3
4 .3 .5 N e ar e st n e ig h b o u r 1 4 9
4 . 3 .6 Neural netw orks 1 5 0
4 .3 . 7 Inductive logic p ro gr am m in g 1 5 3
4 . 4 R e s u l t s 4.4.1
4 . 4 . 2
4.4 .3 4 . 4 . 4
4. 4 .5
4 .5 Di scussion
Linear regr es sio n
Ne are st n e i g h b o u r
Neural n e tw o rk s
Inductive logic pr o g ra m m in g
Decision tree
1 5 7
1 5 8
1 6 3
1 6 3 1 6 4
1 7 2
1 7 2
C h a p t e r 5
Qua ntitativ e structur e- act iv ity relati ons hi ps: neural netw orks
and inductive logic progr amming compared to statistical
methods. The inhibition of dihydrofolate reductase by triazines
5.1 S y n o p s i s 1 8 0
5 .2 I n t r o d u c t i o n 181
5.3 M e t h o d s 1 8 3
5.3.1 Data 1 8 3
5 .3 .2 Ha nsc h p a r a m e t e r s 1 9 2
5.3 .3 Physicochemical attributes (PCAs) 1 9 4
5 . 3 . 4 Line ar r eg re ss ion 1 9 5
5.3 .5 N e ar e st n e ig h b o u r 1 9 6
5 .3 .6 Neural ne tw o rk s 1 9 6
5 .3 . 7 Inductive logic pr o g r am m in g 1 9 7
5 .3 . 8 Decision tree 2 0 0
5 .4 R e s u l t s 2 0 1
5.4.1 Linear reg re ss io n 2 0 1
5 . 4 . 2 Ne are st n e ig h b o u r 2 0 5
5 . 4 . 4 Inductive logic p ro g ram m in g 2 0 9
5 .4 . 5 Decision tree 2 1 6
5 .5 Di scu ss ion 2 1 6
C h a p t e r 6
Conc lusio ns
2 2 4
A p p e n d i x 1
Publications connected with this thesis
2 2 7
A p p e n d i x 2
FORTRAN code for a
general backp ro pag at ion neural ne two rk
2 2 9
List of Figures
C h a p t e r 1
Figure 1.1 A simplified model of a biological neuron 2 6
Figure 1.2 The logistic function, f { x ) = -— ~ ~ 2 7
1 + e " ^
Figure 1.3 A schematic diagram of a two-layer
p e r c e p t r o n 3 0
Figure 1.4 The decision boundary formed by a two-layer
perceptron separating two classes 3 1
Figure 1.5 A graphical representation of the
exclusive OR problem 3 3
Figure 1.6 The ele mentary backp ro pag at ion topology 3 4
Figure 1.7 A schematic representation of a Kohonen
self organizing feature map 3 5
C h a p t e r 2
Figure 2.1 An ele m e nt ar y p e rc ept ro n 8 0
Figure 2.3 A neural network solution to a drug
design p r ob lem 9 0
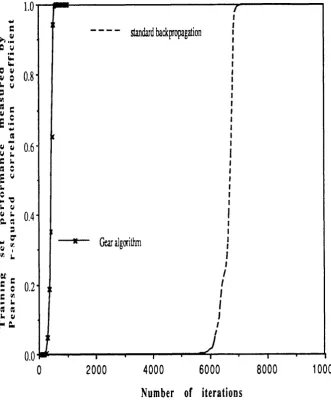
Figure 2.4 Example of speed up in training using
the Gear algorithm 9 8
C h a p t e r 3
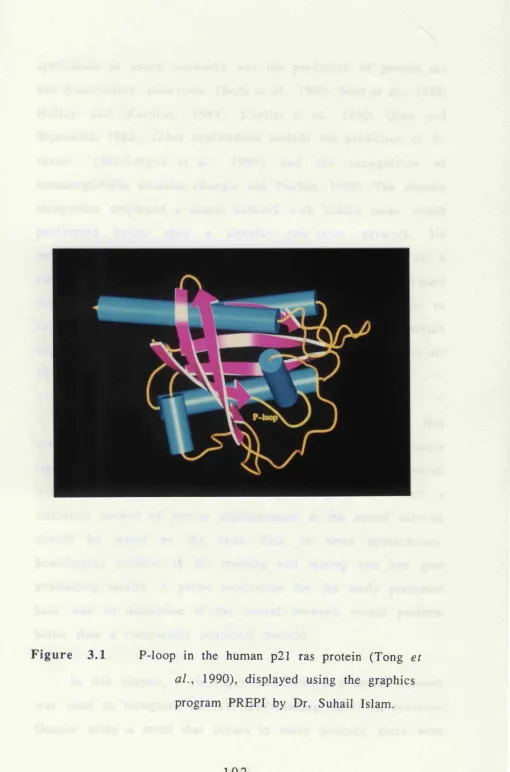
Figure 3.1 P-loop in the human p21 ras protein 1 0 2
Figure 3.2 Performance of neural network and
statistical p ro gr am 1 1 7
Figure 3.3 Num be r of ATP/GTP-binding proteins
incorrectly predicted as non -binding 1 1 9
Figure 3.4 Nu m b e r of no n- bi ndi ng -A TP /G TP proteins
incorrectly predicted as binding 1 2 0
Figure 3.5 Comparison of the neural network weights
and the residue frequency 1 2 2
Figure 3.6 Comparison of neural network weights and
the residue frequency difference 1 2 3
C h a p t e r 4
Figure 4.1 Model of trimethoprim bound to DHFR 1 3 2
Figure 4.2 Schematic representation of the neural network
trained using the PCA representation 1 5 4
Figure 4.3 Analysis of the weights of neural network with
no hidden units trained on the PCA
r e p r e s e n t a t i o n 1 6 5
Figure 4.4 Outlier analysis of the cross-validation trial 17 5
Figure 4.5 Outlier analysis of the independent test set 17 6
Figure 4.6 Cartoon of the interaction of trimethoprim
with DHFR 1 7 7
C h a p t e r 5
Figure 5.1 Model of a triazine bound to DHFR 1 8 2
Figure 5.2 Schematic representation of the neural network
trained using the PCA representation 19 8
Figure 5.3 The mean and standard deviation (error-bars)
of the neural network weights giving
the optimal test set performances
for the six cross-validation trials 2 1 0
Figure 5.4 Venn diagram of favoured properties for the
Figure 5.5 Subsection of the binary tree generated on
cross-validation run 2 2 1 7
Figure 5.6 Outlier analysis 2 1 9
List of Tables
C h a p t e r 1
Table 1.1 Neural network applications to analyses of
nucleic acid sequences 5 1
Table 1.2 A comparison of methods predicting exon/
intron boundaries in human DNA 5 5
Table 1.3 Application of neural networks to protein
sequence analysis 5 9
C h a p t e r 2
Table 2.1 A simple drug design problem 8 8
C h a p t e r 3
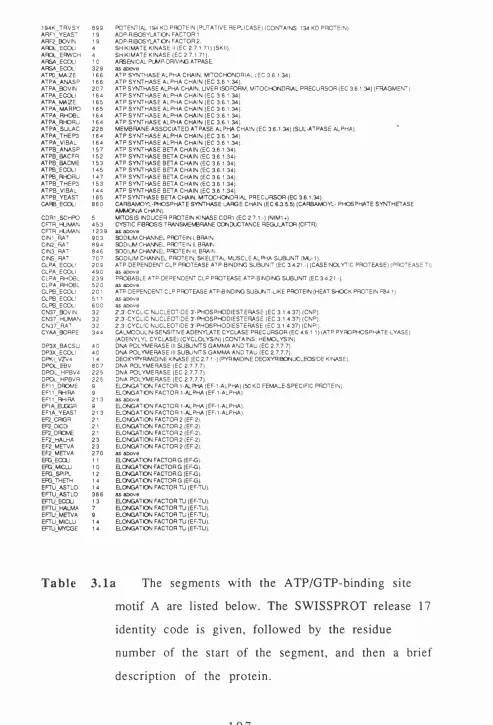
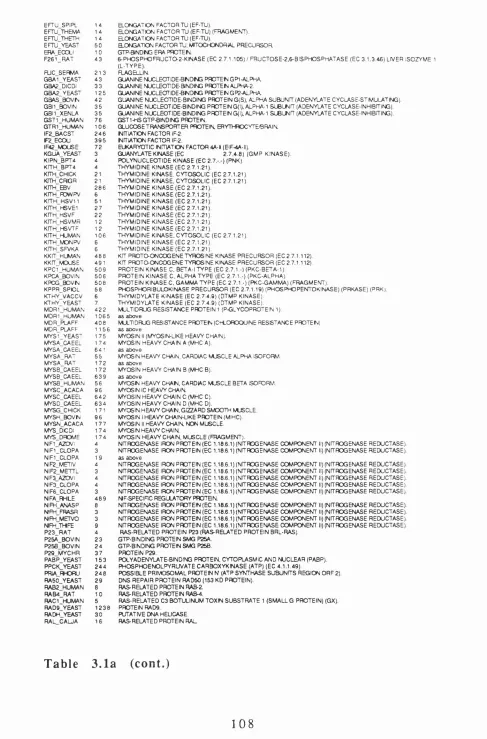
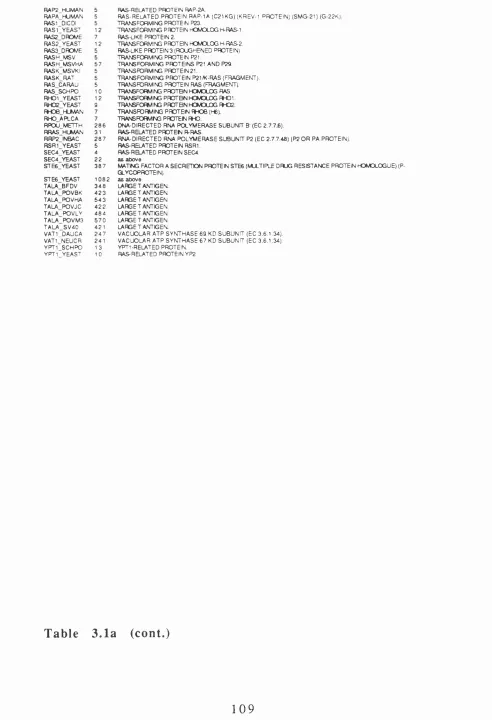
Table 3.1 The names and SWISSPROT codes of the
proteins used in the ATP/GTP-binding
m ot if study 1 0 7
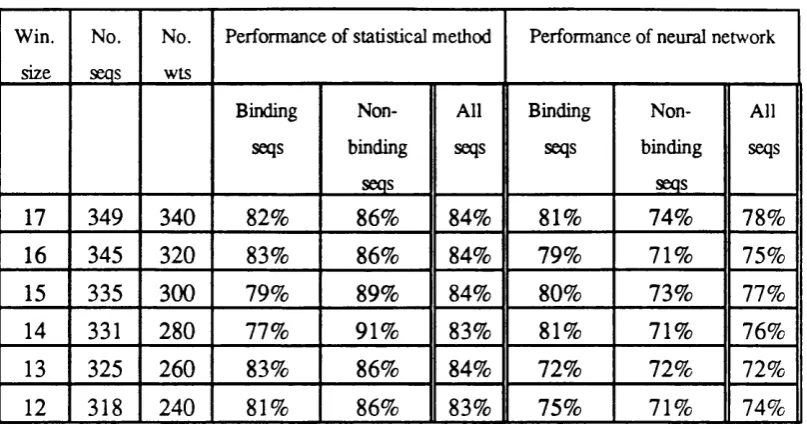
Table 3.2 The variation of the performance of the
statistical method and the neural
network with the window size 1 1 2
the statistical prog ram 1 1 6
Table 3.4 Weight matrix generated by averaging 100
networks trained on all 349 examples 121
C h a p t e r 4
Table 4.1 Pyrimidines used in this study 1 3 4
Table 4.2 Training and testing sets 1 3 9
Table 4.3. Hansch parameters of the substituents 141
Table 4.4 Physicochemical attributes (PCAs) of
f r a g m e n t s 1 4 4
Table 4.5 Cross-validation training set pe rformances as
measured by the Spearman rank
correlation coefficients. 1 5 9
Table 4.6 Cross-validation test set p erform ances as
measured by the Spearman rank
correlation coefficients. 1 6 0
Table 4.7 The mean Spearman rank correlation
coefficients on the independent test set of
19 drugs 1 61
Table 4.8 An example of a GOLEM rule 1 6 6
Table 4.9 Consensus rules 1 6 7
C h a p t e r 5
Table 5.1 Triazines used in this study 1 8 4
Table 5.2 Splits of the data used for comparative study 1 9 3
Table 5.3 Summary of all methods - Spearman rank
correlation coefficients on the training
s e t s 2 0 2
Table 5.4 Summary of all methods - Spearman rank
correlation coefficients on the testing
s e t s 2 0 3
Table 5.5 Classification of combinations of Hansch
parameters predicted by the neural
network to be highly active 2 0 8
List
o f A b b r e v i a t i o n s
 1 Angstrom = 0.1 nanometers
A T P a d e n o s i n e t r ip h o s p h a t e
CASE c o m p u t e r autom oated structure ev alu ati o n
CoMFA comparative molecular field analysis
DHFR d i h y d r o f o l a t e re d u c t a s e
DNA deox yri bo nuc lei c acid
E. coli Escherichia coli
FORTRAN formula translation language
f p false positives
OCR G a m ie r Osguthorp Robson
OTP g u a n o s i n e t r ip h o s p h a t e
I g i m m u n o g l o b u l i n
I L P inductive logic pr ogramm ing
LR linear regression
m RNA messe ng er ribonucleic acid
MSA mo lecular shape analysis
MSD minimal steric difference
MTD minimal topological difference
NMR nuc lea r magnetic resonan ce
PCA p h y s i c o c h e m i c a l a ttr ibu te
QSAR q u a n ti t a t iv e str u c tu r e - a c ti v i ty r e l a t i o n s h i p
RNA ribonucleic acid
r m s root mean square
snRNA small nuclear ribonucleic acid
Single letter code for DNA bases
A a d e n o s i n e
C c y t o s i n e
G g u a n i n e
T t h y m i n e
Single letter codes for amino acids
A a l a n i n e
C c y s t e i n e
D asparatic acid
E glutamic acid
F p h e n y l a n i l i n e
G g l y c i n e
H h i s t i d i n e
I i s o l e u c i n e
K l y s i n e
L l e u c i n e
M m e t h i o n i n e
N a s p a r a g i n e
P p r o l i n e
Q g l u t a m i n e
R a r g i n i n e
S s e r i n e
T t h r e o n i n e
V v a l i n e
W t r y p t o p h a n
A c k n o w l e d g e m e n t s
I thank my supervisor, Mike Sternberg, for his invaluable
support and interest in my work, and for providing an excellent
environment in which to work.
I thank the other members of the Bi omolecular Modelling
Laboratory: Alexei Adzhubei, Paul Bates, Paul Harrison, Suhail
Islam, Richard Jackson, Ross King, Richard Lewis, Stephen Pickett,
M a n s o o r Saqi, Paul Snape, Peter Wal ls for their advice and friendship. The machine learning studies used as a comparison in
Chapters 4 and 5 were done by Dr. Ross King.
I am grateful to the Imperial Cancer Research Fund for a
gen ero u s th re e -y ea r studentship.
I th an k my s u p e r v i s o r at U n i v e r s i t y C o l l e g e , J a n e t
Thornton, for her support and interest.
My parents and my wife, Pilar, have been full of support
and love over the years.
C h a p t e r
1
1.1 S y n o p s i s
In this thesis, empirical modelling by neural networks is
investigated, with particular reference to qu antitative structure-
activity relationships (QSARs), where the drug activity is related
to chemical structure, and biomolecular sequence analysis, where
structure and function are related to pr imary sequence. These
two areas are reviewed in this chapter, with a general overview
of QSAR and a more specific discussion of sequence analysis
based on neural network applications. The concepts underlying
neural networks are introduced.
1. 2 I n t r o d u c t i o n
A f u n d a m e n ta l o b j e c ti v e of scient ifi c r e s e a r c h is the
r e c o g n i t i o n of u n i f y i n g r e l a t i o n s h i p s a m o n g d a ta . Such
r e l a ti o n s h i p s may be d e v e l o p e d fro m t h e o r i e s of m o le c u l a r
behaviour, such as the ideal gas law or the Schrodinger equation.
H o w e v e r , the c o m p l e x i t y of b i o c h e m i c a l p r o c e s s e s often
pr ec lu de s theor eti cal calcul ati on and also d i r ec t ex pe ri m e nt al
measurement. Empirical models are thus especially important in
the biological sciences.
This thesis will co n si de r two areas of active res ear ch,
where empirical modelling is of particular interest: the study of q u a n ti t a t iv e s t r u c tu re -a c ti v i ty r e l a t i o n s h i p s ( Q S A R s ) and the analysis of biomolecular sequences. In QSAR, the activity of a
drug is pr e d i c te d fro m its c he m ic a l s tr uc tu re , thr o ug h the
analysis of drugs with similar m od es of action and kn ow n
activity. In sequence analysis, structure or function is predicted
from the primary sequences of proteins or nucleic acids, through
the analysis of sequences with known structure or function. The
aim of this thesis is to investigate the use of neural networks for
m od el lin g m o le cu la r structure and function; se qu en c e analysis
and QS AR studies serve as illustrative and pertinent examples.
The m aj or part of the thesis focuses on Q S A R , so after an
i n t r o d u c t i o n to the n e u ra l n e t w o r k m e t h o d o l o g y , a sh o rt
overview of QSAR is presented. Biomolecular sequence analysis is
then d i s c u s s e d with s p e c i f i c r e f e r e n c e to n e u r a l n e t w o r k
1. 3 M e t h o d o l o g y
1.3.1 Introduction to neural networks
A neural network is, basically, a c om pu ter pr og ram that
can detect patterns and correlations in data. Fun damental to the
approa ch is the c o nce pt of parallel p r oc e ss in g - m an y units
p e r f o r m i n g s i m p le t as ks in u n i s o n . T h e s u c c e s s of this methodology in the recognition and classification of patterns, and
the c o n t r a s t o f t h e s e p a r a l l e l l e a r n i n g a l g o r i t h m s w it h
c o n v en t io n a l serial c om p u t i n g has att racted the attention of,
amongst others, scientists interested in biomolecular modelling.
O ri gi nal ly re se ar ch into neural n e tw o rk s was p r i m a r il y motivated by a desire to model the working of the brain. The
h u m a n brain c o n si st s of a p p r o x i m a t e l y 10^"^ n e u r o n s a n d , compared to a conventional computer, each neuron p erforms a
simple task at a slow speed. The power of the brain is presumed
to come from the vast number of neurons and the high degree of
connectivity - 10^ connections (synapses) per neuron (see Hubei,
19 7 9, a n d r e f e r e n c e s t h e r e i n , f o r an i n t r o d u c t i o n to
n e u r o b i o l o g y ) . T h e br ai n has t h u s b e e n m o d e l l e d u s i n g
aggregates of simple units connected to each other. The models
are limited because the numbers of neurons and connections in a
neural network are orders of magnitude less than in the human
brain. The models of the neurons and the synapses themselves
are no t p r e c i s e , and the l e a r n in g p r o c e d u r e is not well
u nd e rs to od . De spi te these sh o r t c o m i n g s, no t only are neural
networks still being used to investigate learning procedures, but
the algor ith ms t hem sel ve s are being e x p lo it ed in areas that
conventional computing has not been entirely successful.
C u rr en t m a t h e m a ti c a l m o d e l s ste m fr om the work of
M c C u l lo c h and Pitts (19 43 ), H e b b (19 49) , W i d r o w (1960),
Rosen blat t (1962), and others. Interest in neural networks was
curtailed when Minsky and Papert (1969) highlighted a major
limitation of the approach, p r ov in g that only pr o b l em s with
linearly separable solution spaces could be solved by the neural
n e t w o r k a l g o r i t h m s o f the tim e . It wa s n o t until the implementation of a new algorithm, called the backpropagation
of errors ( R um el ha r t et al., 1986a), that this lim itation was widely seen to have been overcome. Although backpropagation is not a plausible model of learning in brains (Rum elha rt et al.,
1986a; Crick, 1989), the prospect of tackling previously unsolved computational problems using the po we r of backpropagation and
other work in the field, inclu di ng that of K o h o n e n (1984),
Grossberg (1986), and Hopfield (1982, 1984, 1986), rekindled the
excitement about neural networks. Schillen (1991) lists many of
the current areas of application, inclu di ng speech rec ogn iti on
(Sejnowski and Rosenberg, 1987; Clarke et al., 1991) and vision (Lehky and Sejnowski, 1988), and an extensive list of references
can be found in a book by Simpson (1990).
N eu ral n et w o rk s hav e several po te n ti al ad v an t ag e s that
h a v e e n c o u r a g e d t h e i r a p p l i c a t i o n in m a n y f i e l d s. T h e y
i ncorporate both positive and negative information - both data
with the feature of interest and without that feature are used to
higher-order correlations in patterns, i.e., they are non-linear. A p r e c o n c e i v e d m od el is not r e q u i r e d - the neu ral n e tw o rk automatically determines which input variables are important.
A neural network consists of a number of simple, connected
computational units that operate in parallel and can be trained to
map a set of input patterns on to a set of output patterns. This
co mp ut ati ona l pa rad ig m is based on a simplified m odel of a
biological neuron. A modelled neuron (or unit) has the basic functionality of a biological neuron: it takes signals from other
units, if the sum of these signals is greater than a threshold, it
produces a signal, which is passed on to other units (Figure 1.1).
Each unit operates independently, but the units are connected to
one another with a weight, which is a real number, and these weights de te rm in e the beh avi our of the neural network. Each
unit transmits a signal to its neighbours through the connections.
The value of the output signal depends upon the activation (or
state) of the unit, which is a real nu m be r associated with the unit. This dependence is expressed in an output transfer function,
most commonly, a sigmoid function, such as the logistic function
(Figure 1.2). The activation of a unit is a function of the outputs
of the units to which it is connected. There are three types of
unit: input units which receive signals from external sources and
send signals to other units; output units which receive signals
from ot her units and send signals to the e n v ir o n m e n t ; and
hidden units which have no direct contact with the environment
and, hence, they receive inputs from other units and send their
output signals to other units.
Input to other neurons
Inputs to neuron i
F i g u r e 1.1 A simplified model of a biological neuron.
The activation of an input neuron is represented by
Irii, the weights connecting units i and j are denoted
f ( x )
0
F i g u r e 1.2 The logistic function, f { x ) =
The architecture (or topology) of a network is formed by o rg a n i s in g the units into layers. T here can be c o n n e c ti o n s
between units in the same layer, and connections between units
in different layers. Inter-layer connections can allow propagation
of signal in one direction (feed-forward) or in either direction
(feedback). The neural network learns by altering the values of
the weights in a well defined manner, described by a learning
rule. T h e re are tw o ge ne ra l ty pe s of le a r n in g . Su p e r v i se d
l e a r n i n g i n c o r p o r a t e s an e x t e r n a l t e a c h e r and r e q u i r e s a knowledge of the desired responses to input signals. The aim is to
m inim is e the error between the desired and co mp u ted output
unit values. In statistics, regression and discrimination are of this type. U ns u p e r v i se d learning uses no external t eac h er and is
b as ed upon local i n f o r m a t i o n only. It s e l f - o r g a n i s e s da ta presen ted to the ne tw or k and dete cts the e m e r g e n t collec tive p r o p e r t i e s ( K o h o n e n , 1984; H o p f i e l d , 1982). The a n a l o g o u s
paradigms in statistics are clustering and classification.
In this thesis, it has only been possible to study a small
n u m b e r of the d i v er s e r a n g e o f ne ura l n e tw o rk s . All the
applications have used supervised learning, and none of them have e mp lo yed feed-back architectures. Even within this subset
of neural networks, a number of decisions still have to be made.
These include the choice of learning algorithm, the architecture of
the neural network, the number of input units, the possible use
of hidden layers, and the method of encoding data. Some of the
more co mplicated neural networks can find arbitrarily complex
mappings between input patterns and output classifications, but
choices are not automatic. In the following sections, these choices are considered in more detail.
1.3.2 Lea rn ing algorithms
1.3.2.1 The perception algorithm
A neural ne twork with no hidden layers can be trained
using the perceptron algorithm (Rosenblatt, 1957). For simplicity
consider a two-layer perceptron, i.e., one with no hidden units, that decides whether an input belongs to just one of two classes,
denoted A and B (Figure 1.3). The single output unit computes a weighted sum of the input units, subtracts a threshold, 6, and converts the result to -t-1 or -1, using an output transfer function.
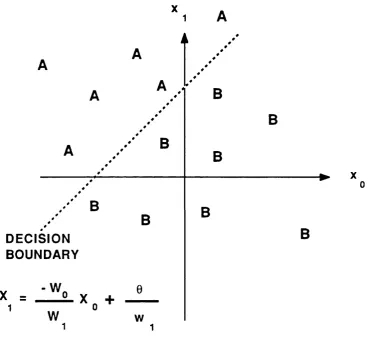
The decision rule is to respond class A if the output is 4-1 and
class B if the output is -1. The behaviour of such networks can be analysed using a plot of the decision regions created in the multi
d i m e ns io na l space spanned by the inp ut varia bles (Lipp man ,
1987). These decision regions specify which input values result
in a class A and which result in a class B resp onse . The
p e r c e p t r o n f o r m s tw o d e c i s i o n r e g i o n s s e p a r a t e d by a
hyperplane (Figure 1.4), and the equation of the boundary line
de p en d s on the c o n n e c ti o n we ig ht s and the t h re s h ol d . The
perceptron algorithm is given in Cha pter 2. Ro senblatt (1962)
p r o v e d for t w o - l a y e r n e u r a l n e t w o r k s t h a t i f t he i npu ts
presented from the two classes are separable (that is they fall on
opposite sides of a hyperplane), then the pe rceptron algorithm converges and positions the decision hyperplane between those
X
0
#
e
e
OUTPUT
X
IN P U T
F i g u r e 1.3 A schematic diagram of a two-layer
perceptron, with N input units, denoted by x , N
weights denoted by w, and one output unit, denoted
i1
A
A
A
A
B
B
A
B
B
*
B
B
B
B
DECISION BOUNDARY
X = - W o X
e
^ W
1
0 ^
w 1
F i g u r e 1.4 The decision boundary formed by a
perceptron separating two classes, A and B, by two input co-ordinates, Xq and x^. The equation of the line
is given as a function of the weights wq and Wj, and
the threshold, 6.
two classes. Rosenblatt was unable to extend this to architectures
with three or more layers. T w o - la ye r neural networks are not appropriate when classes cannot be separated by a hyperplane,
as in the exclusive OR problem (Figure 1.5). For these non-
linearly separable problems mu lti-layer networks trained with a
more involved algorithm are required.
1.3.2.2 The backpropagation of errors algorithm
The backpropagation of errors (Rumelhart et a l , 1986a) is such an algorithm. It performs the input to output mapping by
adjusting weight connections according to the difference between the computed and desired output unit values. A cost function is
m i n i m i s e d , t y p i c a l l y the s q u a r e d d i f f e r e n c e b e t w e e n the
computed output values and the desired output values, across all
the patterns in the data set. The weight adjustments are derived from the change in the cost function with respect to the change in
each weight. The backpropagation algorithm is powerful, because this derivation is extended to find the equation for adapting the
connections between the input and hidden layers of a multi-layer
ne tw o rk , as well as the p e n u l t i m a t e l ay e r to o u tp u t laye r
adjustments. The extension to the hidden laye r ad justments is
based on the r eal isa ti on that the e rr o r o f each unit in the
pe nultimate-layer is a proportionally weighted sum of the errors
produced at the output layer. The basic algorithm for the three-
l a y e r e l e m e n t a r y b a c k p r o p a g a t i o n t o p o l o g y ( F i g u r e 1.6) is
out lined in C h a pt e r 2, along with som e c o n s i d e r a ti o n s with
F i g u r e 1.5 A graphical representation of the exclusive OR
problem - if the two inputs are (0,0) or (1,1), the
output is 0, and if the two inputs are (0,1) or (1,0),
the output is 1. The decision region required to
separate the two classes is schematically shown, and
it cannot be a single line.
W e i g h i s c o n n e c t i n g h i d d e n l a y e r to out put l a y e r
W e i g h t s c o n n e c t i n g i np ut l a y e r
t o h i d d e n 1 a y e r
OUTPUT LAYER
INPUT LAYER
F i g u r e 1.7 A schematic representation of a Kohonen self
organising feature map. The output layer is a two-
dimensional array of units. For clarity, not all the
connections between output units are shown, and
only input connections to the first row of output
units are shown.
1 .3 .2. 3 The Kohonen net
The other general type of learning, unsupervised, is used in
the Kohonen self organising feature map (Kohonen, 1984). The
o u t p u t units are a rr a ng ed in a two d i m e n s i o n a l grid and
extensively interconnected (Figure 1.7). Every output unit is also
connected to every input unit. Continu ous -valued input patterns
are presented sequentially in time without specifying the desired
o u tp u t. A f t e r e n o u g h i n p u t p a t t e r n s h a v e been p re s e n t e d ,
weights will specify cluster or vector centres that sample the
input space such that the point density function of the vector
centres tends to approximate the probability density function of the input vectors (Kohonen, 1984). In addition, the weights will
be organised such that topologically close units are sensitive to inputs that are physically similar. Despite the importance of the
Kohonen network, it has not been studied in this thesis and will
not be discussed here in detail.
1.4 An o v e r v i e w o f Q S A R
1.4.1 The aim of QSAR
The drug design problem that QSAR studies ultimately seek
to answer is "How does one increase the activity of a drug, by
systematic modif ica tio n o f its ch emical structure?". A QSAR,
t he re fo re, a tte m pt s to de sc r i b e the activ it y wit hin a set of
c o m p o u n d s by a m a t h e m a ti c a l f o r m a l is m which i n co r p o r a te s
synthesis and characterisation of a number of related molecules
(congeners), which have the same basic structures but differ, for
instance, in the substituents on aromatic rings. Al though the
classical QSAR approaches were introduced empirically, they can
be derived in terms of an extra the rmo dy na mic ap proximation -
a d d iv it y of su b s ti t u e n t effe cts and se p a r a b i l i t y of d if f er en t
effects (Fujita, 1990).
1.4.2 The H am me tt equation
Characterisation of substituent effects and the use of this
information to analyse chemical reactions dates back to Hammett
(Hammett, 1940). Hammett correlated the rate of hydrolysis of
m ^ r <3- s u b s t i t u t e d and p a r a - s u b s t i t u t e d b e n z o a t e s with <7,
calculated from the dissociation constants of the co rre sponding
benzoic acids:
log(/^x/^H) = pcrx, [eqn. 1.1]
where is the rate constant for the unsubstituted molecule, K x
is the rate constant for the derivative. <Jx refers to the electronic
effect of the substituent relative to hydrogen and is a parameter
applicable to many different types of reaction - characterised by different values of p - whose relative rates depend on the degree
of electron release or withdrawal by that substituent. Taft (Taft, 1952; Taft, 1953) added a steric parameter, E s , to the Hammett equation, to obtain a relationship that could be applied to o r t h o
-substituents as well.
1.4.3 The Hansch Approach
In 1962, Hansch et al. correlated the biological activity of p h e n o x y a c e t ic acids with H a m m e tt su b s ti t u e n t c o n st a n t s and
p ar t i ti o n c oe f f ic ie n ts . The use of pa rt i ti o n c o e f fi c i e n t s has
developed (Hansch and Fujita, 1964; Hansch, 1969; Leo et al.,
1971; Hansch and Leo, 1979; Hansch, 1981; Blaney et al., 1984) to become probably the most po pular method of QSAR. In most
applications, the Hansch equation has the form:
lo g( l/C ) = Z C0j+ C i j a + C2j n + + C4jEs , [eqn. 1.2]
w h e r e C is the drug c o n c e n tr a ti o n for a ch osen standard
biological effect; are regression coefficients to be determined
by iterative curve fitting by a least squares procedure, k is the
substituent hy drophicity constant, c is the Hammett substituent constant and E s is the Taft steric parameter; the summation over
j indicates that there are terms for each substituent. The Hansch approach is, thus, based on the formation of an empirical model
of drug action that uses parameters related to linear free energy
as the independent variables. The basic assumption is that the
variations in biological activity arising from the modifications of
molecular structures within a congeneric series can be correlated
with the r e s u l ti n g c h a n g e s in p h y s i c o c h e m i c a l p r o p e r t i e s -
c o mp ri sin g hydrophobic, electronic and steric compo ne nts. The
Hansch approach is discussed further in Chapter 4, where it is
1.4.4 Fre e-Wilson Analysis
The F re e- W ils on method (Free and W il so n , 1964) also
assumes that biological activity is d ep en d e n t on the additive
properties of the substituents on a parent molecular structure. In
the Fujita-Ban modification of this method (Fujita and Ban, 1971):
l o g ( l / C ) = X a iX i + iiQ, [eqn. 1.3]
where C is as previously defined, a, is the group contribution of
the substituent to the activity of the substituted molecule, X; is unity if substituent i is present and zero otherwise, and jiq = 1/C for the parent compound. A least squares proced ure is used to d e t e r m i n e at and fio\ no p h y s i c o c h e m i c a l p a r a m e t e r s are e m p l o y e d . I n d i c a t o r v a ri a b l e s are u se d in m u l t i p l e linea r regr es si on analysis to model specific fea tures that c ann ot be
described by continuous variables. They take the value of one or
zero, depending on the presence or absence of the feature. Free- W ils on an alysis can be co n si d er e d as a r e g r e s s io n analysis
approach using only indicator variables (Kubinyi, 1990).
1.4.5 Principal co mp on en t analysis
Principal c o m po ne n t analysis is a tec hn iq u e for reducing
the effective dimensionality of a dataset, and can be of use in
QSAR for variable selection (Martin, 1978). It treats all variables
in the an al y si s eq u al ly , un l ik e r e g r e s s i o n , w h e r e a single
d e p e n d e n t v a r i a b l e is to be e x p l a i n e d by o n e or m or e
i n d e p e n d e n t varia ble s.
Given a set of n variables, where n > 2, principal component analysis rotates these variables in the « - d i m e n s i o n a l p a r a m e t e r
space to map them onto a new set of n variables, such that the first va riable in this new set conta ins the greatest possible
fraction of the total variance, the second contains the greatest
po ss ibl e fraction of the re m a in in g variance, and so on. The
dimensionality of the dataset is reduced by retaining only those
principal components which contain a significant fraction of the
original variance. The rotation matrix required is the matrix of
eigenvectors of the covariance matrix.
1.4.6 Three-dimensional QSAR
Several approaches have extended the traditional methods of d e r i v i n g Q S A R s , by m o d e l l i n g the d r ug s u s i n g m or e
c om pl ic a te d t hr ee -d im ens io nal descriptions.
1.4.6.1 Minimal Steric Difference (MSD)
This method, developed by Simon (1974), is based on the
assu mp tion that ligand-site interaction is a linearly de creasing
function of the steric misfit of the ligand and the site acceptor
cavity. An approximation of the shape of the cavity, called the
standard, is the natural effe ctor m o le cu le or the mo st active
structure in the set of com po u nd s under study. The structural
f o r m u l a e o f the ot h e r m o l e c u l e s are s u p e r i m p o s e d on the
standard. The MSD value of a structure is the number of non-
superimposable atoms, neglecting hydrogen, with atoms from the
higher period elements by a factor of two. A modified version of
the MSD procedure, the minimal topological difference (MTD)
m e t h o d ( S i m o n , 1 9 7 7 ) , d e f i n e s t h e s t a n d a r d as th e
h y p e r m o l e c u l e f o rm e d by the s u p e r i m p o s i t i o n of all the
structures under c o nsi der ati on, igno rin g h yd ro gen atoms. This
works best when there are clear steps in activity. Small changes
m ay be c o n t r o l l e d p r i m a r i l y by c h a n g e s in e l e c t r o s t a t i c
compl em en tar ity or conformational space.
1.4.6.2 Molecular Shape Analysis (MSA)
Information relating to the th ree-dimens ion al structure of
the drugs is used to compare differences in volumes and fields of
l i g a n d s in the m o l e c u l a r s h a p e a n a l y s i s ( M S A ) m e t h o d
(Hopfinger, 1980). The most stable conformers of the congeners
in the data se t are d e ter mi ne d by m ol e cu la r mech ani cs . In a
study of the inhibition of dihy dr of olate red uctase (DHFR) by triazines (I) (Hopfinger, 1981), the general measure of shape
x-6'
similarity was the co mmon overlap steric volume, Vq, between
pairs of C6H5X fragments, when the r esp ect ive two identical
triazine rings were superimposed. Vq was the sum of the van der WaaU s p h e r e i n t e r s e c t i o n v o l u m e s b e t w e e n p a i r s of n o n hydrogen atoms. It was concluded from a regression analysis that
the most active molecules would adopt co nformations such that
the angle between the planes of the triazine ring and the benzene
ring was 310°. More recent applications include the molecular
s h a p e a n a l y s i s of a s e r i e s o f i n d a n o n e - b e n z y l p i p e r i d i n e
inhibitors of acetylcholinesterase (Cardozo et al., 1992).
1.4.6.3 Distance geometry
The distance geometry method (Ghose and Crippen, 1983;
Ghose and Crippen, 1990) uses the three- dimen si on al structure and a t o m - b a s e d p h y s i c o c h e m i c a l p r o p e r t i e s of the li g a n d
molecules to develop a model for the binding site cavity. The
distance geometry rep resentation expresses the flexibility of a
mole cul e by a distance ran ge matrix show ing the upper and
lower bounds on the distance between atom pair. The underlying
idea is based on the following consideration. Suppose there are
two flexible ligand molecules m and n, and the atoms m i and m j
of molecule m and atoms rii and nj of molecule n occupy the same respective regions of the active site. The distance between the
and yih atoms in the two molecules must be very close in their
a c t i v e c o n f o r m a t i o n s . S i n c e in t h e d i s t a n c e g e o m e t r y
repre se nta tio n of the flexible molec ule s atomic dist anc es have
r anges, the active c o nf o r m a tio n s should be r e p r e s e n te d by a
comparisons will gradually decrease the range, and better define
the possible conformational region. Ultimately, analysis of these
distances will give the th ree -dimensi onal structure of the site
pockets accommodating the ligand atoms.
1.4.6.4 Comparative Molecular Field Analysis (CoMFA)
C o m pa ra tiv e m ol e cu la r field analysis ( C o M F A ) co mpares
molecules on the basis of the field that they present to their
su rr oun di ngs by map pi ng the field on a grid ( C ra m e r et a l ,
1988). The procedure can be summarised as:
( 1 ) Postulate a set of orientation rules.
( 2) Align the set of molecules and establish a lattice which
surrounds the set in potential receptor space.
( 3 ) For each molecule calculate the field which a probe atom
would experience at each lattice point.
( 4 ) Use partial least squares statistics to determine a minimal
set of lattice points necessary to distinguish the set of compounds
according to their measured activities.
( 5 ) C h e c k the p r e d i c t i v e v a lu e o f the l a t t ic e m od el by
s u c c e s s i v e l y e l i m i n a t i n g o b s e r v a t i o n s a nd d e t e r m i n e the
predictive value of the newly derived model.
( 6 ) Repeat steps (4) and (5) to find a model of high predictive
v a l u e .
More traditional physical data may be used to augment the steric
and electrostatic field generated by CoMFA (McFarland, 1992). It
is difficult, however, to appropriately weight the electrostatic and
steric variables. Also, the superposition is crucial.
1.4.6.5 Mo lecular similarity
As is ev ide nt from the a b ove d is c u ss io n, m et h o ds of
c o m p a r in g m o lec u le s are central to th r e e - d im e n s i o n a l QSAR.
Similarity indices may be based on electron density calculated a b i n i t i o ( B o w e n - J e n k i n s et al., 1985) or using se m i- e m pi ri ca l methods (Hodgkin and Richards, 1986; Burt and Richards, 1990;
Good et at., 1993). Mole cul ar size and shape are defined by ele ctron de nsity, in that the n u c le a r p os it io n s d e te r m i n e the
electron density. Atomic co-ordinates may be used directly to provide measures of similarity (Meyer and Richards, 1991). The
application o f simulated annealing algorithms (Kirkpatrick, 1983) to calculating molecular similarity based on atomic positions has
also been investigated (Barakat and Dean, 1990a, 1990b, 1991; Papadopoulos and Dean, 1991).
1.4.7 N o n - p a r a m e t r i c te c h n iq u e s
T h e a p p r o a c h e s d i s c u s s e d so far i n v o l v e p a r a m e t r i c
r e g r e s s i o n a n a l y s i s . One o f th e c o m m o n a s s u m p t i o n s of
pa ra m et ric methods is that the da ta are no r m al ly distributed.
This assumption is avoided in non -parametric techniques, many
of which originate from the fields of pattern recognition and
artificial intelligence.
1.4.7.1 Pat tern r ec og n iti on
Pattern recognition techniques seek to detect and predict
on those objects. In an early application of pattern recognition,
the o do ur of a m olecule was p r ed ic te d from its shape, as
modelled by the silhouette of a scale molecular model (Amoore et al.y 1967). The silhouettes were scanned with 4096 random lines which were assigned a binary number depending on the number
of i n t e r s e c t i o n s the line m a d e w it h the s i l h o u e t t e . This
r e p r e s e n ta t io n was used to c a l c u l a t e the s im ila r ity be twe en
unknown patterns and learned examples.
T h e i n t e r p r e t a t i o n of c h e m i c a l d a t a u s i n g p a t t e r n
recognition has been discussed by Kowalski and Bender (1972),
wh o s u b s e q u e n t l y a n a l y se d two h u n d r e d d r u g s t es te d for
act ivity in the solid tu m o u r a d e n o c a r c i n o m a 755 sc ree ni ng system (Kowalski and Bender, 1974). Three pattern recognition
methods were used, with ap proximately 90% correct responses, although the selection and representation of the data were later
criticised (Mathews, 1975). A pattern recognition study relating
the pharmacological activity of a compound to its mass spectrum
(Ting et a l , 1973) also attracted some criticism (Perrin, 1974).
A linear learning machine, a fo rerunner of current neural
networks, was compared with a nearest neighbour algorithm (see
C h a p t e r 4) for the p r e d i c ti o n o f a n t i t u m o u r ac t iv i t y o f a
structurally diverse set o f compounds tested in an experimental
m ou se brain t u m o ur system. Stupe r and Jurs (197 5) used a
l i n e a r l e a r n in g m a c h i n e to c l a s s i f y p s y c h o t r o p i c d r u g s as
sedatives or tranquillisers with a predictive ability on unknowns
of about 90%. This work and the field as a whole has been
extensively reviewed (Stuper et al.y 1979; Jurs, 1986).
1.4.7.2 Artificial intelligence methods
S e v e r a l a r t i f i c i a l i n t e l l i g e n c e a p p r o a c h e s h a v e been
d e v e l o p e d for the m a n i p u l a t io n and e v a l u a t i o n of c h em ica l
structures. In the CASE method (Computer Automated Structure
E v a l u a t i o n , K l o p m a n et al., 1984; K lo pm an and Ptchelintsev, 1993), substructural units of ten atoms or so are used to find
structural features which may be correlated to biological activity.
A symbolically based program, W IZ A R D (Dolata et al., 1987; L each et al., 1988), searches the c o nf o rm a tio na l space of a molecule to identify conformations near energy minima.
T he m a c h i n e l e a r n in g p r o g r a m F L E M I N G , ba se d on
i nductive logic, was used to predict inhibitors of thermolysin
(Bolis, 1991). Inductive logic involves the formulation of rules
that are c o n s i s t e n t with the data, w h e r ea s d e d u c t i v e logic
formulates relationships that must follow from initial axioms. A sample of active and inactive comp ou nd s, viewed as a set of
p o si t iv e and ne gat ive e x a m p le s, pe rm its the i n duc ti on of a
m o l e c u l a r m od el c h a r a c t e r i s i n g the i n t e r a c t i o n b e tw e e n the
drugs and the target molecule. Rule-induction has been suggested
as co mplementary technique to conventional QSAR methods (A-
Razzak and Glen, 1992). Here a modified IDS algorithm (Quinlan, 1986) constructs a simple decision tree from a number of objects.
A n o t h e r c o m p u t e r l e a r n i n g m e t h o d , i n d u c t i v e lo g ic
p ro g r a m m i n g (ILP), has been used to m od el the Q S A R of
1992) . P h y s i c o c h e m i c a l a t t r i b u t e s ( P C A s ) w e r e a s s i g n e d h eu ri s ti ca l ly to su b sti tu en ts, and were c ho se n to m ake the
approach generally applicable to drug design problems. While not
significantly better than the traditional QSAR, this method also
p r o d u c e d r u l e s t h a t c o u l d p r o v i d e i n s i g h t i n t o t h e
stereochemistry of dr ug-DHFR interactions.
1.4.8 Neural network applications
In the last couple of years, work applying backpropagating
neural networks to QSAR has considered the description of drug
molecules in the formalism of Hansch (Hansch, 1969; Hansch et
al., 1962), which is simpler than some of the above approaches. The input is generally the param eters used by Hansch; molar
r e f r a c t i v i t y and h y d r o p h o b i c c o n s t a n t s , f o r the r e l e v a n t
substituents. These values are usually scaled to lie between zero
and unity. The output is the activity of the molecules for a given
assay. Most applications have used hidden units.
Neural networks have been used to derive the QSAR of 16
c a r b o q u i n o n e d e r i v a t i v e s and th e i r a n t i c a r c i n o g e n i c a ct iv it y
(Aoya ma and Ichikawa, 1992; A oya m a et al., 1990a; Tetko et a i ,
1993), and the QS AR of the a n ti h y pe r t e n si v e act ivity of 29
d e r i v a t i v e s o f a r y l a c r y l o y l p i p e r a z i n e ( A o y a m a et al., 1990b). This study was extended to the QSAR of 39 carboquinones, and
the QSAR of 60 benzodiazepines (Ao ya ma et al., 1990a). In the benzodiazepine study, three different assays were used for most
of the drugs, giving 163 data examples. The neural network was
compared to a regression analysis, and gave better results in 96
cases, worse results in 62 cases, and c om pa rab le results in 5
cases. Neural network analyses of the QSAR of 2,4-diamino-5- (s u b s ti t u te d - ) p y r i m i d i n e s as d i h y d r o f o l a t e r e d u c t a s e (D H FR )
inhibitors (So and Richards, 1992) and the QSAR of 2,4-diamino-
6 , - d i m e t h y l - 5 - p h e n y l d i h y d r o t r i a z i n e s as D H F R i n h i b i t o r s
( A n d r e a and K a l a y e h , 1991) h a v e s u g g e s t e d t h a t n e u ra l n e t w o r k s can p e r f o r m b e t t e r t h a n t r a d i t i o n a l r e g r e s s i o n
m eth ods , be cau se they intr od uc e c ro ss -t er m s into the Hansch
e q u a t i o n .
A cautionary note has been sounded by Livingstone and c o
workers, who have discus sed the da nge rs of ov er-fitting due rel a ti v e ly small da ta sets and large n u m b e r s of pa ra m e t e r s
(Livingstone and Salt, 1992; Livingstone and Mallanack, 1993). Wikel and Dow (1993) have used neural networks for selecting
the variables to be considered in a QSAR. Neural networks have
a lso been used to r e d u c e the d i m e n s i o n a l i t y of a data
representation, by m apping the input onto its elf via a smaller number of hidden units (Livingstone, 1991; Good et al., 1993). If two hidden units are used, then the activity of these units is
readily shown in graphical form.
1.4.9 Qua nt um theoretical methods
V a r i o u s m o l e c u l a r p r o p e r t i e s m a y be c a l c u l a t e d by
qu an tum mechanics, which provides energies and wavefunctions
for small molecules. The energies of different conformers may be
determined. The wavefunction may be used to calculate electron
properties. The type of quantum mechanics calculation that can
be performed depends on the number of electrons in the system
and the available computer resources. For small systems it may
be feasible to perform ab initio calculations; for larger systems, t h e r e are m a n y s e m i - e m p i r i c a l m e t h o d s ( R i c h a r d s , 1989);
c a lc ul at io ns including proteins i nvo lve fur ther a pp ro xi m at io n s, such as the use of partial charges (Hayes and Kollman, 1976). A
more detailed survey of this huge field is given by Loew and
Burt (1990).
1. 4 .1 0 S t r u c tu r e - b a s e d st ra te gi e s
All the approaches reviewed so far assume no knowledge
of the receptor site. If the structure of the receptor is known,
from X-ray c ry s t a l lo g ra p h y or N M R e x p e r i m e n t s , then drug d esign can be tackled using m o r e s o p h i s t i c a t e d a p p ro a c h e s
(Goodford, 1984; Kuntz, 1992; McC amm on, 1987). Graph theory
as applied to molecules can be used to generate fragments that
fit into the binding site (Lewis and Dean, 1989a, 1989b; Lewis,
1992; Chau and Dean, 1992a, 1992b, 1992c). A molecular docking
pro gra m, DO CK (Kuntz, 1982), has recen tl y been applied to
d i s c o v e r in hib it or s of t h y m i d y l a t e s y nt h a se ( S h o i c h e t et al.,
1993). The progr am GRID (Goodford, 1985), which determines
p r o b a b l e i n t e r a c t i o n s i t e s b e t w e e n p r o b e s w i t h v a r i o u s
f unc ti on al group c h ara ct eri sti cs and the e n z y m e surface, was
used to de sign s i a li d a s e - b a s e d i n h ib i t o r s o f i n f l u e n z a virus
replication (von Itzstein, 1993). How ever, despite the elegance
and increasing use of structure-based drug design methods, drug
design in the absence of the structure of the receptor remains an
important and, in some ways, more difficult problem.
1.5 S e q u e n c e a n a l y s i s
Chapter 3 presents an application of neural networks to a
sequence analysis problem. In this section, sequence analysis by
n e u ra l n e tw o rk s is r e v i e w e d , to p r o v i d e a b a c k g r o u n d on
sequence analysis generally, and to introduce co nsi derations on
the i m p l e m e n ta t io n of ne ura l n e tw o rk s , som e of w hi c h are
important in applications other than sequence analysis.
1.5.1 Nucleic acid sequence analysis by neural networks
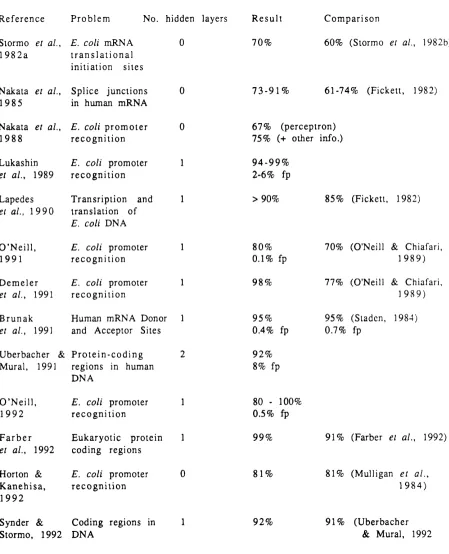
Table 1.1 summarises the performances of neural networks applied to various problems, and shows the au th or s’ comparisons
of the neural network approach with other methods. The results
and comparisons are discussed more fully below.
1.5.1.1 Translational initiation sites in E. coli
The first application of a neural network model to sequence
analysis was by Stormo et al. (1982a), who used a perce pt ro n algorithm with no hidden layers to predict translational initiation
R e f e r e n c e P r o b l e m N o. hidden layers R e s u l t C o m p a r i s o n
Siormo et a i , 1 9 8 2 a
E. coli mRN A t r a n s l a t i o n a l i n it ia tio n site s
0 70% 60% (Stormo et a i , 1982b)
Nakala et a i , 1 9 8 5
S p l i c e ju n ctio n s in human m R N A
0 7 3 - 9 1 % 6 1-74% (P ick ett, 1982)
Nakata et a i , 1 9 8 8
E. col i p r o m o t e r r e c o g n i t i o n
0 67% (p ercep tron)
75% (+ other info.)
Lukashin et a i , 1989
E. col i promoter r e c o g n i t i o n
1 9 4 - 9 9 %
2-6% fp
Lapedes et a i , 1 9 9 0
T ran srip tion and
transla tio n o f E. coli D N A
1 > 90% 85% (Pickett, 1982)
O ’N e i l l , 1 9 9 1
E. col i promoter r e c o g n i t i o n
1 80%
0.1% fp
70% (O'Neill & Chiafari, 1 9 8 9 )
D e m e l e r
et a i , 1991
E. col i promoter r e c o g n i t i o n
1 98% 77% (O'Neill & Chiafari,
1 9 8 9 )
B r u n a k
et a i , 1991
Human m RN A Donor and Acceptor Sites
1 95%
0.4% fp
95% (Staden, 1984) 0.7% fp
U berbacher &
Mural, 1991
P r o t e i n - c o d i n g regio ns in human D N A
2 92%
8% fp
O ’N e i l l , 1 9 9 2
E. col i promoter r e c o g n i t i o n
1 80 - 100%
0.5% fp
F a r b e r et a i , 1992
E u k a r y o t ic protein c o d in g region s
1 99% 91% (Parber et a i , 1992)
Horton &
K a n e h i s a , 1 9 9 2
E. col i promoter r e c o g n i t i o n
0 81% 81% (Mulligan et a i ,
1 9 8 4 )
Synder &
Stormo, 19 9 2
C od in g regions in
D N A
1 92% 91% (U b erbacher
& Mural, 1992
T a b l e 1.1 Neural network applications to analyses of
nucleic acid sequences. The table summarises the
problem tackled, the number of hidden layers, the
result (fp = % false positives) and the comparison, if
any, made by the authors to other methods.
167 false beginnings, as identified by another method (Stormo et a l ., 1982b). In a test set of ten genes, the perceptron correctly predicted six of the gene beginnings and incorrectly identified
five false beginnings. A rule based approach (S to rm o et al.,
1982b) only predicted five true gene beginnings and identified
twelve false ones.
1.5.1.2 Splice junctions
Nucleotide segments that code for amino acids are called
exons; those seg men ts that are not tr ans lated are kn ow n as
introns. Splice junctions are the boundaries between intron and exon segments. The discrimination between introns and exons is
vital for determining what proteins are encoded in a nucleotide
s e q u e n c e .
There are two basic approaches to the computer prediction
of p r o t e i n - c o d i n g r e g i o n s in DN A. Fi rst ly , c o d in g f unc ti on
c o ns tr ai n s a n u c le o ti d e se que nc e, so c o di n g and n o n -c o d i n g
sequences can be distinguished using patterns of codon usage
(Shepherd, 1981; Staden and McLachlan, 1982; Gribscov et a/.,
1984; T r a m o n t a n o and M a c c h i a t o , 1986; T r i f o n o v , 1987),
positional mono- and oligo nuc leot ide frequ en cie s and weak 3-
pe riod icity (Pickett, 1982; Staden, 1984a). Seco ndly , the non-
u n i f o r m i t y of n u c l e o t i d e d i st r ib u t i o n n e a r start c o d o n s and
splicing sites can be used (Shapiro and Senepathy, 1987; Ohshima
and Gotoh, 1987; lida, 1987; Gelfand, 1989). The more successful
Na ka ta eî al. (1985) predicted splice ju n ct io ns in human m R N A s e q u e n c e s by d i s c r i m i n a n t a n a l y s i s o f i n f o r m a t i o n
including cons ens us sequence patterns around splice jun ctio ns, free e n erg y of snR N A and m R N A base p a ir in g , and base
composition and periodicity. Discriminant analysis is a statistical
t e c hn iq u e based on a c o m pa r is o n of d i st r ib u t i o n pro fi les of
c ert ain att rib u te s ( d i sc ri m in a n t v a ri a bl e s) for true and false
se q u e n c e s . W h e n the d i s t r i b u t i o n s are well s e p a r a t e d , the
a t t r i b u t e s may be us ed for d i s t i n g u i s h i n g tru e and false
se q u e n c e s . I n f o r m a t i o n a b o u t the c o n s e n s u s s e q u e n c e was provided by the output activities of two tw o -l ay e r perceptrons
one trained to recog nize exon/intron boundaries and the other
i n tr o n / e x o n bo un d a rie s. The o ut pu t a cti vi ty wa s ter m ed the perceptron value by Nakata et at. (1985), and it reflects a degree of similarity of the input pattern to the co n se ns us sequence pa tte rn s of true sequ enc es . The pe rc ep t r o n va lue was more
a ccurate than Pi c k e t t ’s function, a co m b in ed m e a s u r e of base
c omp os ition and periodicity (Pickett, 1982), for pr edic ting the
start of coding regions (84% versus 74%), the end of coding
regions (78% versus 61%), the exon/intron boundary (91% versus
66%) and the intron/exon boundary (82% versus 65%).
B r u n a k et at. (199 1) used neural n e t w o r k s trained by b a ck pr op ag a tio n to tac kle both ap pro ach es to the p ro bl em of
distinguishing coding and non-coding regions, and, based on the
co m b i n ed result, pr edi cte d human m R N A d o n o r and acceptor
sites in DNA. M u l t i- l a y e r neural n et w o rk s tr ai n ed on short
s e q u e n c e s e g m e n t s we re u se d to i d e n t i f y i n t r o n / e x o n and
ex on/intron boundaries. Other neural netw orks we re trained on