ESSENTIAL
INTELLIGENCE
McGraw Hill Financial 2015 Annual Report
McGraw Hill Financial (NYSE: MHFI) is a leading financial intelligence company providing the global
capital and commodity markets with independent benchmarks, credit ratings, portfolio and
enterprise risk solutions, and analytics. The Company's iconic brands include Standard & Poor’s
Ratings Services, S&P Global Market Intelligence, S&P Dow Jones Indices, Platts and CRISIL.
McGraw Hill Financial
Financial Highlights
Years ended December 31
(in millions, except per share data) 2015 2014 % Change
Revenue $ 5,313 $ 5,051 5
Adjusted income from continuing operations (attributable to the Company’s
common shareholders)* 1,244 (c) 1,073 (d) 16
Adjusted diluted earnings per common share from continuing operations* $ 4.53 (c) $ 3.88 (d) 17
Dividends per common share (e) $ 1.32 $ 1.20 10
Total assets $ 8,183 $ 6,773 21
Capital expenditures (f) 139 92 51
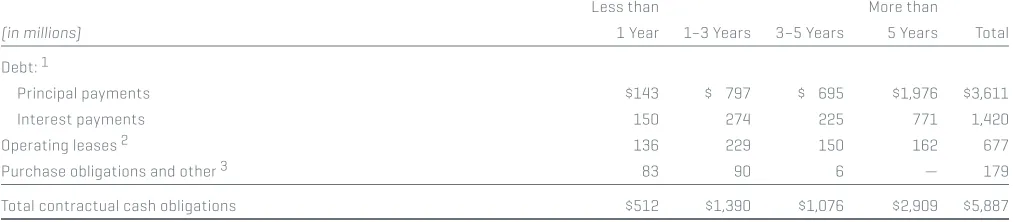
Total debt 3,611 795 N/M
Equity (including redeemable noncontrolling interest) 1,163 1,349 (14)
N/M—not meaningful
* Refer to “Reconciliation of Non-GAAP Financial Information” on page 11 of this report for a discussion of the Company’s non-GAAP financial measures.
(a) Assumes $100 invested on December 31, 2010 and total return includes reinvestment of dividends through December 31, 2015.
(b) The current peer group consists of the following companies: Thomson Reuters Corporation, Moody’s Corporation, CME Group Inc., MSCI Inc., FactSet Research Systems Inc. and IHS Inc. Beginning in fiscal 2014, the Company selected a new peer group to more accurately reflect the Company’s peers in terms of industry after the portfolio rationalization of certain businesses. The previous peer group consisted of the following companies: Thomson Reuters Corporation, Thomson Reuters PLC (through September of 2009), Reed Elsevier NV, Reed Elsevier PLC, Pearson PLC, Moody’s Corporation and Wolters Kluwer.
(c) Excludes the impact of the following items: costs related to identified operating efficiencies primarily related to restructuring of $56 million, legal settlement charges partially offset by insurance recoveries of $54 million, acquisition-related costs of $37 million, and a gain of $11 million on the sale of our interest in a legacy McGraw Hill Construction investment.
(d) Excludes the impact of the following items: $1.6 billion of legal and regulatory settlements, restructuring charges of $86 million, and $4 million of professional fees largely related to corporate development activities.
YEAR-END SHARE PRICE YEAR-END SHARE PRICE 0 20 40 60 80 100 ’15 $98.58 ’14 $88.98 ’13 $78.20 ’12 $54.67 ’11 $44.97 DIVIDENDS PER SHARE DIVIDENDS PER SHARE 0.0 0.3 0.6 0.9 1.2 1.5 ’15 $1.32 ’14 $1.20 ’13 $1.12 ’12 $1.02 ’11 $1.00 REVENUE (in millions) REVENUE 0 1000 2000 3000 4000 5000 6000 ’15 $5,313 ’10 MHFI
’11 ’12 ’13 ’14 ’15 $311 $181 $173 ’14 $5,051 ’13 $4,702 ’12 $4,270 ’11 $3,762 SHAREHOLDER RETURN FIVE-YEAR CUMULATIVE
TOTAL RETURN (a)
(12/31/10–12/31/15) 0 100 200 300 $400 0 100 200 300 400
S&P 500 Peer Group (b)
YEAR-END SHARE PRICE YEAR-END SHARE PRICE 0 20 40 60 80 100 ’15 $98.58 ’14 $88.98 ’13 $78.20 ’12 $54.67 ’11 $44.97 DIVIDENDS PER SHARE DIVIDENDS PER SHARE 0.0 0.3 0.6 0.9 1.2 1.5 ’15 $1.32 ’14 $1.20 ’13 $1.12 ’12 $1.02 ’11 $1.00 REVENUE (in millions) REVENUE 0 1000 2000 3000 4000 5000 6000 ’15 $5,313 ’10 MHFI
’11 ’12 ’13 ’14 ’15 $311 $181 $173 ’14 $5,051 ’13 $4,702 ’12 $4,270 ’11 $3,762 SHAREHOLDER RETURN FIVE-YEAR CUMULATIVE
TOTAL RETURN (a)
(12/31/10–12/31/15) 0 100 200 300 $400 0 100 200 300 400
Our Company has undergone profound, positive change in recent years. The management team has dramatically sharpened the Company’s strategic focus and invested in fast-growing, high-margin businesses serving the global capital and commodities markets.
The evolution of McGraw Hill Financial continued in 2015. Doug and his team made excellent progress strengthening the portfolio of businesses—including the decision to evaluate strategic alter-natives for J.D. Power—putting significant legal matters behind the Company and reshaping the senior leadership team.
The exciting transformation of McGraw Hill Financial is ongoing. The team has proposed rebranding the Company S&P Global* to better reflect our core businesses and capitalize on one of the most recognizable brands in
finan-cial markets. The Board unanimously
endorses this move and we ask share-holders to support the name change at our Annual Meeting on April 27. I encourage you to read Doug’s letter
in which he explains why the Company is moving in this direction.
In the midst of all of this change, McGraw Hill Financial continues to produce excellent financial results and create value for shareholders.
As a former investment manager, I value the return of capital to shareholders. In this regard, McGraw Hill Financial has a strong record. Last year, the Company returned $1.3 billion to shareholders through dividends and share repurchases. Since the start of 2011, McGraw Hill Financial has returned more than $6 bil-lion in the form of dividends and share buybacks. Additionally, the Company’s total shareholder return of 12.3% sig-nificantly outperformed the 1.4% gain in the S&P 500 in 2015. To demonstrate the Company’s ongoing commitment to maximizing shareowner value, the Board approved in January a 9% increase in the quarterly cash dividend to an annu-alized rate of $1.44.
The Board takes its fiduciary responsi-bilities seriously and holds management to a very high standard. I am pleased that Doug has taken a hands-on approach to enhancing the Company’s already strong risk management and compliance culture as he aligns relevant functions across the enterprise and within each business.
Our Company is entering a new era with a fresh but well-known and trusted brand identity. It is well positioned to continue to provide strong shareholder returns. And I know that Doug and the leadership team are energized to drive profitable growth with an eye on man-aging and mitigating risk. I look to the future with great optimism.
Sincerely,
CHARLES E. “ED” HALDEMAN, JR.
Chairman of the BoardEVOLVING. GROWING.
Dear Fellow Shareholders:
ON BEHALF OF THE BOARD OF DIRECTORS, I THANK YOU FOR YOUR INTEREST AND SUPPORT OF McGRAW HILL FINANCIAL. I WILL
Letter from the President
and Chief Executive Officer:
Steady growth has been a hallmark for us. In fact, over the last five years our Company has generated double- digit compound annual growth rates (CAGR) in adjusted operating profit and adjusted EPS while increasing revenue at a CAGR of 9%.
I extend my gratitude to our employees for their dedication to achieve these results and for their ongoing commit-ment to operating with integrity in everything they do.
I am proud of our recent performance. This letter affords me the opportunity to summarize our progress. But I also want to tell you about our long-term future. As we look ahead to the rest of this year and beyond, we are even more excited by what’s in store. We are guided by a growth and performance plan built on a focused set of strategic initiatives.
One of the pillars of our plan is to take the next step in the evolution of this Company by changing its name. A key strength of our busi ness stems from trusted, iconic brands. Markets all around the globe depend on the credit ratings, research, data and deep
analytics behind the name Standard & Poor’s (S&P).
Although we have a diverse portfolio of businesses, they are all united around a central thread: we provide the intelli-gence that is essential to how partici-pants of the capital and commodity markets make decisions with confi-dence. Every decision is only as good as the intelligence used to make it. As we grow into the future, it will be by finding ways to strengthen and enrich this essential intelligence.
The S&P franchise has built enormous brand equity through more than 150 years in business. To harness this power, we announced in February that we are proposing to change the Company’s name to S&P Global*. The S&P name leverages the rich heritage of Standard & Poor’s and Global communicates our wide geographic footprint, the broad range of industries we cover and the full suite of services we have to offer.
Over the years the S&P name has stood for transparency and trusted financial information, which enables our clients to make informed business choices. This remains the core of our business.
$1.3
B
RETURNED TO
SHAREHOLDERS IN 2015
McGRAW HILL FINANCIAL PRODUCED ANOTHER YEAR OF STRONG GROWTH AND
PERFORMANCE IN 2015 IN THE FACE OF DRAMATIC VOLATILITY IN THE FIXED-INCOME AND EQUITY MARKETS. LAST YEAR, REVENUE INCREASED 5%, ADJUSTED OPERATING PROFIT WAS UP 13%, ADJUSTED DILUTED EARNINGS PER SHARE GREW 17% AND WE GENERATED MORE THAN $1.2 BILLION IN FREE CASH FLOW, EXCLUDING LEGAL AND REGULATORY SETTLEMENTS AND INSURANCE RECOVERIES.
THE BRAND OF OUR FUTURE
S&P
GLOBAL
THE COMPANY ANNOUNCED IN
FEBRUARY 2016 IT HAS PROPOSED
CHANGING ITS NAME, PENDING
SHAREHOLDER APPROVAL
+9%
INCREASE IN 2016
ANNUAL CASH DIVIDEND
~$100
M
OF POTENTIAL
SYNERGIES
BY COMBINING
S&P CAPITAL IQ
AND SNL FINANCIAL
BY 2019
Simply put, S&P Global is the brand of our future. This brand connects our employees, unifies them around a common mission of providing essential intelligence, aligns with our long-term business strategy and offers a familiar master brand to the marketplace.
The enthusiasm we share with our Board for our new name is matched by the many significant opportunities we see ahead to drive more growth and higher levels of performance.
ADDING COMPLEMENTARY CAPABILITIES
For starters, we have been investing in our future growth by adding comple-mentary capabilities to the Company.
As you know, in 2015, we acquired SNL Financial LC, a standout data and ana-lytics business with excellent leader-ship. Since closing the transaction in the fall we have made great progress integrating this business. SNL is a “must have” product for countless global cus-tomers and we believe we can unlock tremendous revenue opportunities and cost synergies. The combination of the two companies, now called S&P Global Market Intelligence, should enable us to generate approximately $100 million of EBITDA synergies by 2019.
We are constantly on the lookout for new opportunities to diversify and expand Platts’ coverage. Last year we added Petromedia, a specialist provider of news, daily prices and analysis for the global shipping and oil industries. This purchase helps extend Platts’ coverage beyond traditional marine fuels and market fundamentals, and offers clients the ability to help manage counterparty risk and monitor marine fuel quality.
ORGANIC GROWTH
Our growth is not dependent solely on transactions. Our first priority when determining how to allocate capital is to invest in organic growth. On this front, we are increasing the breadth and depth of our product offerings. Last year we launched the market’s first-ever index that tracks the debt of the companies in the S&P 500. We’ve received a tre-mendous response from the market-place with the index to be used as the basis for several soon to be launched exchange traded funds (ETFs).
In addition, we created China Oil Analytics. This uniquely comprehensive analytical product enables clients to consider the myriad factors affecting China’s oil bal-ance. Combining Platts’ local and global market analysis with news, data and an intuitive analytical tool, this new offering helps traders, producers and analysts make the decisions they need to do their jobs.
EVALUATING STRATEGIC ALTERNATIVES
While adding to our capabilities has been a priority, so too has been an effort to become a more focused and highly interrelated global portfolio of businesses. To this end we initiated an active program to sell J.D. Power and we have received considerable interest from third parties. J.D. Power is a phe-nomenal brand with sales projected to approach $350 million.
INVESTING IN PEOPLE
As a business that relies on the intellec-tual capital of its people, we are contin-ually investing in our employees. This year we are devoting more resources to onboarding, training and development programs.
We have excellent leaders throughout the organization. In 2015, we appointed a number of people to new positions on the Executive Committee, including:
• Ashu Suyash who joined us as the CEO
of CRISIL, India’s leading credit ratings agency and a global analytics firm. Ashu previously was CEO of L&T Invest-ment ManageInvest-ment Ltd. and has worked for Fidelity and Citigroup in India.
• Martina Cheung who was leading
corporate strategy is now heading Global Risk Services, a response to clients’ continuing need for credit solutions from S&P. This is a new team that brings together this Company’s formidable assets into a single
business focused on monetizing research, data, methodologies and solutions.
• Mike Chinn who we quickly decided should serve as President of S&P Global Market Intelligence, the new name for the combined S&P Capital IQ and SNL franchise, after he did an excellent job running SNL.
• John Berisford, who is a trusted part-ner, is now the President of S&P Ratings Services. John is doing an outstanding job in aligning the organi-zation to focus on quality analytics within an environment that promotes a culture of risk and compliance consciousness.
• France Gingras who was promoted to
Executive Vice President, Human Resources after leading our total rewards program.
• Imogen Dillon Hatcher who has taken
on the role of leading Platts after a successful term as President of S&P Capital IQ. I commend Imogen and her team for managing Platts through vol-atile market conditions.
• David Goldenberg who is our acting General Counsel. He previously was Chief Legal Officer for S&P Capital IQ.
• And Courtney Geduldig who has taken
on the broader responsibility of lead-ing our public affairs organization after successfully running our govern-ment affairs and public policy team.
$1.2
B
ADJUSTED FREE CASH
FLOW IN 2015*
+9%
MHFI
REVENUE CAGR
2011–2015
They all are doing great work, and I am grateful for all of the contributions from the entire team both at the office and in their communities.
MANAGING FOR THE FUTURE
Before I conclude I want to touch on some important themes that are impor-tant contributors to creating long-term growth and value for the global economy and for our Company.
These issues present opportunities for the private sector to demonstrate lead-ership, especially by seeking out public- private partnerships in ways that will enable economies, communities and companies to grow and people to pros-per over the long term.
For example, the significantly under-funded infrastructure needs of govern-ments in the U.S. and around the globe present both a significant challenge and large opportunity. The Bipartisan Policy Center has estimated a $1 trillion gap between the current pace of infrastruc-ture funding and our country’s needs. Working closely with our government partners, the private sector can identify critical regulatory barriers to invest-ment and find pragmatic solutions to overcome them. And we can promote the use of more standard and transpar-ent data and allow long-term investors to more carefully assess project risks. With my fellow Trustees of the World Economic Forum’s Global Challenge
Initiative on Long-Term Investing, Infra-structure and Development, I support more public-private collaboration as a key to advancing this important issue.
Environmental, Social and Governance (ESG) criteria are also receiving increas-ing attention from long-term investors. By balancing good corporate governance, environmental risk and strategic corpo-rate citizenship all companies can derive sustainable long-term benefit without sacrificing corporate performance in the short term.
In terms of our own Company, there are three points to make:
First, ESG performance is critical to how we operate. We have an enduring commitment to minimizing our environ-mental impact, enhancing the diversity of our workforce and a particular focus on facilitating access to capital for female entrepreneurs.
Second, I want to emphasize that we are committed to a balanced decision- making process that is driven by long-term, sustainable objectives and finan-cial quality through measurable near- term performance.
Third, the essential intelligence we pro-vide our clients and the capital markets is at the very heart of the balanced decision-making necessary to support the needs of long-term investors. For example, in early 2016, we launched the S&P Long-Term Value Creation Global
Index, designed to measure companies that have the potential to create long-term value based on sustainability crite-ria and financial quality. We are proud of this initiative and the interest it has received.
Throughout the global economy and the private sector, short-term thinking is holding back investment. We all have a role to play to encourage public policies and corporate decisions designed to achieve long-term value creation.
CONCLUSION
To sum up, 2015 was an excellent year with growth for our Company, our employees and our shareholders. We expect more profitable growth and higher levels of performance under the banner of S&P Global in 2016. I am for-tunate to work with a Board of Directors that understands the need for making the investments and commitments necessary for sustainable, long-term growth and performance. I look forward to working with our Board, employees and partners to accomplish our goals, and continuing to speak with customers, policy makers and shareholders about the evolution and growth of S&P Global.
Best regards,
DOUGLAS L. PETERSON
President and Chief Executive Officer2015: ANOTHER YEAR
OF GROWTH
$5.31
B
REVENUE
(+5% Increase from 2014)
$4.53
ADJUSTED
DILUTED EARNINGS
PER SHARE*
(+17% Increase from 2014)
38.7%
ADJUSTED
OPERATING
PROFIT MARGIN*
(+280 BPS from 2014)
A GLOBAL COMPANY
20,400
EMPLOYEES
31
COUNTRIES
IN
~40%
REVENUE
GENERATED
OUTSIDE THE U.S.
REVENUE BREAKDOWN
BY GEOGRAPHIC REGION
North America $3.4B
EMEA $1.3B
Latin America $0.1B Asia Pacific $0.5B
THE ACQUISITION OF SNL FINANCIAL IN 2015 AND ITS INTEGRATION WITH S&P CAPITAL IQ HAS CREATED ONE OF THE MOST POWERFUL RESEARCH, DATA AND ANALYTICS PLATFORMS SERVING THE CAPITAL AND CORPORATE MARKETS.
S&P Capital IQ + SNL Financial = S&P Global Market Intelligence
As SNL and S&P Capital IQ unite, it is important that the combined business conveys not only that it provides intel-ligence about the markets, but that it also provides real insights that enable its clients to make smarter, faster investment decisions. That is why this division has been rebranded S&P Global Market Intelligence in 2016.
OUTLOOK
S&P Global Market Intelligence is pur-suing significant opportunities to grow and support clients through three key initiatives:
• Introducing new products and diver-sifying its client base
The S&P brand has a rich history of credit analysis, and the combined team is very well positioned to help clients deal with the growing need to address coun terparty credit risk and compliance issues created by volatile and rapidly changing markets and reg-ulatory regimes. President Mike Chinn sees opportunities to introduce new products to support all parts of the credit world. Helping companies evalu-ate risk in their supply chains is but one example where S&P Global Market Intelligence could play a larger role.
It wasn’t that long ago that SNL’s customer base was concentrated in the investment bank and investment management sectors. Now the busi-ness has a robust and fast-growing presence in the corporate markets, serving commercial banks and insur-ers but also companies that operate in the power and gas, real estate, mining, media, and communications sectors.
• Pursuing global growth opportunities
Nearly all of SNL’s revenue has been generated in the Americas. With the creation of one team that can leverage S&P Capital IQ’s presence in Europe, Latin America and Asia, increasing SNL’s global reach is a clear and imme-diate opportunity.
• Integrating technology platforms
Both S&P Capital IQ and SNL possess strong and sophisticated content delivery platforms, and the combined team is now determining how to most effectively consolidate into one best-in-breed product platform. As an initial step, the team will deliver SNL content through S&P Capital IQ’s direct feeds product. Looking ahead, the goal is to introduce an integrated technology approach with one distribution platform.
A COMMITMENT TO GOOD
CORPORATE CITIZENSHIP:
COMMUNITY IMPACT MONTH
Volunteered to
Build Thriving
Communities in
Covering
Supporting
Mike Chinn
President of
S&P Global Market Intelligence
5,000
EMPLOYEES
17
COUNTRIES
5
CONTINENTS
70
NON-PROFIT
PARTNERS
Committed to Serving
ESG Investors
As part of McGraw Hill Financial’s broad com-mitment to promoting inclusive, sustainable communities and financial markets, the Company provides a range of capabilities to clients whose focus is on Environmental, Social and Governance (ESG) investing. The market for sustainable investments is increasing rapidly—rising by 76% to $6.6 trillion in the U.S. from 2012 to 2014 and by 33% to €9.9 trillion in Europe.
The Company’s products and services sup-port more sustainable markets and help pave the way for policy makers and businesses to adopt effective risk management strategies.
Snapshot of MHFI’s Offerings:
• Standard & Poor’s RatingsDirect Climate Risk Reports
• Dow Jones Sustainability Index
• S&P Global Market Intelligence Small and Medium-sized Enterprises (SME) Scorecard
27
COUNTRIES WITH
S&P RATINGS OFFICES
1.14
MILLION RATINGS
OUTSTANDING
$46.3
TRILLION OF RATED
GLOBAL DEBT OUTSTANDING
Standard & Poor's Ratings Services
When companies need to finance a growing business or governments need to build a highway, they often turn to the debt markets. To facilitate the flow of capital, Standard & Poor’s Ratings Services brings transparency and compara-bility to debt markets worldwide by helping investors and others measure and manage credit risk through independent ratings, research and analytics.
OUTLOOK
Two trends indicate that S&P is poised for continued long-term growth. First, over the next few years, there is a substantial potential need for funding as companies look to meet debt refinancing needs. S&P estimates that about $9.5 trillion in global rated corporate debt is scheduled to mature from 2016 through the end of 2020. The second and potentially more significant trend is the expansion of debt capital markets in emerging economies. According to one study, by 2030, 36% of global corporate bonds will be issued by companies in emerging markets, compared to the 14% issued in 2014, representing a $47 trillion increase.*
$815
B
AUM IN ETF
sBASED ON
S&P DOW JONES INDICES IN 2015
$597
M
2015 REVENUE
(+8% Increase from 2014)
454
NEW INDICES LAUNCHED
IN 2015
S&P Dow Jones Indices
S&P Dow Jones Indices is the world’s leading provider of financial market indices, and the leading resource for index-based innovation data and research. The flagships S&P 500 and Dow Jones Industrial Average garner the headlines. Less well known is that this business calculates and publishes more than 1 million indices every day, spanning asset classes, geographies, and investment strategies.
OUTLOOK
60+%
OF PLATTS REVENUE
COMES FROM OUTSIDE
THE U.S.
90%
OF PLATTS REVENUE IS
SUBSCRIPTION BASED
CUSTOMERS IN
180
COUNTRIES
Platts
Platts enables global commodities markets to perform with greater transparency and efficiency. It is a leader in energy, petrochemicals, metals, and agriculture informa-tion, and is a premier source of benchmark price assess-ments and analytics for those markets. The business has a strong and expanding international footprint, serving approximately 10,000 customers in more than 180 coun-tries. In fact, Platts is McGraw Hill Financial’s most global business. Platts delivered strong revenue growth in 2015, demonstrating resiliency despite low commodity prices and a steep slide in the price of oil. In fact, in volatile markets, the need for the sort of trusted, independent information Platts provides is as critical as ever.
OUTLOOK
Reconciliation of Non-GAAP Financial Information
The following is provided to supplement certain non-GAAP financial measures discussed in the letter to shareholders and the financial highlights section of this report (pages IFC–5) both as reported (on a GAAP basis) and as adjusted by excluding certain items (non-GAAP) as explained below. This information is provided in order to allow investors to make meaningful comparisons of the Company’s operating performance between periods and to view the Company’s business from the same perspective as Company management. These non-GAAP measures may be different than similar measures used by other companies.
Operating Results by Segment — Reported vs. Performance
Years ended December 31, 2015 and 2014
2015 2014 % Change
(dollars in millions, except per share data)
(unaudited) Reported
Non-GAAP
Adjustments Performance Reported
Non-GAAP
Adjustments Performance Reported Performance
S&P Ratings Services $1,078 $ 68 a $1,146 $ (583) $1,657 e $1,074 N/M 7% S&P Capital IQ and SNL 228 69 b 297 228 9 c 237 —% 25% S&P Dow Jones Indices 392 — 392 347 4 f 351 13% 12% Commodities & Commercial Markets 357 1 c 358 290 16 c 306 23% 17% Segment operating profit 2,055 138 2,192 282 1,686 1,968 N/M 11% Unallocated expense (138) (2) d (139) (169) 16 c (152) (18)% (9)% Operating profit 1,917 136 2,053 113 1,702 1,815 N/M 13%
Interest expense, net 102 — 102 59 — 59 73% 73%
Income before taxes on income 1,815 136 1,951 54 1,702 1,756 N/M 11% Provision for taxes on income 547 48 595 245 336 581 N/M 2% Income (loss) from continuing operations 1,268 88 1,356 (191) 1,366 1,175 N/M 15% Income from discontinued operations — — — 178 (178) — N/M N/M Net income (loss) 1,268 88 1,356 (13) 1,188 1,175 N/M 15% Less: NCI net income — continuing (112) — (112) (102) — (102) 9% 9% Net income (loss) — continuing 1,156 88 1,244 (293) 1,366 1,073 N/M 16%
Net income — discontinued — — — 178 (178) — N/M N/M
Net income (loss) attributable to MHFI $1,156 $ 88 $1,244 $ (115) $1,188 $1,073 N/M 16% Diluted EPS — continuing $ 4.21 $0.32 $ 4.53 $(1.08) $ 4.96 $ 3.88 g N/M 17% Diluted EPS — total $ 4.21 $0.32 $ 4.53 $(0.42) $ 4.30 $ 3.88 g N/M 17%
N/M — not meaningful
Note — Totals presented may not sum across due to rounding.
(a) The twelve months ended December 31, 2015 include legal settlement charges partially offset by a benefit related to insurance recoveries of $54 million and restructuring charges of $13 million.
(b) The twelve months ended December 31, 2015 include costs of $32 million related to identified operating efficiencies primarily related to restructuring and acquisition-related costs of $37 million.
(c) The twelve months ended December 31, 2015 and 2014 include restructuring charges.
(d) The twelve months ended December 31, 2015 include restructuring charges and a gain of $11 million on the sale of our interest in a legacy McGraw Hill Construction investment. (e) The twelve months ended December 31, 2014 includes restructuring charges and legal and regulatory settlements of $1.6 billion.
(f) The twelve months ended December 31, 2014 include professional fees largely related to corporate development activities.
(g) Diluted weighted-average shares outstanding of 276.2 million were used to calculate adjusted diluted EPS for the twelve months ended December 31, 2014. This amount includes securities that had an antidilutive effect to reported diluted EPS due to a loss from continuing operations.
Computation of Free Cash Flow and Free Cash Flow Excluding Certain Items
Years ended December 31, 2015
(dollars in millions)
(unaudited) 2015
Cash provided by operating activities from continuing operations $ 195
Capital expenditures (139)
Dividends and other payments paid to noncontrolling interests (104)
Free cash flow $ (48)
Payment of legal and regulatory settlements 1,624
Legal settlement insurance recoveries (101)
Tax benefit from legal settlements (250)
14
Management’s Discussion and Analysis
44
Consolidated Statements of Income
45
Consolidated Statements of Comprehensive Income
46
Consolidated Balance Sheets
47
Consolidated Statements of Cash Flows
48
Consolidated Statements of Equity
49
Notes to the Consolidated Financial Statements
88
Five Year Financial Review
89
Report of Management
90
Report of Independent Registered Public Accounting Firm
92
Shareholder Information
Management’s Discussion and Analysis of
Financial Condition and Results of Operations
The following Management Discussion and Analysis (“MD&A”) provides a narrative of the results of operations and financial condition of McGraw Hill Financial, Inc. (together with its con-solidated subsidiaries, the “Company,” “we,” “us” or “our”) for the years ended December 31, 2015 and 2014, respectively. The MD&A should be read in conjunction with the consolidated financial statements and accompanying notes included in our Form 10-K for the year ended December 31, 2015, which have been prepared in accordance with accounting principles gener-ally accepted in the U.S. (“U.S. GAAP”).
The MD&A includes the following sections: Overview
Results of Operations
Liquidity and Capital Resources
Reconciliation of Non-GAAP Financial Information Critical Accounting Estimates
Recently Issued or Adopted Accounting Standards
Certain of the statements below are forward-looking statements within the meaning of the Private Securities Litigation Reform Act of 1995. In addition, any projections of future results of operations and cash flows are subject to substantial uncer-tainty. See Forward-Looking Statements on page 42 of this report.
Overview
We are a leading benchmarks and ratings, analytics, data and research provider serving the global capital, commodities and commercial markets. The capital markets include asset manag-ers, investment banks, commercial banks, insurance compa-nies, exchanges, and issuers; the commodities markets include producers, traders and intermediaries within energy, metals, petrochemicals and agriculture; and the commercial markets include professionals and corporate executives within auto-motive, financial services, insurance and marketing / research information services.
Our operations consist of four reportable segments: Standard & Poor’s Ratings Services (“S&P Ratings”), S&P Capital IQ and SNL, S&P Dow Jones Indices (“S&P DJ Indices”) and Commodities & Commercial (“C&C”).
S&P Ratings is an independent provider of credit ratings, research and analytics, offering investors and market partic-ipants information, ratings and benchmarks.
S&P Capital IQ and SNL is a global provider of multi-asset-class data, research and analytical capabilities, which inte-grate cross-asset analytics and desktop services.
S&P DJ Indices is a global index provider that maintains a wide variety of valuation and index benchmarks for invest-ment advisors, wealth managers and institutional investors. C&C consists of business-to-business companies
specializ-ing in commercial and commodities markets that deliver their customers access to high-value information, data, analytic services and pricing and quality benchmarks. As of August 1, 2013, we completed the sale of Aviation Week and the results have been included in C&C’s results through that date.
In the fourth quarter of 2015, we began exploring strategic alternatives for J.D. Power, included in our C&C segment. We committed to and initiated an active program to sell J.D. Power in its current state that we believe is probable in the next year. As a result, we have classified the assets and liabilities of J.D. Power as held for sale in our consolidated balance sheet as of December 31, 2015. The anticipated disposal does not represent a strategic shift that will have a major effect on oper-ations and financial results, therefore, it is not classified as a discontinued operation.
used the after-tax proceeds from the sale to make selective acquisitions, investments, share repurchases and for general corporate purposes.
On March 22, 2013, we completed the sale of McGraw-Hill Education (“MHE”) to investment funds affiliated with Apollo Global Management, LLC for a purchase price of $2.4 billion in cash. We recorded an after-tax gain on the sale of $589 million, which is included in discontinued operations, net in the consoli-dated statement of income for the year ended December 31, 2013. We used the after-tax proceeds from the sale to pay down short-term debt for the special dividend paid in 2012, to make selective acquisitions, investments, share repurchases and for general corporate purposes.
In 2015, we continued to focus on investments in targeted financial assets, divesting selected non-core assets, reducing in our real estate portfolio and increasing shareholder return.
Investments in Targeted Financial Assets /
Divest Selected Non-Core Assets
During 2015, we continued to create a portfolio focused on scalable, industry leading, interrelated businesses in the capital and commodity markets.
S&P Capital IQ and SNL — we acquired SNL Financial LC (“SNL”), a leading provider of news, data, and analytics to five sectors in the global economy: financial institutions, real estate, energy, media & communications, and metals & mining;
Commodities & Commercial:
we acquired the entire issued share capital of Petromedia Ltd and its operating subsidiaries, an independent provider of data, intelligence, news and tools to the global fuels market that offers a suite of products providing clients with actionable data and intelligence that enables informed decisions, minimizes risk and increases efficiency;
we acquired National Automobile Dealers Association’s Used Car Guide, a leading provider of U.S. retail, trade-in and auction used-vehicle valuation products, services and information.
In 2015, we further reduced our real estate footprint by com-pleting the consolidation of our corporate headquarters with our operations in New York City.
During 2014, we continued to execute our strategy of investing for growth in markets that have size and scale while exiting non-core assets.
Commodities & Commercial — we acquired Eclipse Energy Group AS which complements our North American natural gas capabilities, which we obtained from our Bentek Energy LLC acquisition in 2011;
S&P Ratings — we acquired BRC Investor Services S.A., a Colombia-based ratings firm providing risk classifications of banks, financial services providers, insurance companies, corporate bonds and structured issues that will expand our presence in the Latin American credit markets.
In 2014, in addition to the divestiture of McGraw Hill Construction discussed above, we streamlined our infrastructure by reducing our real estate footprint through selling our data facility, initiat-ing the consolidation of our corporate headquarters with our operations in New York City, as well as disposing of our corpo-rate aircraft.
During 2013, we acquired an incremental 11 million equity shares representing 15.07% of CRISIL’s total outstanding equity shares for $214 million, concurrently increasing our ownership percentage in CRISIL to 67.84% from 52.77%.
In 2013, we also completed certain dispositions of our non-core assets that allow us to apply greater focus on our high-growth, high-margin benchmark businesses.
Commodities & Commercial — we completed the sale of Aviation Week to Penton, a privately held business informa-tion company;
S&P Capital IQ and SNL — we completed the sale of Financial Communications as well as the closure of several non-core businesses.
Increased Shareholder Return
KEY RESULTS
Years ended December 31, % Change 1
(in millions) 2015 2014 2013 ’15 vs ’14 ’14 vs ’13
Revenue $ 5,313 $ 5,051 $ 4,702 5% 7%
Operating profit 2 $ 1,917 $ 113 $ 1,358 N/M (92)%
% Operating margin 36% 2% 29%
Diluted earnings (loss) per share from continuing operations $ 4.21 $ (1.08) $ 2.80 N/M N/M
N/M — not meaningful
1 % changes in the tables throughout the MD&A are calculated off of the actual number, not the rounded number presented.
2 2015 includes legal settlements, partially offset by a benefit related to insurance recoveries of $54 million. 2014 includes legal and regulatory settlements of $1.6 billion and 2013 include legal settlements of $77 million.
2015
Revenue increased 5% driven by increases at S&P Capital IQ and SNL, C&C and S&P DJ Indices, partially offset by a decrease at S&P Ratings. Revenue growth at S&P Capital IQ and SNL was due to the acquisition of SNL in September of 2015 and growth of the legacy S&P Capital IQ products driven by increases in average contract values for each product. The revenue increase at C&C was primarily driven by continued demand for Platts’ proprietary content as annualized contract values increased. Increases at J.D. Power primarily due to an increase in auto con-sulting engagements in the U.S. and the acquisition of National Automobile Dealers Association’s Used Car Guide (“UCG”) in July of 2015 driving the data and analytics revenue growth at C&C. Revenue growth at S&P DJ Indices was due to higher average levels of assets under management for ETFs and mutual funds and higher volumes for exchange-traded derivatives. The reve-nue decrease at S&P Ratings was driven by the unfavorable impact of foreign exchange rates. The unfavorable impact of foreign exchange rates reduced revenue by 2 percentage points which was offset by the favorable impact from acquisitions of 2 percentage points.
The increase in operating profit was primarily due to the impact of $1.6 billion in legal and regulatory settlements in 2014 com-pared to net legal settlement expenses of $54 million in 2015. In addition, 2015 includes costs related to identified operating efficiencies primarily related to restructuring of $56 million in 2015 compared to $86 million in 2014. 2015 also includes acquisition-related costs related to the acquisition of SNL of $37 million and an $11 million gain on the sale of our interest in a legacy McGraw Hill Construction investment. 2014 includes $4 million of professional fees largely related to corporate development activities. Excluding these items, operating profit increased 13%. This increase was driven by revenue growth at S&P Capital IQ and SNL, C&C, and S&P DJ Indices and cost containment efforts at S&P Ratings during 2015.
2014
Revenue increased 7% driven by increases at all of our seg-ments. The increase at S&P Ratings was primarily driven by growth in both corporate and financial services bond ratings revenue, increases in bank loan ratings and higher annual fees. Revenue growth at S&P Capital IQ and SNL was driven by increases in average contract values for each product driven by new customer relationships and increases in existing accounts. Revenue growth at S&P DJ Indices was due to higher levels of assets under management for ETFs and mutual funds and higher volumes for exchange-traded derivatives. The revenue increase at C&C was primarily driven by continued demand for Platts’ proprietary content as annualized contract values increased and increases at J.D. Power driven by strong demand for auto consulting engagements in the U.S. and Singapore. The unfavorable impact of foreign exchange rates reduced revenue by less than 1 percentage point.
OUTLOOK
Our vision is to be the leading provider of transparent and inde-pendent benchmarks and ratings, analytics, data and research in the global capital, commodities and corporate markets. Our mission is to promote sustainable growth in these markets by providing customers with essential intelligence and superior service. We seek to accomplish our mission and vision within the framework of our core values of fairness, integrity and transparency. We intend to deliver our products and services through customer-centric distribution channels that enable mission-critical decisions in our core customer sets of invest-ment manageinvest-ment, investinvest-ment banking, commercial banking, insurance, specialty financial institutions and corporates.
We are aligning our efforts against two key strategic priorities: creating growth and driving performance.
Creating Growth
We will strive to drive global growth by focusing on executing our strategic initiatives, strengthening core capabilities and collaborating across businesses.
Driving Performance
We will strive to deliver operational excellence, manage and mitigate risk and enhance leadership and accountability.
There can be no assurance that we will achieve success in implementing any one or more of these strategies as a variety of factors could unfavorably impact operating results, including prolonged difficulties in the global credit markets and a change in the regulatory environment affecting our businesses. See Item 1a, Risk Factors, in our Annual Report on Form 10-K.
Further projections and discussion on our 2016 outlook for our segments can be found within “— Results of Operations”.
Results of Operations
CONSOLIDATED REVIEW
Years ended December 31, % Change
(in millions) 2015 2014 2013 ’15 vs ’14 ’14 vs ’13
Revenue $ 5,313 $ 5,051 $ 4,702 5% 7%
Expenses:
Operating-related expenses 1,672 1,627 1,564 3% 4%
Selling and general expenses 1,578 3,168 1,631 (50)% 94%
Depreciation and amortization 157 134 137 17% (2)%
Total expenses 3,407 4,929 3,332 (31)% 48%
Other (income) loss (11) 9 12 N/M (25)%
Operating profit 1,917 113 1,358 N/M (92)%
Interest expense, net 102 59 59 73% (1)%
Provision for taxes on income 547 245 425 N/M (42)%
Income (loss) from continuing operations 1,268 (191) 874 N/M N/M
Discontinued operations, net — 178 592 N/M (70)%
Less: net income from continuing operations attributable
to noncontrolling interests (112) (102) (91) 9% 12%
Less: net loss from discontinuing operations attributable
to noncontrolling interests — — 1 N/M N/M
Net income (loss) attributable to McGraw Hill Financial, Inc. $ 1,156 $ (115) $ 1,376 N/M N/M
REVENUE
Years ended December 31, % Change
(in millions) 2015 2014 2013 ’15 vs ’14 ’14 vs ’13 Subscription / Non-transaction revenue $3,264 $3,045 $2,849 7% 7% Non-subscription / Transaction revenue $2,049 $2,006 $1,853 2% 8%
Domestic revenue $3,202 $2,911 $2,723 10% 7%
International revenue $2,111 $2,140 $1,979 (1)% 8%
% of total revenue:
Subscription / Non-transaction revenue 61% 60% 61% Non-subscription / Transaction revenue 39% 40% 39%
Domestic revenue 60% 58% 58%
International revenue 40% 42% 42%
2015
Revenue increased 5% as compared to 2014. Subscription / non-transaction revenue increased primarily due to growth at S&P Capital IQ and SNL due to an increase in the average con-tract values as well as continued demand for Platts’ proprietary content. Non-subscription / transaction revenue increased primarily due to growth at S&P DJ Indices due to higher assets under management for ETFs and mutual funds and higher volumes for exchange-traded derivatives, partially offset by a decrease at S&P Ratings which includes the unfavorable impact of foreign exchange rates. See “— Segment Review” below for further information.
The unfavorable impact of foreign exchange rates reduced rev-enue by 2 percentage points. This impact refers to constant currency comparisons estimated by recalculating current year results of foreign operations using the average exchange rate from the prior year. The unfavorable impact of foreign exchange rates on revenue primarily related to S&P Ratings and was driven by the weakening of the Euro to the U.S. dollar.
2014
Revenue increased 7% as compared to 2013. Subscription / non-transaction revenue increased primarily due to growth at S&P Capital IQ and SNL due to an increase in the average contract values, growth in non-issuance related revenue for corporate ratings primarily related to higher annual fees, and continued demand for Platts’ proprietary content. Non-subscription / transaction revenue increased primarily due to strong growth in corporate bond ratings revenue, an increase in bank loan ratings and higher assets under management for ETFs and mutual funds at S&P DJ Indices, partially offset by lower structured finance revenues. See “— Segment Review” below for further information.
TOTAL EXPENSES
The following tables provide an analysis by segment of our operating-related expenses and selling and general expenses for the years ended December 31, 2015 and 2014:
2015 2014 % Change
(in millions)
Operating-related expenses
Selling and general expenses
Operating-related expenses
Selling and general expenses
Operating-related expenses
Selling and general expenses S&P Ratings 1 $ 725 $ 583 $ 777 $2,219 (7)% (74)%
S&P Capital IQ and SNL 2 614 495 549 411 12% 20%
S&P DJ Indices 3 105 92 97 101 8% (8)%
C&C 4 316 269 289 289 9% (7)%
Intersegment eliminations 5 (88) — (86) — (3)% N/M
Total segments 1,672 1,439 1,626 3,020 3% (52)%
Corporate 6 — 139 1 148 (100)% (6)%
$1,672 $1,578 $1,627 $3,168 3% (50)%
N/M — not meaningful
1 In 2015, selling and general expenses include legal settlements partially offset by a benefit related to legal insurance recoveries of $54 million and restructuring costs of $13 million. In 2014, selling and general expenses include $1.6 billion for legal and regulatory settlements and restructuring charges of $45 million. 2 In 2015, selling and general expenses include acquisition-related costs related to the acquisition of SNL of $37 million and costs identified operating efficiencies
primarily related to restructuring of $32 million. In 2014, selling and general expenses include $9 million of restructuring charges.
3 In 2014, selling and general expenses include the impact of professional fees largely related to corporate development activities of $4 million. 4 In 2015 and 2014, selling and general expenses include restructuring charges of $1 million and $16 million, respectively.
5 Intersegment eliminations relates to a royalty charged to S&P Capital IQ and SNL for the rights to use and distribute content and data developed by S&P Ratings. 6 In 2015 and 2014, selling and general expenses include costs related to identified operating efficiencies primarily related to restructuring of $10 million and
$16 million, respectively.
Operating-Related Expenses
Operating-related expenses increased $44 million or 3% as compared to 2014. Increases at S&P Capital IQ and SNL primarily driven by higher data processing costs and the acquisition of SNL in September of 2015 and increases at C&C due to higher incentive costs were partially offset by declines at S&P Ratings driven by our compensation cost containment efforts resulting from 2014 restructuring actions.
Selling and General Expenses
Selling and general expenses decreased 50%. Excluding the favorable net impact of legal settlement and regulatory settle-ment charges and insurance recoveries of 48 percentage points, higher costs recorded in 2014 related to identified operating efficiencies primarily related to restructuring of 1 percentage
point, partially offset by the unfavorable impact of acquisition- related costs related to the acquisition of SNL of 1 percentage point, selling and general expenses decreased 2%. The decline was due to a decrease at S&P Ratings driven by lower incentive and legal costs, partially offset by increased costs related to the implementation of the Dodd-Frank Wall Street Reform and Consumer Protection Act and an increase at S&P Capital IQ and SNL driven by the acquisition of SNL in September of 2015.
Depreciation and Amortization
The following tables provide an analysis by segment of our operating-related expenses and selling and general expenses for the years ended December 31, 2014 and 2013:
2014 2013 % Change
(in millions)
Operating-related expenses
Selling and general expenses
Operating-related expenses
Selling and general expenses
Operating-related expenses
Selling and general expenses S&P Ratings 1 $ 777 $2,219 $ 741 $ 624 5% N/M
S&P Capital IQ and SNL 2 549 411 538 390 2% 5%
S&P DJ Indices 3 97 101 92 126 5% (20)%
C&C 4 289 289 271 278 7% 4%
Intersegment eliminations 5 (86) — (76) — (13)% N/M
Total segments 1,626 3,020 1,566 1,418 4% N/M
Corporate 6 1 148 (2) 213 N/M (30)%
$1,627 $3,168 $1,564 $1,631 4% 94%
N/M — not meaningful
1 In 2014, selling and general expenses include $1.6 billion for legal and regulatory settlements and restructuring charges of $45 million. In 2013, selling and general expenses include $77 million for legal settlements, restructuring charges of $10 million, and the gain on sale of an equity investment held at CRISIL of $16 million. 2 In 2014, selling and general expenses include $9 million of restructuring charges. In 2013, selling and general expenses include restructuring charges of $9 million
and a loss related to the sale of Financial Communications of $3 million.
3 In 2014, selling and general expenses include the impact of professional fees largely related to corporate development activities of $4 million.
4 In 2014, selling and general expenses include restructuring charges of $16 million. In 2013, selling and general expenses include a pre-tax gain on the sale of Aviation Week of $11 million and restructuring charges of $9 million.
5 Intersegment eliminations relates to a royalty charged to S&P Capital IQ and SNL for the rights to use and distribute content and data developed by S&P Ratings. 6 In 2014, selling and general expenses include restructuring charges of $16 million. In 2013, selling and general expenses primarily include $64 million necessary to
enable the separation of MHE and reduce our cost structure, restructuring charges and charges related to our reduction in our real estate portfolio.
Operating-Related Expenses
Operating-related expenses increased $64 million or 4% as compared to 2013, primarily driven by increased costs at S&P Ratings, C&C and S&P Capital IQ and SNL. These increases were primarily attributable to an increase in compensation costs and higher technology costs.
Selling and General Expenses
Selling and general expenses increased 94%. Excluding the unfavorable impact of legal settlement charges of 94 percent-age points and higher costs recorded in 2014 related to iden-tified operating efficiencies primarily related to restructuring of 3 percentage points, partially offset by the favorable impact of costs necessary to enable the separation of MHE and reduce our cost structure recorded in 2013 of 4 percentage points, selling and general expenses increased 1%. The increase was primarily driven by increased legal costs at S&P Ratings, increased commissions and incentives at S&P Capital IQ and SNL, partially offset by a decrease at S&P DJ Indices primarily related to a $26 million non-cash impairment charge recorded in 2013 associated with an intangible asset acquired with the formation of the S&P Dow Jones Indices LLC joint venture.
Depreciation and Amortization
Depreciation and amortization decreased $3 million or 2% as compared to 2013, primarily due to an intangible asset that became fully amortized in 2013.
OTHER (INCOME) LOSS
During 2015, we completed the sale of our interest in a legacy McGraw Hill Construction investment that resulted in a pre-tax gain of $11 million within other (income) loss in the consolidated statement of income.
During 2014, we completed the following transactions that resulted in a pre-tax loss of $9 million within other (income) loss in the consolidated statement of income:
as a result of the pending sale. See Note 13 — Related Party Transactions to our consolidated financial statements for fur-ther discussion.
On June 30, 2014, we completed the sale of our data center to Quality Technology Services, LLC (“QTS”) which owns, oper-ates, and manages data centers. Net proceeds from the sale of $58 million were received in July of 2014. The sale includes all of the facilities and equipment on the south campus of our East Windsor, New Jersey location, inclusive of the rights and obligations associated with an adjoining solar power field. The sale resulted in an expense of $3 million recorded within other (income) loss in our consolidated statement of income, which is in addition to the non-cash impairment charge we recorded in the fourth quarter of 2013.
During 2013, we recorded a net pre-tax loss of $12 million within other (income) loss in the consolidated statement of income:
During the fourth quarter of 2013, we recognized a non-cash impairment charge of $36 million related to the pending sale of our data center.
On September 30, 2013, we completed the sale of Financial Communications, which was part of our S&P Capital IQ and SNL segment.
On August 27, 2013, CRISIL sold its 49% equity interest in India Index Services & Products Ltd. This investment was held within our S&P Ratings segment.
On August 1, 2013, we completed the sale of Aviation Week within our C&C segment to Penton, a privately held business information company.
OPERATING PROFIT
We consider operating profit to be an important measure for evaluating our operating performance and we evaluate operat-ing profit for each of the reportable business segments in which we operate.
We internally manage our operations by reference to “segment operating profit” with economic resources allocated primarily based on segment operating profit. Segment operating profit is defined as operating profit before unallocated expense. Segment operating profit is one of the key metrics we use to evaluate operating performance. Segment operating profit is not, however, a measure of financial performance under U.S. GAAP, and may not be defined and calculated by other compa-nies in the same manner.
The table below reconciles segment operating profit to total operating profit:
Years ended December 31, % Change
(in millions) 2015 2014 2013 ’15 vs ’14 ’14 vs ’13
S&P Ratings 1 $ 1,078 $ (583) $ 882 N/M N/M
S&P Capital IQ and SNL 2 228 228 189 —% 21%
S&P DJ Indices 3 392 347 266 13% 30%
C&C 4 357 290 280 23% 3%
Total segment operating profit 2,055 282 1,617 N/M (83)%
Unallocated expense 5 (138) (169) (259) (18)% (35)%
Total operating profit $ 1,917 $ 113 $ 1,358 N/M (92)%
N/M — not meaningful
1 2015 includes legal settlements, partially offset by a benefit related to insurance recoveries of $54 million, and restructuring charges of $13 million. 2014 includes legal and regulatory settlements of $1.6 billion and restructuring charges of $45 million. 2013 includes legal settlements of $77 million, restructuring charges of $10 million, and the gain on sale of an equity investment held at CRISIL of $16 million.
2 2015 includes acquisition-related costs related to the acquisition of SNL of $37 million and costs identified operating efficiencies primarily related to restructuring of $32 million. 2014 includes $9 million of restructuring charges. 2013 includes restructuring charges of $9 million and a loss related to the sale of Financial Communications of $3 million.
3 2014 includes the impact of professional fees largely related to corporate development activities of $4 million.
4 2015 and 2014 include restructuring charges of $1 million and $16 million, respectively. 2013 includes a pre-tax gain on the sale of Aviation Week of $11 million and restructuring charges of $9 million.
2015
SEGMENT OPERATING PROFIT — Increased $1.8 billion, or 629% as compared to 2014. 2015 includes legal settlement charges partially offset by a benefit related to insurance recoveries of $54 million compared to legal and regulatory settlement charges of $1.6 billion in 2014. Excluding the favorable net impact of lower legal and regulatory settlement charges and insurance recoveries of 621 percentage points, higher costs recorded in 2014 related to identified operating efficiencies primarily related to restructuring of 9 percentage points and the impact of professional fees largely related to corporate development activities recorded in 2014 of 2 percentage points, partially offset by the unfavorable impact of acquisition-related costs related to the acquisition of SNL of 15 percentage points, segment operating profit increased 11%. Revenue growth at S&P Capital IQ and SNL, C&C and S&P DJ Indices, and cost containment efforts at S&P Ratings during 2015 were the primary drivers for the increase. See “— Segment Review” below for further information.
UNALLOCATED EXPENSE — Decreased by $31 million or 18% as compared to 2014. These expenses, included in selling and gen-eral expenses, mainly include costs for corporate center func-tions, select initiatives, unoccupied office space and corporate overhead costs allocable to discontinued operations. Excluding the favorable impact of the sale of our interest in a legacy McGraw Hill Construction investment of 6 percentage points and higher costs recorded in 2014 related to identified operat-ing efficiencies primarily related to restructuroperat-ing of 4 percent-age points, unallocated expense decreased by 9 percentpercent-age points as compared to 2014. This decrease was primarily driven by the impact of a $9 million loss recorded in the second quarter of 2014 related to the sale of the Company’s aircraft and the sale of our data center.
Foreign currency exchange rates had a negligible impact on operating profit. The foreign exchange rate impact refers to constant currency comparisons and the remeasurement of monetary assets and liabilities. Constant currency impacts are estimated by recalculating current year results of foreign oper-ations using the average exchange rate from the prior year. Remeasurement impacts are based on the variance between current-year and prior-year foreign exchange rate fluctuations on monetary assets and liabilities denominated in currencies other than the individual business’ functional currency.
2014
SEGMENT OPERATING PROFIT — Decreased $1.3 billion, or 83% as compared to 2013. Excluding the unfavorable impact of legal and regulatory settlement charges of 94 percentage points, higher restructuring charges recorded in 2014 of 3 percentage points, and a net gain related to the sale of an equity investment at CRISIL, Aviation Week and Financial Communications in 2013 of 2 percentage points, operating profit increased 16%. This increase was primarily due to strong revenue growth at S&P Ratings, S&P Capital IQ and SNL, S&P DJ Indices and C&C. See “— Segment Review” below for further information.
UNALLOCATED EXPENSE — Decreased by $90 million or 35% as compared to 2013. Excluding the favorable impact of costs necessary to enable the separation of MHE and reduce our cost structure recorded in 2013 of 27 percentage points, a loss related to the sale of a data center in 2013 of 15 percentage points, and charges related to a reduction in our real estate portfolio in 2013 of 5 percentage points, partially offset by the unfavorable impact of higher restructuring charges recorded in 2014 of 5 percentage points, unallocated expense increased 7%. This increase was primarily driven by the impact of a $9 million loss recorded in the second quarter of 2014 related to the sale of the Company’s aircraft and the sale of our data center, and an increase in unoccupied office space.
Foreign exchange rates had a favorable impact on operating profit of 2 percentage points. The favorable impact on 2014 was driven by the devaluation of the Argentinian peso as well as early strength of the British pound.
INTEREST EXPENSE, NET
Net interest expense for 2015 increased 73% as compared to 2014, primarily as a result of higher interest expense related to the $700 million of senior notes issued in the second quarter of 2015 and the $2.0 billion of senior notes issued in the third quarter of 2015. Net interest expense for 2014 remained rela-tively flat as compared to 2013, decreasing 1%.
PROVISION FOR INCOME TAXES
States, and continuing resolution of prior year tax audits. The increase in the 2014 effective tax rate from the prior year period was primarily due to the expected tax treatment of charges for legal settlements in 2014.
DISCONTINUED OPERATIONS, NET
Income from discontinued operations was $178 million in 2014 as compared to $592 million in 2013, primarily as a result of the after-tax gains of $160 million and $589 million recorded on the sale of McGraw Hill Construction in 2014 and the sale of MHE in 2013, respectively.
Segment Review
STANDARD & POOR’S RATINGS SERVICES
Credit ratings are one of several tools that investors can use when making decisions about purchasing bonds and other fixed income investments. They are opinions about credit risk and our ratings express our opinion about the ability and willingness of an issuer, such as a corporation or state or city government, to meet its financial obligations in full and on time. Our credit ratings can also relate to the credit quality of an individual debt issue, such as a corporate or municipal bond, and the relative likelihood that the issuer may default.
S&P Ratings differentiates its revenue between transaction and non-transaction. Transaction revenue primarily includes fees associated with:
ratings related to new issuance of corporate and government debt instruments, and structured finance debt instruments; bank loan ratings; and
corporate credit estimates, which are intended, based on an abbreviated analysis, to provide an indication of our opinion regard-ing creditworthiness of a company which does not currently have an S&P Ratregard-ings credit ratregard-ing.
Non-transaction revenue primarily includes fees for surveillance of a credit rating, annual fees for customer relationship-based pricing programs, fees for entity credit ratings and global research and analytics. Non-transaction revenue also includes an intersegment royalty charged to S&P Capital IQ and SNL for the rights to use and distribute content and data developed by S&P Ratings. Royalty revenue for 2015, 2014 and 2013 was $83 million, $77 million and $72 million, respectively.
Years ended December 31, % Change
(in millions) 2015 2014 2013 ’15 vs ’14 ’14 vs ’13 Revenue:
Transaction $ 1,109 $ 1,129 $ 1,035 (2)% 9%
Non-transaction 1,319 1,326 1,239 —% 7%
Total revenue $ 2,428 $ 2,455 $ 2,274 (1)% 8%
% of total revenue:
Transaction 46% 46% 46%
Non-transaction 54% 54% 54%
Domestic revenue $ 1,390 $ 1,305 $ 1,214 7% 8%
International revenue $ 1,038 $ 1,150 $ 1,060 (10)% 8% % of total revenue:
Domestic revenue 57% 53% 53%
International revenue 43% 47% 47%
Operating profit (loss) 1 $ 1,078 $ (583) $ 882 N/M N/M
% Operating margin 44% (24)% 39%
N/M — not meaningful
2015
Revenue decreased 1%, which includes the unfavorable impact of foreign exchange rates that reduced revenue by 4 percentage points. Excluding the unfavorable impact of foreign exchange rates, transaction revenue increased primarily due to an increase in U.S. Public Finance issuance, partially offset by a decline in structured finance revenue driven by reduced global market issuance. Excluding the unfavorable impact of foreign exchange rates, non-transaction revenue also increased due to growth in surveillance revenues and additional Ratings Evalua-tion Service activity, partially offset by lower revenue associ-ated with new client relationships.
Operating profit increased 285%. Excluding the favorable net impact of legal and regulatory settlement charges and insur-ance recoveries of 273 percentage points and net higher restructuring costs recorded in 2014 of 6 percentage points, operating profit increased 7%. Foreign currency exchange rates had an unfavorable impact of 1 percentage point on the operat-ing profit growth of 7%. This increase was driven by decreased compensation costs primarily driven by lower incentive costs and cost containment resulting from 2014 restructuring actions and reduced legal fees following the resolution of a number of significant legal matters, partially offset by increased costs related to the implementation of the Dodd-Frank Wall Street Reform of the Consumer Protection Act and the decrease in revenue discussed above.
2014
Revenue increased 8% driven by growth in both transaction and non-transaction revenue. Transaction revenue increased in 2014 primarily driven by growth in both corporate and financial services bond ratings revenue with strong growth in all regions and an increase in bank loan ratings revenue, partially offset by a decline in structured finance revenues. Non-transaction revenue increased primarily due to an increase in annual fees, increases in global research and analytics services and increased RES activity.
Operating profit decreased 166%. Excluding the unfavorable impact of legal and regulatory settlements of 173 percentage points, the unfavorable impact of higher restructuring charges recorded in 2014 of 4 percentage points, and the unfavorable impact of the gain on sale of an equity investment held at CRISIL in 2013 of 2 percentage points, operating profit increased 13%. This increase was driven by the increase in revenue and the favorable impact of foreign exchange rates of 2 percentage points, partially offset by higher legal defense costs primarily
driven by increased litigation activity including the Department of Justice case.
Issuance Volumes
We monitor issuance volumes as an indicator of trends in trans-action revenue streams within S&P Ratings. Issuance volumes noted within the discussion that follows are based on the domi-cile of the issuer. Issuance volumes can be reported in two ways: by “domicile”, which is based on where an issuer is located or where the assets associated with an issue are located, or based on “marketplace”, which is where the bonds are sold. The follow-ing tables depict changes in issuance levels as compared to the prior year, based on Thomson Financial, Harrison Scott Publications, Dealogic and S&P Rating’s internal estimates.
2015 Compared to
2014 Corporate Bond Issuance U.S. Europe High-Yield Issuance (13)% (30)%
Investment Grade 20% (21)%
Total New Issue Dollars — Corporate Issuance 12% (22)%
Although the number of issuances were down, par value of corporate issuance in the U.S. was up in 2015 driven by an increase in investment-grade debt issuance reflecting high par value deals, as the number of deals was lower in the first nine months of the year. Strong M&A activity was a major driver of large financing transactions that resulted in increased issuance in the first nine months of the year. Investment-grade debt issuance was negatively impacted in the fourth quarter of 2015 as market volatility increased. The increase in U.S. investment-grade debt issuance was partially offset by weakness in U.S. high-yield debt issuance.
Corporate issuance in Europe for both investment-grade and high-yield decreased in 2015 as a result of economic and political uncertainty in the European markets.
2015 Compared to
2014 Structured Finance U.S. Europe Asset-Backed Securities (“ABS”) (10)% (22)% Collateralized Debt Obligations (“CDO”) (22)% (15)% Commercial Mortgage-Backed Securities (“CMBS”) 7% 14% Residential Mortgage-Backed Securities (“RMBS”) 45% 25%
Covered Bonds * 28%
Total New Issue Dollars — Structured Finance (6)% 13%