Growth and Normal Puberty
Val Abbassi, MD
ABSTRACT. We reviewed the growth characteristics of American boys and girls from published studies, includ-ing age at takeoff, age at peak height velocity, peak height velocity, duration of puberty, and the magnitude of the pubertal contribution to adult height. Age at off is highly variable and sex-dependent. The mean take-off age in children growing at an average rate is ;11 years in boys and 9 years in girls, and peak height veloc-ity occurs at a mean age of 13.5 years and 11.5 years, respectively, in these children. Whole-year peak height velocity is 9.5 cm/y in boys and 8.3 cm/y in girls, with slight variations in the different studies. The contribu-tion of pubertal growth to final height is;30 to 31 cm in boys, accounting for 17% to 18% of the final height, and 27.5 to 29 cm in girls, accounting for 17% of the final height. The magnitude of pubertal growth has a negative correlation with age at takeoff, but no correlation with final height. Age at takeoff, however, correlates highly with pubertal stage, but correlates negatively with dura-tion of puberty. Pediatrics 1998;102:507–511; puberty, growth, growth velocity, peak height velocity.
ABBREVIATIONS. HES, Health Examination Survey; SD, stan-dard deviation.
P
uberty is a significant physiologic event in hu-man growth and biologic maturation. It begins with the activation of the hypothalamic– pituitary– gonadal axis and ends with the attainment of reproductive capability and the acquisition of adult body composition and habitus.1 The pubertal growth spurt and the appearance of secondary sex characteristics are the most visible manifestations of puberty. It is the lack of one or both of these that brings most teenagers to a pediatric endocrine clinic. Typically, pubertal growth consists of a phase of acceleration, followed by a phase of deceleration, and the eventual cessation of growth with the closure of epiphyses.The pubertal growth characteristics that can be quantified and analyzed mathematically include age at takeoff (ie, the onset of growth acceleration), age at peak height velocity, peak height velocity, duration of puberty, and the contribution of the pubertal growth spurt to final adult height.
METHODS
We reviewed three types of growth studies: longitudinal from birth to maturity, longitudinal during puberty, and cross-sectional.
The longitudinal growth studies that we reviewed included the Fels Research Institute studies, the Denver Child Research Council studies, the Harvard School of Public Health study, and the Guid-ance Study of the University of California at Berkeley.2Another
longitudinal study, the Harvard Six-cities Study, was designed primarily to study the effects of indoor and outdoor pollution on the health of children.3 During this study, height and weight
measurements were obtained annually in children 6 to 17 years of age. A substantial number of children were enrolled in this study from six cities in the states of Kansas, Massachusetts, Minnesota, Missouri, Ohio, and Tennessee; these children were considered to be representative of the population of youth in the United States. The other longitudinal studies during puberty were those of Lee4
and Biro et al.5
The US cross-sectional studies that we reviewed and used as the primary sources of the longitudinal and velocity growth charts in this article were the Health Examination Survey (HES) cycle II, which measured thousands of children 6 to 11 years of age, during the period 1963 to 1965; HES cycle III, which measured children 12 to 17 years of age, from 1966 to 1970; and Health and Nutrition Examination Survey I, which measured children 1 to 17 years of age, from 1971 to 1974.6The standard growth charts in this article
were constructed from data from the last-named study, supple-mented by data from HES cycles II and III. The velocity growth charts were constructed by Tanner and Davies7from data from
cross-sectional studies of the National Center for Health Statistics reported by Hamill and associates.6
RESULTS
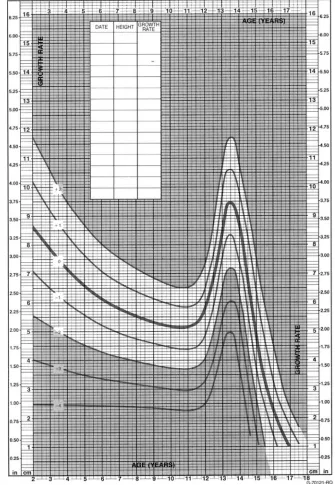
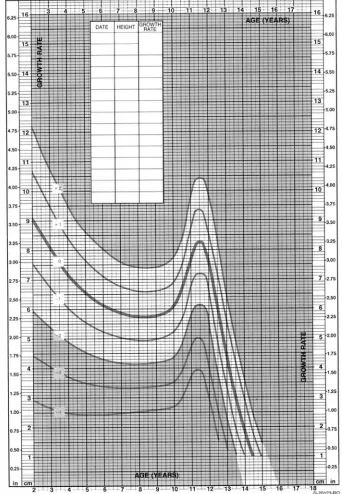
National Center for Health Statistics data from cross-sectional growth studies reported by Hamill and associates6that pertain to pubertal age for boys and girls are shown in Table 1. These data were used by Tanner and Davies to construct growth-velocity charts for US children.7Some of the pubertal growth data from the four US longitudinal studies, reported by Thissen and colleagues,2are summarized in Table 2. Pubertal growth data from the Harvard Six-cities Study, reported by Berkey and coworkers,3are pre-sented in Table 3 along with data from the Harp-enden longitudinal growth study.8The median val-ues for height and whole-year height velocities in boys and girls 7 to 18 years of age are shown in Table 4, from the Harvard Six-cities Study,3and in Table 5, from Tanner and Davies.7Growth-velocity curves for US children are shown in Fig 1.
DISCUSSION
The pubertal growth characteristics evaluated in various studies include age at takeoff, height at take-off, age at peak height velocity, peak height velocity, duration of puberty, and the contribution of the pu-bertal height gain to final height.
Age at takeoff is sex-dependent and also quite variable even in the same sex. In general, the age at takeoff is 2 years younger in girls. The age at takeoff could not be determined for the girls in HES cycle III, which examined youths 12 to 17 years of age, be-cause of the cross-sectional nature of the study and
From the Department of Pediatric Endocrinology and Metabolism, George-town University Children’s Medical Center, Washington, DC.
This work was presented in part at the National Cooperative Growth Study Eleventh Annual Investigators Meeting, September 25–28, 1997, Washing-ton, DC.
Received for publication Feb 6, 1998; accepted Mar 20, 1998.
the fact that many of the girls already were in pu-berty.9However, the mean ages at various stages of puberty in the boys in this study10were similar to the mean ages reported by Tanner and Whitehouse in British children.11 In HES cycle III, there was no difference in various stages of pubertal development between black boys and white boys.10 Black girls, however, were consistently more advanced in puber-tal stage than were white girls.9The ages at takeoff in the white boys (10.45 6 1.47 years) and the white girls (9.25 6 1.15 years) in the Harvard Six-cities Study were ;1.5 years (boys) and 1 year (girls) less than those in the British children in the Harpenden study, all of whom were white (Table 3). It should be noted that the data in Table 3 do not include data on black children. In the Harvard Six-cities Study, as in HES cycle III, there was a significant difference be-tween black girls and white girls at every stage of pubertal development.3
The age at peak height velocity was;13 years in
boys and 11 years in girls in the four US longitu-dinal studies.2 The boys and girls in the Harvard Six-cities Study were 0.5 year older at takeoff than the boys and girls in the four US longitudinal studies, but 0.5 year younger than those in the Harpenden study (Table 4). The standard devia-tion (SD) for age at peak height velocity is slightly less than 1 year. In boys maturing 2 SD units early
TABLE 1. Heights of US Boys and Girls
Age (y) Height (cm)
Boys Girls
Mean Median Mean Median
9 131.6 133.8 133.2 133.2
10 138.8 139.3 138.5 139.2
11 143.4 143.8 144.0 143.7
12 149.9 149.4 151.9 152.0
13 154.2 154.5 157.1 157.6
14 164.2 165.2 159.1 159.5
15 167.8 168.7 161.5 160.0
16 173.2 173.3 163.8 164.9
17 176.8 177.3 161.4 160.5
18 177.0 176.2 — —
Data from Hamill et al.6
TABLE 2. Pubertal Growth Characteristics in Four US Longitudinal Studies
University of California at Berkeley Denver Child Research Council Fels Research Institute
Harvard School of Public Health
Girls
Age at peak height velocity (y) 11.01 (0.83) 11.01 (0.91) 10.96 (0.80) 11.13 (0.87) Height at takeoff (cm) 141.79 (7.60) 137.25 (6.64) 138.57 (7.44) 140.33 (7.19) Adult height (cm) 168.12 (6.23) 168.23 (6.69) 168.02 (5.15) 165.75 (5.07) Pubertal gain (cm) 26.33 (5.69) 30.98 (4.04) 29.45 (6.80) 25.43 (5.64) Boys
Age at peak height velocity (y) 13.06 (1.08) 13.31 (1.08) 12.99 (0.93) 12.90 (0.94) Height at takeoff (cm) 150.60 (6.98) 149.42 (7.14) 149.95 (7.03) 147.39 (5.72) Adult height (cm) 180.74 (6.58) 180.40 (5.41) 180.85 (5.79) 175.56 (6.11) Pubertal gain (cm) 30.14 (5.43) 30.98 (4.66) 30.90 (4.34) 28.17 (5.51)
Values are mean (SD). Data from Thissen et al.2
TABLE 3. Pubertal Growth Characteristics for European, White American, and British Children
Boys Girls
American European and British American European and British
Age at takeoff (y) 10.45 (1.47) 12.05 (0.85) 9.25 (1.15) 10.30 (0.95) Height at takeoff (cm) 144.00 (—) 146.09 (6.33) 138.00 (—) 137.91 (7.02) Age at peak height velocity (y) 13.57 (1.11) 13.91 (0.84) 11.49 (1.17) 11.89 (0.90) Peak height velocity (cm/y) 9.49 (1.44) 8.80 (1.05) 8.14 (1.25) 8.13 (0.78) Final adult height (cm) 177.00 (—) 173.64 (6.11) 163.00 (—) 163.16 (5.94) Puberal height gain (cm) 33.00 (—) 27.56 (3.54) 25.00 (—) 25.25 (4.14)
Data are mean (SD). Data from Berkey et al3(American) and Tanner and Whitehouse8(European and British).
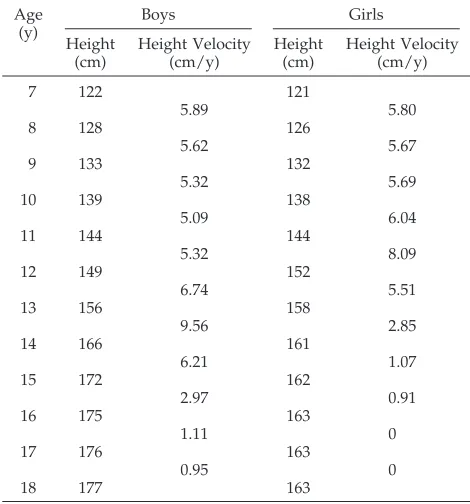
TABLE 4. Fiftieth Percentile Values for Heights and Whole-year Height Velocities in White Boys and Girls With Peak Height Velocities at Typical Age (13 and 11 Years, Respectively)
Age (y) Boys Girls Height (cm) Height Velocity (cm/y) Height (cm) Height Velocity (cm/y)
7 122 121
5.89 5.80
8 128 126
5.62 5.67
9 133 132
5.32 5.69
10 139 138
5.09 6.04
11 144 144
5.32 8.09
12 149 152
6.74 5.51
13 156 158
9.56 2.85
14 166 161
6.21 1.07
15 172 162
2.97 0.91
16 175 163
1.11 0
17 176 163
0.95 0
18 177 163
and 2 SD units late, the age at takeoff ranges from 11.7 to 15.3 years. The corresponding range in girls is 9.7 to 13.3 years.1
Peak height velocity is both age- and sex-depen-dent. It occurs earlier in girls, between Tanner breast stages 2 and 3, and later in boys, between Tanner testis stages 3 and 4. The peak height velocity in average-growing boys with an average age of matu-rity is 9.5 cm/y and in girls is 8.3 cm/y. The peak height velocity in American boys is 0.7 cm/y greater than that in their British counterparts; there is no difference between American and British girls in peak height velocity. The peak height velocity is highest in early-maturing children and lowest in late-maturing children.7
The duration of puberty is quite variable, owing to considerable variation in the onset of puberty.
Ac-cording to Marshall and Tanner, however, this vari-ation does not reach statistical significance.12,13 In other words, early maturers do not pass through the pubertal stages more rapidly than late maturers. In addition, final height is not affected.14 In US cross-sectional studies, boys with a mean takeoff age of 11 years reached their final heights by 17 years of age, and girls with a mean takeoff age of 9 years reached their final heights by 14 years of age.6The difference in the age at the onset of puberty, which provides boys with two additional years of prepubertal growth, accounts for the greater final height of boys (by 10 to 12 cm).
The magnitude of the pubertal contribution to fi-nal adult height is remarkably similar in the four US longitudinal studies (Table 2). The boys in the Har-vard School of Public Health study were the shortest Fig 1.Mean and SD height
as adults; however, their pubertal height gain was slightly greater. The girls in this study were shorter at takeoff by 1 cm and had a pubertal height gain of ;1 cm less than that of the girls in the Guidance Study of the University of California at Berkeley and 4.5 cm less than that of the girls in the Fels Research Institute and Denver Child Research studies. The greatest pubertal height gain in boys in all the stud-ies reviewed here was in the Harvard Six-citstud-ies Study (33 cm); in the girls in this study, however, the gain was the lowest (25 cm). The final heights of both the boys and the girls in the Harvard Six-cities Study were less than those in the four US longitudinal studies.
In the Harpenden study, there was a significant correlation between the age at takeoff and the age at
Tanner testis stage 2 or breast stage 2 and pubic hair stage 2.8The age at peak height velocity also corre-lated significantly with the age at these stages. There was no correlation between takeoff height or adult height and the pubertal height gain. There was a significant negative correlation between age at take-off and pubertal height gain.
examined. The dynamics of pubertal growth are best represented by height-velocity charts rather than by standard charts. Longitudinal, rather than cross-sec-tional, growth data are necessary for constructing height-velocity charts. Lacking such longitudinal growth data, Tanner and Davies7used cross-sectional data reported by Hamill and associates6as well as data from various European studies to construct growth-velocity charts for American boys and girls (Fig 1). These data also are presented in Table 5 and may be compared with corresponding data from the Harvard Six-cities Study presented in Table 4. The data from both sources, in particular the whole-year height veloc-ities, are almost identical, for boys and girls alike. Therefore, these growth charts are suitable for current use.
Clinical use of these growth-velocity charts re-quires calculating the child’s growth velocity and knowing his or her pubertal status. In calculating growth velocity, the increment between two mea-surements should be not ,0.85 year and not .1.15 years. Velocities calculated over shorter periods can reflect only seasonal effects.
SUMMARY
Normal pubertal growth is characterized by accel-eration, decelaccel-eration, and cessation. The age at take-off (acceleration) is highly variable and sex-depen-dent, occurring at a mean age of 11 years in boys and 9 years in girls. A racial difference exists between black girls and white girls. Peak height velocity oc-curs at a mean age of 13.5 years in boys and 11.5 years in girls.
Peak height velocity is;9.5 cm/y in boys and 8.3 cm/y in girls. Pubertal height gain averages 31 cm in boys and 29 cm in girls. Age at takeoff has a negative correlation with pubertal height gain, but no corre-lation with final adult height. There is no correcorre-lation between peak height velocity and final height or the magnitude of the pubertal height gain and final height.
REFERENCES
1. Marshall WA, Tanner JM. Puberty. In: Falkner F, Tanner JM, eds.
Human Growth. II. Postnatal Growth. New York, NY: Plenum Press; 1986:171–209
2. Thissen DR, Bock D, Wainer H, Roche AF. Individual growth in stature: a comparison of four growth studies in the USA.Ann Hum Biol.1976; 3:529 –542
3. Berkey CS, Dockery DW, Wang X, Wypij D, Ferris B Jr. Longitudinal height velocity standards for US adolescents.Stat Med. 1993;12:403– 414 4. Lee PA. Normal ages of pubertal events among American males and
females.J Adolesc Health Care. 1980;1:26 –29
5. Biro FM, Lucky AW, Huster GA, Morrison JA. Pubertal staging in boys.
J Pediatr. 1995;127:100 –102
6. Hamill PV, Terence AD, Johnson CL. NCHS growth curves for children birth–18 years.Vital Health Stat [11]. 1977;165:1–74
7. Tanner JM, Davies PSW. Clinical longitudinal standards for height and height velocity for North American children.J Pediatr. 1985;107: 317–329
8. Tanner JM, Whitehouse RH. The adolescent growth spurt of boys and girls of the Harpenden Growth Study.Ann Hum Biol. 1976;3: 109 –126
9. Harlan WR, Harlan EA, Grillo GP. Secondary sex characteristics of girls 12 to 17 years of age: the US Health Examination Survey.J Pediatr. 1980;96:1074 –1078
10. Harlan WR, Harlan EA, Grillo GP. Secondary sex characteristics of boys 12 to 17 years of age: the US Health Examination Survey.J Pediatr. 1979;95:293–297
11. Tanner JM, Whitehouse RH. Clinical longitudinal standards for height, weight, height velocity, weight velocity, and stages of puberty.Arch Dis Child. 1976;51:170 –179
12. Marshall WA, Tanner JM. Variations in the pattern of pubertal changes in boys.Arch Dis Child. 1970;45:13–23
13. Marshall WA, Tanner JM. Variations in the pattern of pubertal changes in girls.Arch Dis Child. 1969;44:291–303
14. Tanner JM. Issues and advances in adolescent growth and develop-ment.J Adolesc Health Care. 1987;8:470 – 478
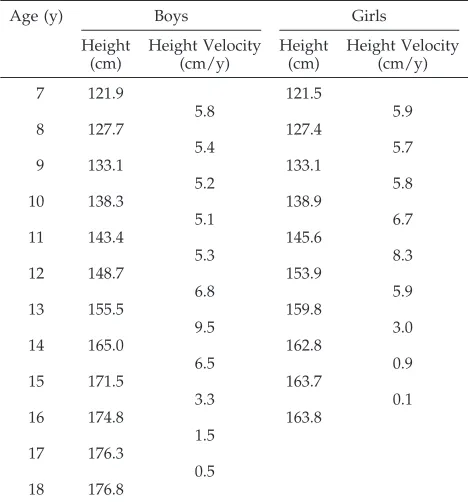
TABLE 5. Fiftieth Percentile Values for Heights and Whole-year Height Velocities in Boys and Girls with Peak Height Veloc-ities at Average Age (13.5 and 11.5 Years, Respectively)
Age (y) Boys Girls
Height (cm) Height Velocity (cm/y) Height (cm) Height Velocity (cm/y)
7 121.9 121.5
5.8 5.9
8 127.7 127.4
5.4 5.7
9 133.1 133.1
5.2 5.8
10 138.3 138.9
5.1 6.7
11 143.4 145.6
5.3 8.3
12 148.7 153.9
6.8 5.9
13 155.5 159.8
9.5 3.0
14 165.0 162.8
6.5 0.9
15 171.5 163.7
3.3 0.1
16 174.8 163.8
1.5 17 176.3
0.5 18 176.8
1998;102;507
Pediatrics
Val Abbassi
Growth and Normal Puberty
Services
Updated Information &
http://pediatrics.aappublications.org/content/102/Supplement_3/507 including high resolution figures, can be found at:
References
BIBL
http://pediatrics.aappublications.org/content/102/Supplement_3/507# This article cites 12 articles, 3 of which you can access for free at:
Subspecialty Collections
http://www.aappublications.org/cgi/collection/puberty_sub
Puberty
http://www.aappublications.org/cgi/collection/endocrinology_sub
Endocrinology
milestones_sub
http://www.aappublications.org/cgi/collection/growth:development_
Growth/Development Milestones
atistics_sub
http://www.aappublications.org/cgi/collection/research_methods_-_st
Research Methods & Statistics
following collection(s):
This article, along with others on similar topics, appears in the
Permissions & Licensing
http://www.aappublications.org/site/misc/Permissions.xhtml in its entirety can be found online at:
Information about reproducing this article in parts (figures, tables) or
Reprints
1998;102;507
Pediatrics
Val Abbassi
Growth and Normal Puberty
http://pediatrics.aappublications.org/content/102/Supplement_3/507
located on the World Wide Web at:
The online version of this article, along with updated information and services, is
by the American Academy of Pediatrics. All rights reserved. Print ISSN: 1073-0397.