EXPERIMENTAL INVESTIGATIONS
ON MRR AND SURFACE ROUGHNESS
OF EN 19 & SS 420 STEELS IN
WIRE-EDM USING TAGUCHI METHOD
C. BHASKAR REDDY* V. DIWAKAR REDDY C. ESWARA REDDY
Ph.D. Scholar Associate Professor Professor Department of Mechanical Engineering, Sri Venkateswara University
TIRUPATI – 517 502, INDIA. e-mail : [email protected] ABSTRACT
Quality and sophistication of the parts / products are the main requirements of the customer in the present global market. Therefore, the manufacturing / Production industries are searching for un-conventional machining processes to achieve production requirements. One among such production processes is the Wire-EDM. As such, a solemn attempt is made in this paper to investigate the response parameters, viz., Material Removal Rate (MRR) and Surface Roughness (Ra) a by experimentation on EN 19 & AISI 420 (SS420) Steels in Wire-EDM process. The Design of experiments is carried-out considering Taguchi Technique with four input parameters, namely, pulse-on, pulse-off, Bed speed and Current. The experiments are conducted considering the above two materials for L16 and then the impact of each parameter is estimated by ANOAVA. Then the
regression analysis is carried-out to find the trend of the response of each material. A comparison made between the two materials indicates that the EN 19 Material is more suitable for better MRR and AISI 420 for better Surface finish.
Key Words: Wire-EDM, Taguchi Technique, MRR, Ra, EN19, SS420, Experimental Parametric Values, Regression Analysis.
1. INTRODUCTION
Wire-EDM is one of the most popular techniques of the Unconventional Production / Manufacturing processes in the present global manufacturing scenario. The Wire-EDM utilises the wire which acts as a tool upon passing the current so as to erode the work material by the generation of spark(s) between the work and tool. The work and the tool are immersed in a die-electric fluid and then allowed to pass through to remove the material by erosion and such machining helps to produce parts with good surface quality and dimensional accuracy. The experimental investigation on P20 Die - Tool Steel reveals that the current applied and pulse-on and pulse-off duration influence the out-put of MRR and Surface Quality, [Bhaskar Reddy et al. (2102)]. The other important capabilities of wire-EDM in production of parts are: (i) micro-level accuracy [Ravindra et al. (2008)], (ii) improved productivity, [Nixon and Ravindra (2011)] and in the reduction of cutting speeds in machining AlSI7 Mg / Al2O3 Steels. Thus, in the present paper, the experiments are conducted on two different
AISI steels materials to estimate the MRR and quality surface. Effect of two machining methods and dry and wet EDM and surface integrity and the effect of pulse current and gap voltage on surface roughness during wet and dry wire EDM of stainless steel are investigated, [Abdul Kareem, et al. (2011)]. As such, theWire-EDM is gaining importance in the present modern manufacturing industry to meet the not only the customer demand but also at the Global level. Therefore, the present work is taken-up to conduct experiments on two different materials.
2. LITERARTURE REVIEW AND OBJECTIVE
The wire EDM is extended to investigate the effects of input parameters of Alloy materials like (i) Nimonic (C 263) material with uncoated brass wire of 0.25 mm diameter as electrode, [Niladri, et al. (2010)]; Titanium Alloy (Ti 6 Al 4v), [Danial Ghodsiyeh, et al. (2012)] and (iii) Nimonic 80A with Brass wire as tool electrode, [Goswami and Jatinder (2012)].
Further, the growth of the computational capabilities of the Computers, the Fault Diagnosis is modeled to eliminate manufacturing the architecture of the prototype Wire-EDM Maintenance & Fault-diagnosis Expert System (WMFES) - a hybrid object-oriented expert system and integrated with an artificial neural network (ANN) inferring algorithm,[Huang, et al. (2009)]. Such growth in Computers also the Mathematical models to become fast and are common to validate the wire EDM experiments; to cite (i) the RSM for Inconel 601 material, [Hewidy, et al. (2005)]; Gaussian process regression for chrome alloy C12 [Jin Yuan, et al. (2008)]; (ii) Kurf variation in machining of stainless steel using tool lateral vibration model, [Di Shichun, et al. (2009)]; (iii) RSM using Box Bhakem Design of Experiments, [Anish Kumar, et al. (2012)].
The continuous research on development of models in Wire-EDM led to the approaches such Grey Relational Analysis in selection of possible optimal operating parameters to obtain bettermultiple performance characteristics of (i) 606 Alloy with Al2O3 particle reinforcement [Ko-Ta Chiang and Fu-Ping Chang (2006)];
(ii) Inconel material [ Al Rafie, et al. (2010)] followed by D2 tool steel with stratified wire, [Saurav Datta and Mahapatra (2010)].
(ii) Objective: The Literature reveals that there is a lacuna in the experimentation on two different materials and a comparative study. With the above back ground, a solemn attempt is made to investigate the response parameters and compare the performance characteristics on the two AISI materials, viz., EN 19 and SS 420 steels by experimentation on Wire-EDM so as to find the better machining parameter combination to obtain maximum MRR and with possible good surfaceness.
3 TAGUCHI IN DESIGN OF EXPERIMENTATION
Taguchi’s approach has been built on traditional concepts of Design of Experiments (DOE), such as full factorial, fractional factorial design and orthogonal arrays based on signal –to-noise ratio, robust design and parameter and tolerance designs. DOE is a powerful statistical technique introduced by R.A. Fisher in England in 1920s to study the effect of multiple variables simultaneously [Philips (1989)].
Since, the research work concentrates on the experimental work, the number of experiments is to be conducted, the effect of the individual parameters on the Wire-EDM, either independently or combinedly have to be studied. Therefore, the well known Taguchi technique is chosen and adopted in the present research work. In order to reduce the total number of experiments “Sir Ronald Fisher” has developed the solution: “Orthogonal Arrays”. The orthogonal array is a distillation mechanism by which the engineers can select the experimental process. The array allows the researcher / engineer to vary multiple variables at one time and obtain the effects such that set of variables has an average and the dispersion. Taguchi employs the design of experiments using specially constructed table, known as "Orthogonal Arrays” (OA) to treat the design process, such that the quality is build into the product during the product design stage.
Orthogonal Arrays are the special set of Latin squares, constructed by Taguchi to lay-out the product design experiments. A typicalOrthogonal Array selected ‘L16’ and also suitable to the present work is given
Table –1.The 16 indicates the nine rows, configurations, or prototypes to be tested. Specific test characteristics for each experimental evaluation are identified in the associated row of the table. Thus ‘L16 (44) means that
Table-1: Selection of L16 Orthogonal array
Symbol Expt
M N O P Symbol Expt
M N O P
1 1 1 1 1 9 3 1 3 4
2 1 2 2 2 10 3 2 4 3
3 1 3 3 3 11 3 3 1 2
4 1 4 4 4 12 3 4 2 1
5 2 1 2 3 13 4 1 4 2
6 2 2 1 4 14 4 2 3 1
7 2 3 4 1 15 4 3 2 4
8 2 4 3 2 16 4 4 1 3
4 EXPERIMENTAL SET-UP AND METHODOLOGY
The equipment involved in the Wire-EDM experimentation is shown before the methodology is
explained. The machine and the configuration are shown in Figure – 1 and the Control unit is shown in Figure – 2 followed by the experimental set-up in Figure -3.
Figure -1: Concord 4-axis, CNC Wire Cut EDM Figure -2 : Controller of CNC WEDM (WEDM) (CONCORD DK7720C)
Table-2: Chemical composition
Material Composition
EN 19
SS 420
C 0.362 0.237
Si 0.258 0.384
Mn 0.850 0.310
Cr 1.050 13.208
P 0.013 0.040
Figure - 3: Experimental Setup of the Wire-EDM
4.1 Experimental Methodology
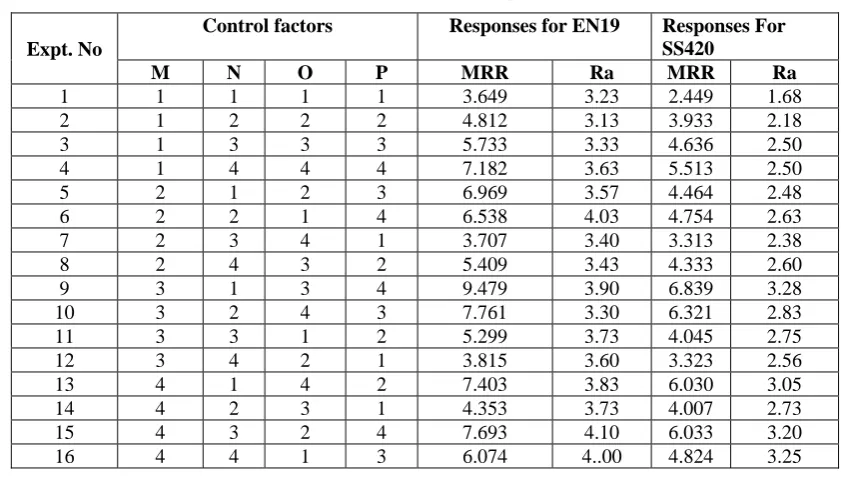
The methodology consists of (i) set-up of the equipment as shown in Figure – 3 on CONCORD DK7720C CNC WEDM. The materials selected and their compositions are given in the Table -2. First the material is loaded on the Table and then the wire electrode is allowed to pass over the guiding rollers. The dielectric media is arranged such that it is pumped at the eroding zone. Once the experiment is set-up, the input parameters, ie., pulse-on, pulse –off, bed speed and current are set through control panel. The program is written and a simulation run executed on the controller. Once, the simulation run is found correct, then the machine is started and input parameters are adjusted as decided and the out-put result such as eroding time is noted. Each experiment is repeated for four times and the average time is taken. Then job is removed and then the experiments are conducted on the second material is loaded. The same procedure explained above is followed. The materials considered in the present work are (i) EN 19 Steel and (ii) SS 420 Steel.The experiments are conducted considering the fixed parameters as given in Table-3 and control factors in Table – 4. Figure-4 shows the eroded particles during experiment. The orthogonal array based on the experimental results is shown in Table – 5 for ES19 and SS 420 Materials.
Table -3: Fixed parameters
Table-4: Control Factors
Fixed Parameters
Wire used Molybdenum wire of dia. 0.180 mm Shape cut 10mm square Location of the work
piece on work table
At the center of table
Angle of cut Vertical Thickness / Height of
the work piece
43mm
Stability Servo control
Number of passes one
Control Factors
Sym-bols
Levels
Steps involved in Wire EDM process
Step 1: Power Supply Generates Volts and Amps: De ionized water surrounds the wire electrode as the power supply generates volts and amps to produce the spark.
Step 2: During Pulse-on Time: The Controlled Spark Erodes Material. It shows the precisely the generation of Sparks to melt and vaporize the material.
Step 3: During Pulse-off Time: It Allows Fluid to Remove Eroded Particles During the off cycle, the pressurized dielectric fluid immediately cools the material and flushes the eroded particles.
Step 4: Filter Removes Chips While the Cycle is repeated
The eroded particles are removed and separated by a filter system as shown in Figure - 4.
Figure -4: Eroded particles removed and separated by filter system
Table- 5: Taguchi Orthogonal Array and Experimental Results
Expt. No
Control factors Responses for EN19 Responses For SS420
M N O P MRR Ra MRR Ra
1 1 1 1 1 3.649 3.23 2.449 1.68
2 1 2 2 2 4.812 3.13 3.933 2.18
3 1 3 3 3 5.733 3.33 4.636 2.50
4 1 4 4 4 7.182 3.63 5.513 2.50
5 2 1 2 3 6.969 3.57 4.464 2.48
6 2 2 1 4 6.538 4.03 4.754 2.63
7 2 3 4 1 3.707 3.40 3.313 2.38
8 2 4 3 2 5.409 3.43 4.333 2.60
9 3 1 3 4 9.479 3.90 6.839 3.28
10 3 2 4 3 7.761 3.30 6.321 2.83
11 3 3 1 2 5.299 3.73 4.045 2.75
12 3 4 2 1 3.815 3.60 3.323 2.56
13 4 1 4 2 7.403 3.83 6.030 3.05
14 4 2 3 1 4.353 3.73 4.007 2.73
15 4 3 2 4 7.693 4.10 6.033 3.20
16 4 4 1 3 6.074 4..00 4.824 3.25
5 RESULTS AND DISCUSSION
The experiments are conducted based on L16 orthogonal array considering Pulse–on, Pulse-off, Bed
Figure – 5 (a): MRR (Max) Condition Figure – 5(b) : Better Surface Condition
Figure – 5: Sample Image on the SS 420 material
5.1 MRR Analysis on SN 19 and SS 420 materials
The analysis of S/N ratios of MRR considering “Larger is the Better” characteristic and S/N ratio of Surface Finish (Ra) “Smaller is the Better” characteristic are calculated as in equation (1) and (2) respectively. η = -10 log10 (1/n Σ 1/y2) --- (1) and η = -10 log10 (1/n Σy2) --- (2)
Where n is the number of measurements in a trail. In the present case, n = 1 and y is the measured in each experimental run. The calculated S/N ratio of MRR and Ra for EN19 & SS420 steels are shown in Table-6 followed by the S/N Ratio response for MRR in Table-7. Whereas the Figure -6 shows the effect of Process parameters on MRR for EN19 material followed by Figure-7 on MRR for SS420 material.
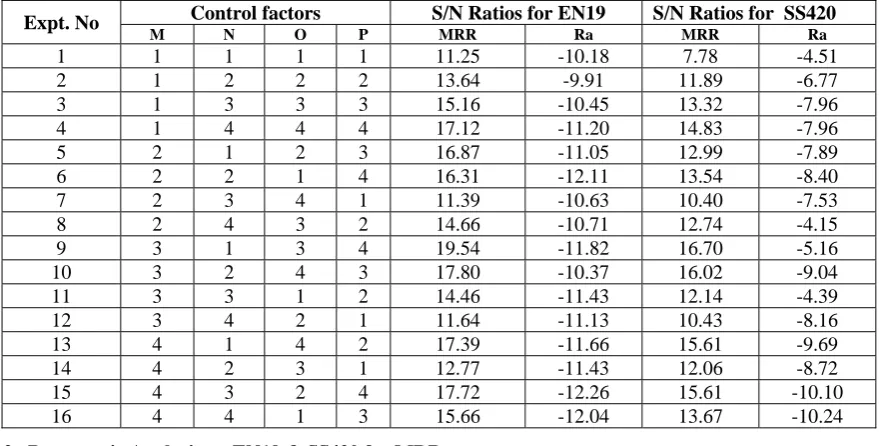
Table-6: S/N Ratios to responses
Expt. No Control factors S/N Ratios for EN19 S/N Ratios for SS420
M N O P MRR Ra MRR Ra
1 1 1 1 1 11.25 -10.18 7.78 -4.51
2 1 2 2 2 13.64 -9.91 11.89 -6.77
3 1 3 3 3 15.16 -10.45 13.32 -7.96
4 1 4 4 4 17.12 -11.20 14.83 -7.96
5 2 1 2 3 16.87 -11.05 12.99 -7.89
6 2 2 1 4 16.31 -12.11 13.54 -8.40
7 2 3 4 1 11.39 -10.63 10.40 -7.53
8 2 4 3 2 14.66 -10.71 12.74 -4.15
9 3 1 3 4 19.54 -11.82 16.70 -5.16
10 3 2 4 3 17.80 -10.37 16.02 -9.04
11 3 3 1 2 14.46 -11.43 12.14 -4.39
12 3 4 2 1 11.64 -11.13 10.43 -8.16
13 4 1 4 2 17.39 -11.66 15.61 -9.69
14 4 2 3 1 12.77 -11.43 12.06 -8.72
15 4 3 2 4 17.72 -12.26 15.61 -10.10
16 4 4 1 3 15.66 -12.04 13.67 -10.24
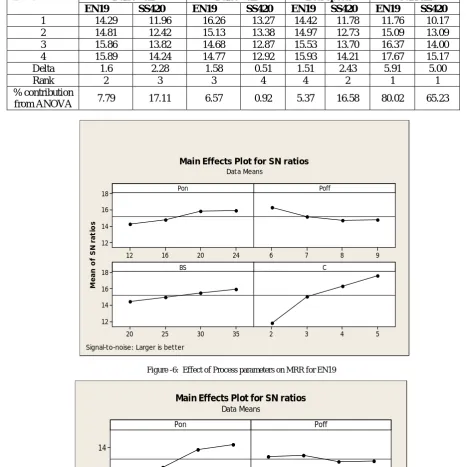
5.2 Parametric Analysis on EN19 & SS420 for MRR
Table-7: S/N ratios response for MRR
Level Pulse –on Pulse –off Bed Speed Current
EN19 SS420 EN19 SS420 EN19 SS420 EN19 SS420
1 14.29 11.96 16.26 13.27 14.42 11.78 11.76 10.17
2 14.81 12.42 15.13 13.38 14.97 12.73 15.09 13.09
3 15.86 13.82 14.68 12.87 15.53 13.70 16.37 14.00
4 15.89 14.24 14.77 12.92 15.93 14.21 17.67 15.17
Delta 1.6 2.28 1.58 0.51 1.51 2.43 5.91 5.00
Rank 2 3 3 4 4 2 1 1
% contribution
from ANOVA 7.79 17.11 6.57 0.92 5.37 16.58 80.02 65.23
Figure -6: Effect of Process parameters on MRR for EN19
24 20 16 12 14 12 10 9 8 7 6 35 30 25 20 14 12 10 5 4 3 2 Pon M e a n o f S N r a ti o s Poff BS C
Main Effects Plot for SN ratios
Data Means
Signal-to-noise: Larger is better
Figure-7: Effect of process Parameters on MRR for SS420 24 20 16 12 18 16 14 12 9 8 7 6 35 30 25 20 18 16 14 12 5 4 3 2 Pon Me an o f S N r at io s Poff BS C
Main Effects Plot for SN ratios
Data Means
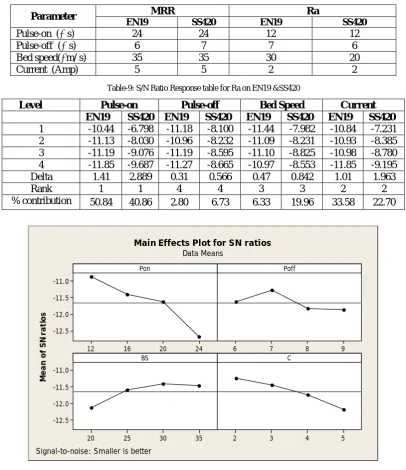
Table-9: S/N Ratio Response table for Ra on EN19 &SS420
Level Pulse-on Pulse-off Bed Speed Current
EN19 SS420 EN19 SS420 EN19 SS420 EN19 SS420 1 -10.44 -6.798 -11.18 -8.100 -11.44 -7.982 -10.84 -7.231 2 -11.13 -8.030 -10.96 -8.232 -11.09 -8.231 -10.93 -8.385 3 -11.19 -9.076 -11.19 -8.595 -11.10 -8.825 -10.98 -8.780 4 -11.85 -9.687 -11.27 -8.665 -10.97 -8.553 -11.85 -9.195 Delta 1.41 2.889 0.31 0.566 0.47 0.842 1.01 1.963
Rank 1 1 4 4 3 3 2 2
% contribution 50.84 40.86 2.80 6.73 6.33 19.96 33.58 22.70
24 20
16 12
-11.0
-11.5
-12.0
-12.5
9 8
7 6
35 30
25 20
-11.0
-11.5
-12.0
-12.5
5 4
3 2
Pon
Me
a
n
o
f S
N
r
a
ti
o
s
Poff
BS C
Main Effects Plot for SN ratios
Data Means
Signal-to-noise: Smaller is better
Figure -8: Effect of control factors on Ra of EN19
Parameter MRR Ra
EN19 SS420 EN19 SS420
Pulse-on (μ s) 24 24 12 12
Pulse-off (μ s) 6 7 7 6
Bed speed(μm/ s) 35 35 30 20
Figure-9: Effect of control factors on Ra of SS420
6 DEVELOPMENT OF REGRESSION EQUATIONS
The Regression Analysis is carried-out considering the parametric values used in the experiments so as to obtain generalised equations to predict the responses as out-put for implementation.. The equations are shown in the following. The MiniTAB is used for calculation to run-on IBM Compatible PC-AT.
Regression Equation of MRR for EN19 material
MRR= 0.878 x(P0n)0.293 x(P off) - 0.430 x(BS) 0.312 x(C) 0.733 --- (1) Regression Equation of Ra for EN19 material
Ra = 2.145 x (P0n) 0.214 x (P off) 0.039 x (BS) - 0.089 x(C) 0.106 --- (2) Regression Equation of MRR for SS420 material
MRR = 0.164x (P on) 0.407 x (P0ff) - 0.132 x (BS) 0.513 x (C) 0.614 --- (3) Regression Equation of Ra for SS420 material
Ra = 0.212 x (P on) 0.488 x (P0ff) 0.176 x (BS) 0.47 x (C) 0.243 --- (4) 7 COMPARISON OF EXPERIMENTAL AND PREDICTED VALUES
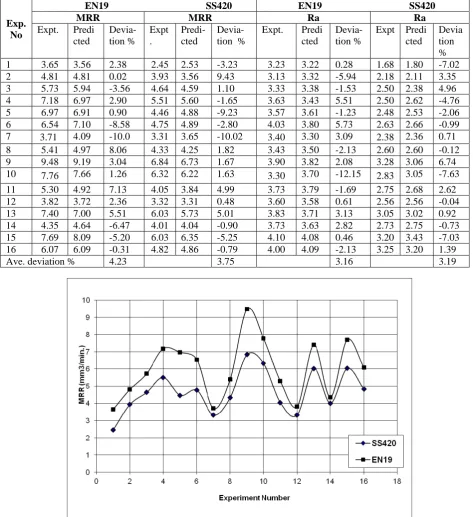
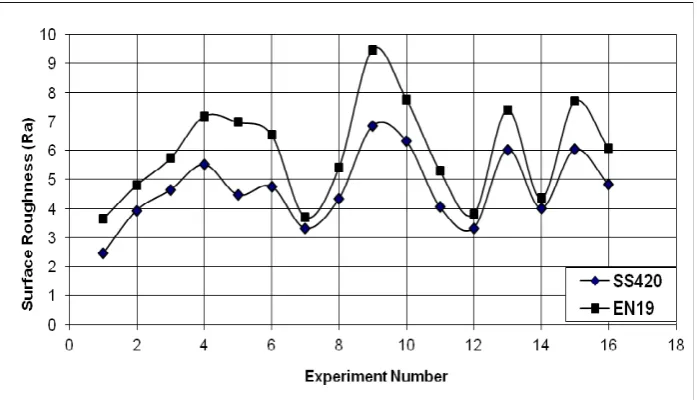
The results obtained from the Experimentation and Regression Analysis for both the EN 19 and SS 420 materials are shown in Table-10 for convenience and easy comparison. The results from Table-10, it can be seen that the deviation of the effects of all the parameters lie within 5% of error between the experimental and predicted results. The results are also represented in the form of Graphs to show the trend of the characteristics of the parametric influences. It can be observed from Figure -10, that better MRR is obtained for EN 19 material for all conditions where as the surface roughness (Ra) obtained is better for SS420 for similar conditions as shown in Figure – 11.
24 20
16 12
-7
-8
-9
-10
9 8
7 6
35 30
25 20
-7
-8
-9
-10
5 4
3 2
Pon
Me
a
n
o
f S
N
r
a
ti
o
s
Poff
BS C
Main Effects Plot for SN ratios
Data Means
8 5.41 4.97 8.06 4.33 4.25 1.82 3.43 3.50 -2.13 2.60 2.60 -0.12 9 9.48 9.19 3.04 6.84 6.73 1.67 3.90 3.82 2.08 3.28 3.06 6.74 10 7.76 7.66 1.26 6.32 6.22 1.63 3.30 3.70 -12.15 2.83 3.05 -7.63 11 5.30 4.92 7.13 4.05 3.84 4.99 3.73 3.79 -1.69 2.75 2.68 2.62 12 3.82 3.72 2.36 3.32 3.31 0.48 3.60 3.58 0.61 2.56 2.56 -0.04 13 7.40 7.00 5.51 6.03 5.73 5.01 3.83 3.71 3.13 3.05 3.02 0.92 14 4.35 4.64 -6.47 4.01 4.04 -0.90 3.73 3.63 2.82 2.73 2.75 -0.73 15 7.69 8.09 -5.20 6.03 6.35 -5.25 4.10 4.08 0.46 3.20 3.43 -7.03 16 6.07 6.09 -0.31 4.82 4.86 -0.79 4.00 4.09 -2.13 3.25 3.20 1.39
Ave. deviation % 4.23 3.75 3.16 3.19
Figure -11: Comparison of Deviation on Surface roughness for EN19& SS420
8 CONCLUSIONS
The final conclusions based on the results are presented in the following.
(i) The author, for the first time, has conducted experiments on WireEDM considering two different materials for same parametric values and compared the performance characteristics in terms of MRR and Surface Roughness.
(ii) From the Analysis, it is found that the current is major influencing parameter for MRR on both the materials. Such experiments will be useful in the manufacturing processes where the MRR is the major desired response characteristics.
(iii) The effect of Pulse-on is higher side on Surface Roughness for both the materials. Such experiments will be useful in the manufacturing of sophisticated equipment and machinery such as Robotics, Aerodynamic Industry and Scientific Research.
(iv) Based on the results, it is recommended that the EN 19 material is suitable for better MRR. Then the SS 420 material is recommended to obtain better surface.
(v) The Regression models are useful to predict the MRR and Ra with an accuracy of 95%. 8.1 Future Scope
The experiments are conducted in the present on AISI Hard Steels considering two materials. The procedure can be extended to other AISI Tool steels and Composite Materials.
REFERENCES
[1] Abdul Kareem, S., Khan, A.A. and Zam, Z.M., Effect of Machining Parameters on Surface Roughness during Wet and Dry Wire-EDM of Stainless Steel, Journal of Applied Sciences, Vol. 11 (10), pp.1867 – 1871, 2011.
[2] Al Rafie, A., Al-Durgham, L., and Bata, N., Optimal parameter design by Regression Technique and Gray Relational Analysis, Proc. of World Congress on Engineering -2010, Vol. III, London, UK, June 30-July2, 2010.
[3] Anish Kumar, Vinod Kumar, Jatinder Kumar, Prediction of Surface Roughness in Wire Electric Discharge Machining (WEDM) Process based on Response Surface Methodology, International Jl. of Engineering &Technology, V.2, No.4, pp. 708-719, April, 2012 [4] Bhaskar Reddy, C., Eswara Reddy, C., Ramana Reddy, D., Experimental Investigation of Surface Finish and Material Removal Rate of
P20 Die Tool Steel in WireEDM using Multiple Regression Analysis, GSTF Jl .of Engg. Technology, V1, pp. 113 –118, Jun 2012. [5] Bhaskar Reddy, C, G. J. Reddy, G, Eswara Reddy, C, Growth of Electrical Discharge Machining and Applications–Review,
Communicated to Technology Spectrum, JNTUH, Hyderabad, 2012.
[6] Danial Ghodsiyeh, Lahji, M.A., Ghanbari, M., Golshan, A., Shirdar, M.R., Optimising Rough Cut in WEDMing Titanium Alloy (Ti6A14V) by Brass wire using Taguchi Method, Journal of Basic Applied Science Research, Vol. 2 (8) , pp. 7488 – 7496, 2012. [7] Di Shichun, Xuyang, C., Dongbo., W., Zhenlong, W., Guanxin, C., Yuan., L, Analysis of kerf width in Micro-WEDM, Internat’l Jl of
Machine Tools & Manufacture, V49, pp788-792, 2009.
[8] Goswami Amitesh, Kumar Jatinder, An Investigation into the Machining Characteristics of Nimonic 80A using CNC Wire-EDM, International Journal of Advanced Engineering Technology, V III, Issue I, pp. 174-174, Jan-Mar, 2012.
[9] Hewidy, M.S., EI – Taweel, T.A., EI-Safty, M.E., Modelling the Machining parameters of wire electrical discharge machining of Inconel 601using RSM, Jl. of Material Processing Technology, pp. 328 – 336, 2005.
[10] Ho, K.H., Newman, S.T., Rahimifard, S. and Allen, R.D., State of the Art in Wire Electrical Discharge Machining (WEDM), International Jl. of Machine Tools & Manufacture, Vol. 44, pp. 1247 – 1259, 2004.
[11] Huang, Han-Ming Chow, Yang., L.D., Chun-Te lu., Recast layer removal after electrical discharge machining via Taguchi Analysis – A feasibility study, Journal of Material Processing Technology, V. 209, pp. 4134-4140, 2009.
Good Surface Finish and Better Accuracy, Competitive Manufacturing – Proc. of 2nd International & 23rd AIMTDR Conf., pp. 489 –
494, I.I.T. Madras, Chennai, India, 2008.
[21] Saurav Datta and S.S. Mahapatra, Modeling, Simulation and Parametric Optimisation of WireEDM Process using response surface methodology coupled with Grey-Taguchi technique, International Jl. of Engineering, Science &d Tech., V 2, No5, pp162-183, 2010 [22] Srinivas Rao, Pujari, Ramji. K., Effect of WEDM Continuous on Surface Roughness: A Parametric Optimisation using Taguchi
Method, International Jl. of Advanced engineering Sciences and Technologies, Viol. 6., Issue 1, pp. 041 – 048, 2011.
[23] Ulas Caydas, Ahmet Hascalik, Sami Ekici, An Adaptive Neuro Fuzzy Inference System (ANFIS) model for Wire-EDM, Expert Systems with Applications, V 36, pp 6135-6139, 2009
[24] Vijaya Bhaskara Reddy, P., Hemachandra Reddy, K., and Vikram Kumar, CH. R., Selection of Cutting Velocity in Wire-EDM process using Fuzzy Logic, Competitive Manufacturing – Proc. of 2nd Interl & 23rd AIMTDR Conf., pp. 495 – 501, I.I.T. Madras, Chennai,
India, 2008.
[25] Yan, B.H., Tsai, H.C., Huang, F.Y. and Lee, L.C., Examination of Wire Electrical Discharge Machining of Al2O3P / 6061 Copmosites,