Seventh International Congress on Advances in Civil Engineering, October11-13, 2006 Yildiz TechnicalUniversity, Istanbul, Turkey
Shrinkage and Creep Properties of
High-Strength Concrete Up To 120 MPa
H. C. Mertol, W. Choi, S. Rizkalla, P. Zia
North Carolina State University,
Department of Civil Construction and Environmental Engineering, Raleigh, NC, USA
A. Mirmiran
Florida International University, Department of Civil and Environmental Engineering Miami, FL, USA
Abstract
Recently, the use of high-strength concrete has become more popular due to the availability and significant variety of the admixtures. High-strength concrete increases the load carrying capacity of the columns, therefore, reduces their sizes in buildings and bridges. In bridges, high-strength concrete could result in reduction of number of girders as well as an increase in the span length which significantly reduces the complexity of a project, construction time and overall cost. Due to lack of research data for the material characteristics of high-strength concrete, most of the design codes worldwide limit the applicability of high-strength concrete for concrete structures.
This paper summarizes the research findings on the shrinkage and creep behavior of high-strength concrete. A total of 42 cylindrical specimens and 18 prism specimens were monitored for one year. The variables considered in this investigation were the concrete compressive strength (70 to 120 MPa), specimen size (cylindrical or prism), curing type (moist or heat curing), age of concrete at loading (1, 7, 14, 28 days) and loading stress level (0.2f’c or 0.4f’c). The creep coefficients and shrinkage strains were
obtained for the range of concrete compressive strength, evaluated and compiled with the current predictions according to the AASHTO LRFD Bridge Design Specifications. Research findings indicate that the current AASHTO LRFD Specifications could be used to estimate the creep coefficient for moist cured high-strength concrete, however, overestimates the values for heat cured high-strength concrete. The current AASHTO LRFD Specifications predict the shrinkage behavior very well, therefore, can be used to estimate the shrinkage strain of moist and heat cured high-strength concrete.
Introduction
Use of high-strength concrete became more popular recently due to the availability and significant variety of the admixtures. High-strength concrete increases the load carrying capacity of the columns, therefore, reduces their sizes in buildings and bridges. In bridges, high strength concrete could result in reduction of number of girders as well as an increase in the span length which significantly reduces the complexity of a project, construction time and overall cost. Due to lack of research data for the material characteristics of high-strength concrete, most of the design codes worldwide limit the applicability of high-strength concrete for concrete structures.
Concrete is a time dependent material. In particular, concrete creeps under sustain load, and shrinks due to the changes in the moisture content of the surrounding environment. These physical changes increase by time. The information on creep and shrinkage of concrete can be used to determine the prestressing losses, long term deformations and cracking of the civil engineering structures. The evaluation of creep and shrinkage of concrete is very important especially for long-span and high-rise structures. The current code equations for creep and shrinkage predictions are based on normal-strength concrete; therefore, there is a need to evaluate these characteristics for high-strength concrete.
This paper summarizes the research findings on the shrinkage and creep behavior of high-strength concrete. A total of 42 cylindrical specimens and 18 prism specimens were monitored for one year. The variables considered in this investigation were the concrete compressive strength, specimen size, curing type, age of concrete at loading and loading stress level. The results were compared to the predictions according to the AASHTO LRFD Bridge Design Specifications (2004).
Experimental Program
Test Specimens
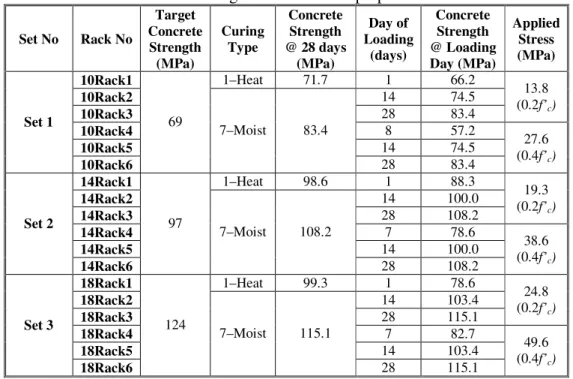
Test series consisted of 42 cylindrical specimens of 102x305 mm dimensions and 18 prism specimens of 76x76x286 mm dimensions. Thirty six cylindrical specimens were used to evaluate the creep behavior of high-strength concrete where two specimens were tested in each creep rack. Six cylindrical specimens and 18 prism specimens were used to evaluate the shrinkage behavior of high-strength concrete. The test matrix for this program is presented in Table 1 and 2.
Table 1 Testing Scheme for Creep Specimens
Set No Rack No
Target Concrete Strength (MPa) Curing Type Concrete Strength @ 28 days
(MPa) Day of Loading (days) Concrete Strength @ Loading Day (MPa) Applied Stress (MPa)
10Rack1 1–Heat 71.7 1 66.2
10Rack2 14 74.5
10Rack3 28 83.4
13.8 (0.2f’c)
10Rack4 8 57.2
10Rack5 14 74.5
Set 1
10Rack6
69
7–Moist 83.4
28 83.4
27.6 (0.4f’c)
14Rack1 1–Heat 98.6 1 88.3
14Rack2 14 100.0
14Rack3 28 108.2
19.3 (0.2f’c)
14Rack4 7 78.6
14Rack5 14 100.0
Set 2
14Rack6
97
7–Moist 108.2
28 108.2
38.6 (0.4f’c)
18Rack1 1–Heat 99.3 1 78.6
18Rack2 14 103.4
18Rack3 28 115.1
24.8 (0.2f’c)
18Rack4 7 82.7
18Rack5 14 103.4
Set 3
18Rack6
124
7–Moist 115.1
28 115.1
49.6 (0.4f’c)
Table 2 Testing Scheme for Shrinkage Specimens Set No Specimen
No Target Concrete Strength (MPa) Specimen Type Curing Type
Age of Concrete when Tests Started (days) 10SP1
10SP2 10SP3
1–Heat 1
10SP4 10SP5 10SP6
Prism
7–Moist 7
10SC1 1–Heat 1
Set 1
10SC2
69
Cylindrical
7–Moist 7
14SP1 14SP2 14SP3
1–Heat 1
14SP4 14SP5 14SP6
Prism
7–Moist 7
14SC1 1–Heat 1
Set 2
14SC2
97
Cylindrical
7–Moist 7
18SP1 18SP2 18SP3
1–Heat 1
18SP4 18SP5 18SP6
Prism
7–Moist 7
18SC1 1–Heat 1
Set 3
18SC2
124
Cylindrical
Material Properties
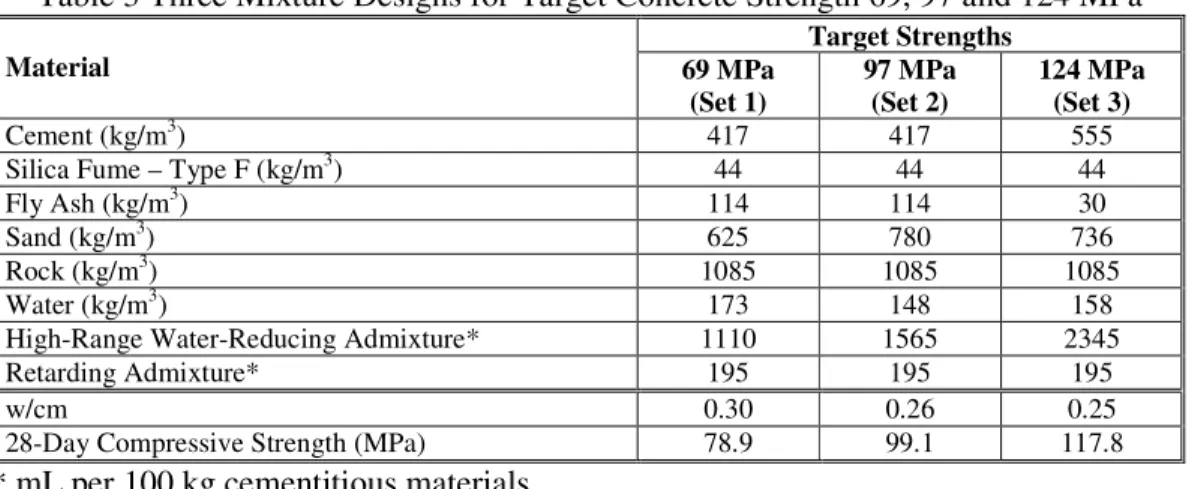
Mixture designs, for the three concrete target strengths of 69, 97 and 124 MPa were developed by Logan(2005) after numerous laboratory and plant trial batches. Details of the concrete mixture design for each of the target strengths are given in Table 3.
Table 3 Three Mixture Designs for Target Concrete Strength 69, 97 and 124 MPa Target Strengths
Material 69 MPa
(Set 1)
97 MPa (Set 2)
124 MPa (Set 3)
Cement (kg/m3) 417 417 555
Silica Fume – Type F (kg/m3) 44 44 44
Fly Ash (kg/m3) 114 114 30
Sand (kg/m3) 625 780 736
Rock (kg/m3) 1085 1085 1085
Water (kg/m3) 173 148 158
High-Range Water-Reducing Admixture* 1110 1565 2345 Retarding Admixture* 195 195 195
w/cm 0.30 0.26 0.25
28-Day Compressive Strength (MPa) 78.9 99.1 117.8
* mL per 100 kg cementitious materials
The coarse aggregate was obtained from Carolina Sunrock Corporation. The selected aggregate was #78M crushed stone with a nominal maximum size of 9.5 mm. Two types of fine aggregate were used depending on the target compressive strength. The first type of fine aggregate was a natural sand used by the Ready-Mixed Concrete Company in all of their concrete mixtures. The second type of fine aggregate was a manufactured sand known as 2MS Concrete Sand produced by Carolina Sunrock Corporation. The cement used was a Type I/II cement produced by Roanoke Cement. The fly ash producer was Boral Material Technologies and the silica fume producer was Elkem Materials, Inc. Both the high-range water-reducing and the retarding admixtures were manufactured by Degussa Admixtures, Inc. The high-range water-reducing admixture (HRWRA) used was Glenium® 3030 and the retarding admixture was DELVO® Stabilizer.
Test Method and Test Set-Up
The two different curing conditions used in this investigation were: 1-day heat curing and 7-day moist curing. The 1-day heat curing was selected to simulate the conditions of precast prestressed concrete plants. Half an hour after casting, specimens for 1-day heat curing were placed in an environmental chamber for 24 hours where the temperature was controlled to achieve internal concrete temperatures between 66 °C and 71 °C. The cylindrical molds were covered with plastic lids and the prism molds were covered with wet burlap and plastic sheets to prevent moisture loss throughout the heat curing process. At the end of 24 hours, the concrete specimens were demolded and stored in the laboratory where the temperature was maintained at approximately 22° C with 50 percent relative humidity.
hours, the specimens were removed from their molds and were submerged in water in curing tank. The water temperature in the curing tank was maintained at 23°C ± 2°C using specially designed heaters equipped with adjustable thermostats. The water was saturated with lime to prevent leaching of calcium hydroxide from the test specimens. The curing tanks also contained pumps to circulate the water for the purpose of maintaining a constant temperature and concentration of calcium hydroxide throughout the tank. On the 7th day of curing, the specimens were removed from the curing tanks and stored in the laboratory where the temperature was maintained at approximately 22° C with 50 percent relative humidity.
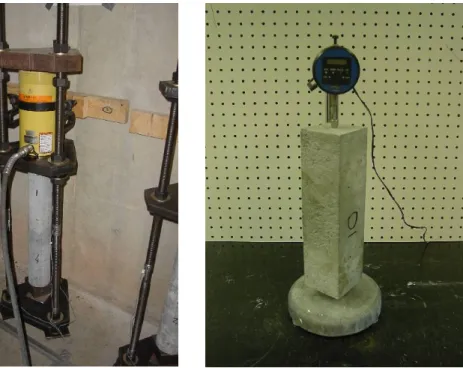
Creep tests were performed using 102x305 mm cylindrical specimens. The test set-up is shown in Figure 1. Two identical cylindrical specimens were stacked and concentrically loaded in each creep rack equipped by a 550 kN hydraulic jack. Two different stress levels equivalent to 0.2f’c and 0.4f’c were used where f’c is the target concrete strength.
The applied load in each creep rack was monitored by a pressure gage connected to the hydraulic jack at the time of loading and by the strain gages attached to the three threaded rods of each rack at the time of monitoring. Six demec inserts were embedded in each concrete specimen on three 120° angle planes along the height to measure the concrete strain by 203 mm Demec gage. One-day heat cured specimens were loaded at the end of curing period, whereas the 7-day moist cured specimens were loaded at the 7th, 14th and 28 days. The creep racks were continuously monitored by a datalogger. Disk springs were used in the creep racks to compensate for the load drop due to creep and shrinkage of concrete. In case of a load drop in any rack more than 5% of the specified load, the load was adjusted using the hydraulic jack to the specified value. The creep specimens had companion cylindrical shrinkage specimens from which the shrinkage strain of the 102x305 mm cylinders was measured. These shrinkage strain readings were deducted from the Demec readings to obtain the creep strain of the specimens. The two ends of the cylindrical shrinkage specimens were sealed with epoxy to simulate the same surface/volume ratio of the loaded creep cylinders.
Prism specimens, 76x76x286 mm, used to measure shrinkage in accordance to ASTM C 157. The test set-up is presented in Figure 2. Two inserts were embedded at the top and the bottom of each specimen in order to monitor the shrinkage strain by using a dial indicator. The tests for 1-day heat cured specimens were started at the end of the first day, whereas 7-day moist cured specimens were started at the 7th day.
The measurements from the creep and shrinkage specimens were recorded at the predetermined time interval throughout the duration of the test. These intervals were more frequent at the beginning of the tests.
Figure 1 Test Set-Up for Creep Tests Figure 2 Test Set-Up for Shrinkage Tests
Test Results and Discussions
Both the creep and shrinkage specimens were monitored for more than one year. Test results were compared to the predicted creep and shrinkage according to the AASHTO LRFD Bridge Design Specifications (2004) which are derived based on the research conducted by Tadros (2003). The creep and shrinkage prediction equations given by the AASHTO LRFD Bridge Design Specifications (2004) are shown in Table 4.
Table 4 Creep and Shrinkage Prediction Equations by the AASHTO LRFD Bridge Design Specifications
Shrinkage Creep Equation εsh 480 10−6k k k ktd s hs f
= × Ψ(t t,i)=1.90k k k k ktd la s hc f td
k (time development factor)
61 0.58 ' td
ci t k
f t
=
− +
hc hs
k , (humidity factor) khs=2.00−0.0143H khc =1.56−0.008H
s
k (size factor) 1064 3.7 /
735 s
V S
k = −
f
k (concrete strength factor) 34.5
6.9 '
f
ci k
f
= +
la
k (loading age factor) - kla =ti−0.118
In Table 3, εsh is the shrinkage strain, Ψ is the creep coefficient, t is the age of concrete
after loading in days, ti is the age of concrete when load is initially applied for
The temperature of the surrounding environment was kept constant throughout the testing period. However the relative humidity of the ambient air was varying for this duration. Therefore, the creep and shrinkage strain measurements were normalized by using the appropriate humidity factor presented in Table 3. An incremental procedure was used to normalize the measured data to 70 percent relative humidity for comparison purposes with the prediction relationships specified by the AASHTO LRFD Bridge Design Specifications (2004).
Creep Behavior
The creep strain was determined based on the measured total strain reduced by the measured shrinkage strain of the unloaded companion cylinders and the initial elastic strain of each creep cylinders. The creep coefficients, defined as the ratios between the creep deformations at time t and the instantaneous elastic strain, were calculated to evaluate the creep behaviour for high-strength concrete. The average creep coefficients presented for each concrete strength and each stress level are based on average normalized values using two cylinders in each rack. The measured creep strains were adjusted for 70 percent relative humidity as explained previously. The comparisons of the average creep coefficients of the creep specimens to the creep coefficient predictions provided by the AASHTO LRFD Bridge Design Specifications (2004) are presented in Figure 3 to 5. The dark lines represent the code relationship. Only the typical behavior for each concrete strength is presented in these figures due to space limitation of the paper.
0 0.3 0.6 0.9 1.2
0 200 400 600
Time After Loading (days)
C
re
e
p
C
o
e
ff
ic
ie
n
t AASHTO LRFD
10Rack
0 0.3 0.6 0.9 1.2
0 200 400 600
Time After Loading (days)
C
re
e
p
C
o
e
ff
ic
ie
n
t
AASHTO LRFD
10Rack4
Heat Cured, Loaded 1st day Moist Cured, Loaded 8th day Figure 3 Average Creep Coefficients for Specimens of Set 1
0 0.3 0.6 0.9 1.2
0 200 400 600
Time After Loading (days)
C
re
e
p
C
o
e
ff
ic
ie
n
t AASHTO LRFD
14Rack1
0 0.3 0.6 0.9 1.2
0 200 400 600
Time After Loading (days)
C
re
e
p
C
o
e
ff
ic
ie
n
t
AASHTO LRFD 14Rack2 14Rack5
Heat Cured, Loaded 1st day Moist Cured, Loaded 14th day Figure 4 Average Creep Coefficients for Specimens of Set 2
0 0.3 0.6 0.9 1.2
0 200 400 600
Time After Loading (days)
C re e p C o e ff ic ie n t AASHTO LRFD 18Rack1 0 0.3 0.6 0.9 1.2
0 200 400 600
Time After Loading (days)
C re e p C o e ff ic ie n t AASHTO LRFD 18Rack2 18Rack5
Heat Cured, Loaded 1st day Moist Cured, Loaded 14th day Figure 5 Average Creep Coefficients for Specimens of Set 3
In general, test results of the three concrete strengths considered in this investigation indicate that as concrete gets older and stronger, the creep of concrete decreases. The creep behavior of 1-day heat cured cylinders is less than that of 7-day moist cured cylinders. The creep for high-strength concrete is proportional to the applied stress provided that the applied stress is less than the proportional limit. The creep coefficient predictions specified by the AASHTO LRFD Bridge Design Specifications (2004) produce closer predictions for moist cured high-strength concrete specimens. The creep coefficients for heat cured high-strength concrete specimens are overestimated by the AASHTO LRFD Bridge Design Specifications (2004). The equation predicts higher early creep coefficient when concrete the compressive strength is over 80 MPa at the time of loading. The creep prediction relationship specified by the AASHTO LRFD Bridge Design Specifications (2004) must be used with discretion for early stages of structures with concrete compressive strengths over 80 MPa.
Shrinkage Behavior
Shrinkage strain were monitored at the same time and under the same conditions used for the creep specimens. The measured shrinkage strains were adjusted for 70 percent relative humidity as explained previously. The comparison of the adjusted shrinkage strains of the cylindrical and prism specimens to the shrinkage strain prediction provided by the AASHTO LRFD Bridge Design Specifications (2004) are presented in Figure 6 to 8. The dark lines represent the code relationship. Only the typical behavior for each of the concrete strength is presented in these figures due to space limitation of this paper. 0 100 200 300 400 S h ri n k a g e S tr a in (µ ε µ ε µ ε µ ε
) AASHTO LRFD
10SP2 10SP3 10SP1 0 100 200 300 400 S h ri n k a g e S tr a in (µ ε µ ε µ ε µ ε
) AASHTO LRFD
0 100 200 300 400
0 200 400 600
Time After Curing (days)
S h ri n k a g e S tr a in (µ ε µ ε µ ε µ ε )
AASHTO LRFD 14SP2
14SP3 14SP1 0 100 200 300 400
0 200 400 600
Time After Curing (days)
S h ri n k a g e S tr a in (µ ε µ ε µ ε µ ε ) AASHTO LRFD 14SC2
Heat Cured, Prism Moist Cured, Cylindrical Figure 7 Shrinkage Strains for Specimens of Set 2
0 100 200 300 400
0 200 400 600
Time After Curing (days)
S h ri n k a g e S tr a in (µ ε µ ε µ ε µ ε ) AASHTO LRFD 18SC1 0 100 200 300 400
0 200 400 600
Time After Curing (days)
S h ri n k a g e S tr a in (µ ε µ ε µ ε µ ε ) AASHTO LRFD 18SP4 18SP6 18SP5
Heat Cured, Cylindrical Moist Cured, Prism Figure 8 Shrinkage Strains for Specimens of Set 3
Test results indicate that in general heat cured specimens has less shrinkage compared to the moist cured cylinders. The ultimate shrinkage strain does not vary significantly for high-strength concrete ranging from 70 to 120 MPa. The collected data indicate that shrinkage strain predictions according to the AASHTO LRFD Bridge Design Specifications (2004) produce good predictions for both heat and moist cured high-strength concrete specimens.
Conclusions
A total of 42 cylindrical specimens and 18 prism specimens were monitored for one year to evaluate the shrinkage and creep behavior of high-strength concrete. The variables considered in this investigation were the concrete compressive strength (70 to 120 MPa), specimen size (cylindrical or prism), curing type (moist or heat curing), age of concrete at loading (1, 7, 14, 28 days) and loading stress level (0.2f’cAg or 0.4f’cAg).
The creep coefficient and shrinkage strain were obtained for the range of concrete compressive strength, evaluated, compiled and compared to the predictions specified by the AASHTO LRFD Bridge Design Specifications (2004). The test results indicate that:
1. Creep characteristics of high-strength concrete follow the same trend as that of normal-strength concrete.
2. The creep behavior of 1-day heat cured cylinders is less than that of 7-day moist cured cylinders.
3. The creep coefficients for moist cured high-strength concrete specimens are slightly overestimated by the AASHTO LRFD Bridge Design Specifications (2004). 4. The creep coefficients for heat cured high-strength concrete specimens are
significantly overestimated using the AASHTO LRFD Bridge Design Specifications (2004).
5. The creep prediction relationship specified by the AASHTO LRFD Bridge Design Specifications (2004) predicts higher early creep coefficient when the concrete compressive strength is higher than 80 MPa at the time of loading.
6. Heat cured specimens have less shrinkage compared to moist cured specimens. 7. The ultimate shrinkage strain does not vary significantly for high-strength concrete
ranging from 70 to 120 MPa.
8. The current AASHTO LRFD Bridge Design Specifications (2004) predict the shrinkage strain of heat and moist cured high-strength concrete quite well.
Acknowledgements
The authors would like to acknowledge the support of the NCHRP through project 12-64 and the Senior Program Officer, David Beal. The authors also thank the contributions of Henry Russell of Henry Russell, Inc. and Robert Mast of Berger/ABAM Engineers, Inc. who served as consultants for the project. The contribution of Ready Mixed Concrete Company and the personnel of the Constructed Facilities Laboratory are greatly appreciated. The authors would also like to acknowledge the helpful efforts provided by the graduate research assistants, Andrew Logan, SungJoong Kim and Zhenhua Wu.
References
Logan, A. T. (2005) Short-Term Material Properties of High-Strength Concrete. M.S. Thesis, Department of Civil, Construction and Environmental Engineering, North Carolina State University, Raleigh, NC, USA.
American Association of State Highway and Transportation Officials (2004) AASHTO LRFD Bridge Design Specifications. 3rd Edition including Interims for 2005 and 2006, Washington, DC, USA.
Tadros, M. et al. (2003) Prestress Losses in Pretensioned High-Strength Concrete Bridge Girders. NCHRP Report 496, Transportation Research Board, Washington, DC, USA.