C
ORPORATE
C
REDIT
R
ISK
M
ODELING
: Q
UANTITATIVE
R
ATING
S
YSTEM
A
ND
P
ROBABILITY
O
F
D
EFAULT
E
STIMATION
João Eduardo Fernandes
*April 2005
ABSTRACT: The literature on corporate credit risk modeling for privately-held firms is scarce. Although firms with unlisted equity or debt represent a significant fraction of the corporate sector worldwide, research in this area has been hampered by the unavailability of public data. This study is an empirical application of credit scoring and rating techniques applied to the corporate historical database of one of the major Portuguese banks. Several alternative scoring methodologies are presented, thoroughly validated and statistically compared. In addition, two distinct strategies for grouping the individual scores into rating classes are developed. Finally, the regulatory capital requirements under the New Basel Capital Accord are calculated for a simulated portfolio, and compared to the capital requirements under the current capital accord.
KEYWORDS: Credit Scoring, Credit Rating, Private Firms, Discriminatory Power, Basel Capital Accord, Capital Requirements
JEL CLASSIFICATION: C13, C14, G21, G28
* Correspondence Address: R. Prof. Francisco Gentil, E1 5E, 1600-625 Lisbon Portugal, email:
1
1 Introduction
The credit risk modeling literature has grown extensively since the seminal work by Altman (1968) and Merton (1974). Several factors contributed for an increased interest from the market practitioners to have a more correct assessment of the credit risk of their portfolios: the European monetary union and the liberalization of the European capital markets combined with the adoption of a common currency, increased liquidity and competition in the corporate bond market. Credit risk has thus become a key determinant of different prices in the European government bond markets. At a worldwide level, historically low nominal interest rates have made the investors seek the high yield bond market, forcing them to accept more credit risk. Furthermore, the announced revision of the Basel capital accord1 will set a new framework for banks to calculate regulatory capital. As it is already the case for market risks, banks will be allowed to use internal credit risk models to determine their capital requirements. Finally, the surge in the credit derivatives market has also increased the demand for more sophisticated models.
Presently there are three main approaches to credit risk modeling. For firms with traded equity and/or debt, Structural models or Reduced-Form models are considered. Structural Models are based on the work of Black and Scholes (1973) and Merton (1974). Under this approach, a credit facility is regarded as a contingent claim on the value of the firm’s assets, and is valued according to option pricing theory. A diffusion process is assumed for the market value of the firm and default is set to occur whenever the estimated value of the firm hits a pre-specified default barrier. Black & Cox (1976) and Longstaff & Schwartz (1993) have extended this framework relaxing assumptions on default barriers and interest rates.
For the second and more recent approach, the Reduced-Form or Intensity models, there is no attempt to model the market value of the firm. Time of default is modeled directly as the time of the first jump of a Poisson process with random intensity.
1. INTRODUCTION 2 These models were first developed by Jarrow & Turnbull (1995) and Duffie & Singleton (1997).
For privately held firms, where no market data is available, accounting-based credit scoring models are usually applied. Since most of the credit portfolios of commercial banks consist of loans to borrowers in such conditions, these will be the type of models considered in this research. Although credit scoring has well known disadvantages2, it remains as the most effective and widely used methodology for the evaluation of privately-held firms’ risk profiles.
The corporate credit scoring literature as grown extensively since Beaver (1966) and Altman (1968) proposed the use of Linear Discriminant Analysis (LDA) to predict firm bankruptcy. On the last decades, discrete dependent variable econometric models, namely logit or probit models, have been the most popular tools for credit scoring. As Barniv and McDonald (1999) report, 178 articles in accounting and finance journals between 1989 and 1996 used the logit model. Ohlson (1980) and Platt & Platt (1990) present some early interesting studies using the logit model. More recently Laitinen (1999) used automatic selection procedures to select the set of variables to be used in logistic and linear models which then are thoroughly tested out-of-sample. The most popular commercial application using logistic approach for default estimation is the Moody’s KMV RiskCalc Suite of models developed for several countries3. Murphy et al (2002) presents the RiskCalc model for Portuguese
private firms. In recent years, alternative approaches using non-parametric methods have been developed. These include classification trees, neural networks, fuzzy algorithms and k-nearest neighbor. Although some studies report better results for the non-parametric methods, such as in Galindo & Tamayo (2000) and Caiazza (2004), I will only consider logit/probit models since the estimated parameters are more intuitive, easily interpretable and the risk of over-fitting to the sample is lower. Altman, Marco & Varetto (1994) and Yang et al (1999) present some evidence, using several types of neural network models, that these do not yield superior results than the classical models. Another potential relevant extension to traditional credit modeling is the inference on the often neglected rejected data. Boyes et al (1989) and Jacobson & Roszbach (2003) have used bivariate probit models with sequential events
2 See, for example, Allen (2002). 3 See Dwyer et al (2004).
1. INTRODUCTION 3 to model a lender’ decision problem. In the first equation, the decision to grant the loan or not is modeled and, in the second equation, conditional on the loan having been provided, the borrowers’ ability to pay it off or not. This is an attempt to overcome a potential bias that affects most credit scoring models: by considering only the behavior of accepted loans, and ignoring the rejected applications, a sample selection bias may occur. Kraft et al (2004) derive lower and upper bounds for criteria used to evaluate rating systems assuming that the bank storages only data of the accepted credit applicants. Despite the findings in these studies, the empirical evidence on the potential benefits of considering rejected data is not clear, as supported in Crook & Banasik (2004).
The first main objective of this research is to develop an empirical application of credit risk modeling for privately held corporate firms. This is achieved through a simple but powerful quantitative model built on real data drawn randomly from the database of one of the major Portuguese commercial banks. The output of this model will then be used to classify firms into rating classes, and to assign a probability of default for each one of these classes. Although a purely quantitative rating system is not fully compliant with the New Basel Capital Accord (NBCA)4, the methodology applied could be regarded as a building block for a fully compliant system.
The remainder of this study is structured as follows: Section 2 describes the data and explains how it was extracted from the bank’s database;
Section 3 presents the variables considered and their univariate relationship with the default event. These variables consist of financial ratios that measure Profitability, Liquidity, Leverage, Activity, Debt Coverage and Productivity of the firm. Factors that exhibit a weak or unintuitive relationship with the default frequency will be eliminated and factors with higher predictive power for the whole sample will be selected;
Section 4 combines the most powerful factors selected on the previous stage in a multivariate model that provides a score for each firm. Two alternatives to a simple
4 For example, compliant rating systems must have two distinct dimensions, one that reflects the risk of
borrower default and another reflecting the risk specific to each transaction (Basel Committee on Banking Supervision 2003, par. 358). The system developed in this study only addresses the first dimension. Another important drawback of the system presented is the absence of human judgment. Results from the credit scoring models should be complemented with human oversight in order to account for the array of relevant variables that are not quantifiable or not included in the model (Basel Committee on Banking Supervision 2003, par. 379).
1. INTRODUCTION 4 regression will be tested. First, a multiple equation model is presented that allows for alternative specifications across industries. Second, a weighted model is developed that balances the proportion of regular and default observations on the dataset, which could be helpful to improve the discriminatory power of the scoring model, and to better aggregate individual firms into rating classes;
Section 5 provides validation and comparison of the models presented in the previous section. All considered models are screened for statistical significance, economic intuition, and efficiency (defined as a parsimonious specification with high discriminatory power);
In Section 6 two alternative rating systems are developed, using the credit scores estimates from the previous section. A first alternative will be to group individual scores into clusters, and a second to indirectly derive rating classes through a mapping procedure between the resulting default frequencies and an external benchmark; Section 7 derives the capital requirements for an average portfolio under the NBCA, and compares them to the results under the current capital accord.
5
2 Data
Considerations
A random sample of 11.000 annual, end-of-year corporate financial statements was extracted from the financial institution’s database. These yearly statements belong to 4.567 unique firms, from 1996 to 2000, of which 475 have had at least one defaulted5 loan over a given year.
Furthermore, a random sample of 301 observations for the year 2003 was extracted in order to perform out-of-time / out-of-sample testing. About half of the firms in this testing sample are included in the main sample, while the other half corresponds to new firms. In addition, it contains 13 defaults, which results in a similar default ratio to that of the main sample (about 5%). Finally, the industry distribution is similar to the one in the main sample (see Figure 2 below).
Due to the specificity of their financial statements, firms belonging to the financial or real-estate industries were not considered. Furthermore, due to their non-profit nature, firms owned by public institutions were also excluded.
The only criteria employed when selecting the main dataset was to obtain the best possible approximation to the industry distribution of the Portuguese economy. The objective was to produce a sample that could be, as best as possible, representative of the whole economy, and not of the bank’s portfolio. If this is indeed the case, then the results of this study can be related to a typical, average credit institution operating in Portugal.
Figure 1 shows the industry distribution for both the Portuguese economy6 and for the study dataset. The two distributions are similar, although the study sample has a higher concentration on industry D – Manufacturing, and lower on H – Hotels & Restaurants and MNO – Education, Health & Other Social Services Activities.
5 A loan is considered defaulted if the client missed a principal or interest payment for more than 90
days.
2. DATA CONSIDERATIONS 6
0% 5% 10% 15% 20% 25% 30% 35% 40% 45%
A B C D E F G H I K MNO
Portuguese Economy Main Sample Data
Figure 1 – Economy-Wide vs. Main Sample Industry Distribution
Figures 2, 3 and 4 display the industry, size (measured by annual turnover) and yearly distributions respectively, for both the default and non-default groups of observations of the dataset.
0% 5% 10% 15% 20% 25% 30% 35% 40% 45%
A B C D E F G H I K MNO
Main Sample - Regular Main Sample - Defaults Testing Sample - Total Figure 2 – Sample Industry Distribution
2. DATA CONSIDERATIONS 7
0% 5% 10% 15% 20% 25% 30% 35%
1996 1997 1998 1999 2000
Main Sample - Regular Main Sample - Defaults Main Sample - Totals Figure 3 – Accounting Statement Yearly Distribution
0% 2% 4% 6% 8% 10% 12% 14% 16% 18% 20%
1 2 3 4 5 6 7 10 15 20 30 40 50 60 70 More
Sample Data - Regulars Sample Data - Defaults Sample Data - Totals Figure 4 – Size (Turnover) Distribution, Millions of Eur
Analysis of industry distribution (Figure 2) suggests high concentration on industries
G – Trade and D – Manufacturing, both accounting for about 75% of the whole sample. The industry distributions for both default and non-default observations are very similar.
Figure 3 presents more uniformly distributed observations per year, for the last three periods, with about 3.000 observations per year. For the regular group of observations, the number of yearly observations rises steadily until the third period, and the remains constant until the last period. For the default group, the number of
2. DATA CONSIDERATIONS 8 yearly observations has a great increase in the second period and clearly decreases in the last.
Regarding size distribution, analysis of Figure 4 indicates that most of the observations belong to the Small and Medium size Enterprises - SME segment, with annual turnover up to 40 million Eur. The SME segment accounts for about 95% of the whole sample. The distributions of both regular and default observations are very similar.
9
3
Financial Ratios and Univariate Analysis
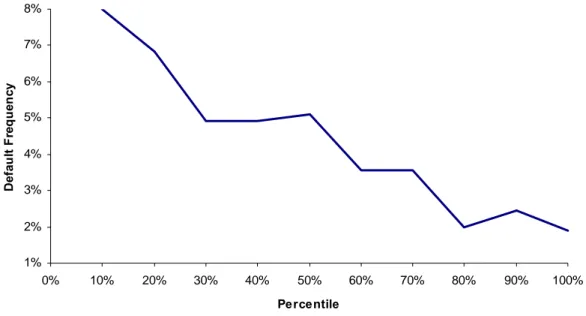
A preliminary step before estimating the scoring model will be to conduct an univariate analysis for each potential input, in order to select the most intuitive and powerful variables. In this study, the scoring model will consider exclusively financial ratios as explanatory variables. A list of twenty-three ratios representing six different dimensions – Profitability, Liquidity, Leverage, Debt Coverage, Activity and Productivity – will be considered. The univariate analysis is conducted between each of the twenty-three ratios and a default indicator, in order to assess the discriminatory power of each variable. Appendix 1 provides the list of the considered variables and their respective formula. Figures 5 to 10 provide a graphical description, for some selected variables, of the relationship between each variable individually and the default frequency7.
2% 3% 4% 5% 6%
0% 10% 20% 30% 40% 50% 60% 70% 80% 90% 100%
Percentile
D
efa
ul
t F
re
q
u
enc
y
Figure 5 – Univariate Relationship Between Variable R7 and Default Frequency
7 The data is ordered ascendingly by the value of each ratio and, for each decile, the default frequency
3. FINANCIAL RATIOS AND UNIVARIATE ANALYSIS 10
3% 4% 5% 6%
0% 10% 20% 30% 40% 50% 60% 70% 80% 90% 100%
Percentile
D
efa
ul
t Fr
eque
n
cy
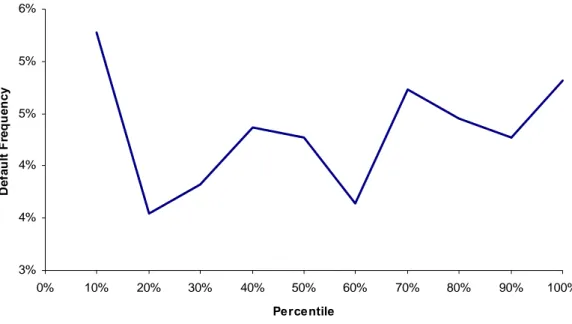
Figure 6 – Univariate Relationship Between Variable R8 and Default Frequency
2% 3% 4% 5% 6%
0% 10% 20% 30% 40% 50% 60% 70% 80% 90% 100%
Percentile
D
efa
ul
t Fr
eque
n
cy
3. FINANCIAL RATIOS AND UNIVARIATE ANALYSIS 11
1% 2% 3% 4% 5% 6% 7% 8%
0% 10% 20% 30% 40% 50% 60% 70% 80% 90% 100%
Percentile
D
efa
ul
t Fr
eque
nc
y
Figure 8 – Univariate Relationship Between Variable R17 and Default Frequency
0% 1% 2% 3% 4% 5% 6% 7% 8% 9% 10% 11% 12%
0% 10% 20% 30% 40% 50% 60% 70% 80% 90% 100%
Percentile
D
ef
aul
t Fr
eque
nc
y
3. FINANCIAL RATIOS AND UNIVARIATE ANALYSIS 12
2% 3% 4% 5% 6% 7% 8%
0% 10% 20% 30% 40% 50% 60% 70% 80% 90% 100%
Percentile
D
efa
ul
t Fr
eq
u
enc
y
Figure 10 – Univariate Relationship Between Variable R23 and Default Frequency
In order to have a quantitative assessment of the discriminating power of each variable, the Accuracy Ratio8 was used. The computed values of the Accuracy Ratios are reported in Appendix 1.
The variables selected for the multivariate analysis comply with the following criteria: - They must have discriminating power, with an Accuracy Ratio higher than
5%;
- The relationship with the default frequency should be clear and economically intuitive. For example, ratio 3 should have a negative relationship with the default frequency, since firms with a high percentage of EBITDA over Turnover should default less frequently. Analyzing Figure 11, there seems to be no clear relationship for this dataset;
- The number of observations lost due to lack of information on any of the components of a given ratio must be insignificant. Not all firms report the exact same items on their accounting reports, for example, ratios 12 and 18 have a significant amount of missing data for the components Debt to Credit Institutions and Long-Term Liabilities respectively.
3. FINANCIAL RATIOS AND UNIVARIATE ANALYSIS 13
3% 4% 4% 5% 5% 6%
0% 10% 20% 30% 40% 50% 60% 70% 80% 90% 100%
Percentile
D
ef
aul
t Fr
eque
nc
y
Figure 11 – Univariate Relationship Between Variable R3 and Default Frequency
At this point, nine variables were eliminated and will not be considered on the multivariate analysis. All the remaining variables were standardized in order to avoid scaling issues.
14
4 Scoring
Model
The variables selected on the previous stage were pooled together in order to obtain a model that is at the same time:
- Parsimonious but powerful: high discriminating power with few parameters to estimate;
- Statistically significant: all variables individually and the model as a whole must be significant, with low correlation between the variables;
- Intuitive: the sign of the estimated parameters should make economic sense and the selected variables should represent the various relevant risk factors. Using both forward and backward procedures, the selected model is the one that complies with the above criteria and has the higher discriminating power, measured by the Accuracy Ratio.
The dependent variable Yit of the model is the binary discrete variable that indicates
whether firm i has defaulted or not in year t. The general representation of the model is:
(
, 1)
k it k it it
Y = f β X − +e
where k1 it
X − represents the values of the k explanatory variables of firm i, one year before the evaluation of the dependent variable. The functional form selected for this study was the Logit model9. Alternative specifications could be considered, such as Probit, Linear Probability Model or even Genetic Algorithms, though there is no evidence in the literature that any alternative specification can consistently outperform the Logit specification in credit default prediction (Altman, Marco & Varetto 1994 and Yang et al 1999).
During the model estimation two hypotheses were tested:
1. Whether a system of unrelated equations, by industry group yields better results than a single-equation model for all industries;
4. SCORING MODEL 15 2. Whether a model where the observations are weighted in order to increase the
proportion of defaults to regulars in the estimation sample, performs better than a model with unweighted observations.
4.1 Multiple Industry Equations vs. Single Equation Model
In order to test this hypothesis, the dataset was broken into two sub-samples: the first one for Manufacturing & Primary Activity firms, with 5.046 observations of which 227 are defaults; and the second for Trade & Services firms, with 5.954 observations and 248 defaults. If the nature of these economic activities has a significant and consistent impact on the structure of the accounting reports, then it is likely that a model accommodating different variables for the different industry sectors performs better10 than a model which forces the same variables and parameters to all firms across industries. The estimated models are:
( )
( )
ˆ exp ˆ ˆ 1 exp i i i Y µ µ = +For the two-equation model, ˆ
' if belongs to industry I ˆ
ˆ
' if belongs to industry II i I i i II X i X i β µ β ⎧⎪ = ⎨ ⎪⎩
For the single-equation model,
ˆ ˆi Xi' i
µ = β ∀
For the final model, the selected variables and estimated coefficients are presented in the table below11:
10 Model performance is measured by the ability to discriminate between default and regular
populations, which can be summarized by the Accuracy Ratio.
4. SCORING MODEL 16 Two-Equation Model (A)
Industry I Industry II
Single-Equation Model (B) Variable β^ Variable β^ Variable β^
R7 -0.381 R8 -0.212 R8 -0.171
R17 -0.225 R9 -0.160 R9 -0.211
R20_1 2.011 R17 -0.184 R17 -0.231
R20_2 -0.009 R20_1 1.792 R20_1 1.843
R23 0.200 R20_2 -0.009 R20_2 -0.009
K -3.259 K -3.426 R23 0.124
- - - - K -3.250
Table 1 – Estimated Model Variables & Parameters, Models A & B
The estimated Accuracy Ratio for the two-equation model is 43,75%, which is slightly worse than the Accuracy Ratio of the single-equation model, 43,77%12. The out-of-sample results confirm this tendency, the AR of the two-equation model is 46,07%, against 50,59% of the single-equation model although, as shown latter, this difference is not statistically significant.
Since the two-equation model involves more parameters to estimate and is not able to better discriminate to a significant extent the default and regular populations of the dataset, the single-equation specification is considered superior in terms of scoring methodology for this dataset.
4.2 Weighted vs. Unweighted Model
The proportion of the number of defaults (450) to the total number of observations in the sample (11.000) is artificially high. The real average annual default frequency of the bank’s portfolio and the Portuguese economy is significantly lower than the 4,32% suggested by the sample for the corporate sector. However, in order to be able to correctly identify the risk profiles of “good” and “bad” firms, a significant number of observations for each population is required. For example, keeping the total number of observations constant, if the correct default rate was about 1%, extracting a random sample in accordance to this ratio would result in a proportion of 110 default observations to 11.000 observations.
4. SCORING MODEL 17 A consequence of having an artificially high proportion of default observations is that the estimated scores cannot be directly interpreted as real probabilities of default. Therefore, these results have to be calibrated in order to obtain default probabilities estimates.
A further way to increase the proportion of the number of default observations is to attribute different weights to the default and regular observations. The weightening of observations could potentially have two types of positive impact in the analysis:
1. As mentioned above, a more balanced sample, with closer proportions of defaults and regular observations, could help the Logit regression to better discriminate between both populations;
2. The higher proportion of default observations results in higher estimated scores. As a consequence, the scores in the weighed model are more evenly spread throughout the ]0,1[ interval (see Figure 12). If, in turn, these scores are used to group the observations into classes, then it could be easier to identify coherent classes with the weighed model scores. Thus, even if weightening the observations does not yield a superior model in terms of discriminating power, it might still be helpful later in the analysis, when building the rating classes.
0% 10% 20% 30% 40% 50% 60% 70% 80% 90% 100%
Score
O
b
ser
vat
io
n
Unw eighted Model Score Weighted Model Score Figure 12 – Weighted vs. Unweighted Score
The weighed model estimated considers a proportion of one default observation for two regular observations. The weighed sample consists of 1425 observations, of
4. SCORING MODEL 18 which 475 are defaults and the remaining 950 are regular observations13. The
optimized model selects the same variables has the unweighted model though with different estimated coefficients:
Weighted Model (C) Unweighted Model (B) Variable B Variable B R8 -0.197 R8 -0.171 R9 -0.223 R9 -0.211 R17 -0.203 R17 -0.231 R20_1 1.879 R20_1 1.843 R20_2 -0.009 R20_2 -0.009 R23 0.123 R23 0.124 K -0.841 K -3.250
Table 2 – Estimated Model Variables & Parameters, Models B & C
The estimated Accuracy Ratio for the weighed model is 43,74%, marginally worse than the 43,77% of the unweighted model. Again, the out-of-sample results confirm that the weighted model does not have a higher discriminating power (AR of 48,29%) than the unweighted model (AR of 50,59%).
The following section analyses the validation and comparison of the different estimated models in more detail.
19
5 Model
Validation
As mentioned before, all three models – the two-equation model (Model A), the single-equation unweighted model (Model B) and the single-equation weighed model (Model C) – should be, at the same time, efficient, statistically significant and intuitive.
5.1 Efficiency
All three models have a small number of selected variables: Model A five variables for each equation, and models B and C six variables each. A model with high discriminatory power is a model that can clearly distinguish the default and non-default populations. In other words, it is a model that makes consistently “good” predictions relative to few “bad” predictions. For a given cut-off value14, there are two types of “good” and “bad” predictions:
Estimated
Non-Default Default Non-Default True (Type II Error) False Alarm
Obser
ved
Default Miss (Type I Error) Hit
The “good” predictions occur if, for a given cut-off point, the model predicts a default and the firm does actually default (Hit), or, if the model predicts a non-default and the firm does not default in the subsequent period (True).
The “bad” prediction occurs if, for a given cut-off point, the model predicts a default and the firm does not actually defaults (False-Alarm or Type II Error), or if the model predicts a non-default and the firm actually defaults (Miss or Type I Error).
14 The cut-off point is the value from which the observations are classified as “good” or “bad”. For
example, given a cut-off point of 50%, all observations with an estimated score between 0% and 50% will be classified as “good”, and those between 50% and 100% will be considered “bad”.
5. MODEL VALIDATION 20 The Hit Ratio (HR) corresponds to the percentage of defaults from the total default population that are correctly predicted by the model, for a given cut-off point.
The False Alarm Ratio (FAR) is the percentage of False Alarms or incorrect default predictions from the total non-defaulting population, for a given cut-off point.
Several alternatives could have been considered in order to analyze the discriminating power of the estimated models. In this study, both ROC/CAP analysis and Kolmogorov-Smirnov (KS) analysis were performed:
Receiver Operating Characteristics (ROC) and Cumulative Accuracy Profiles (CAP) curves are two closely related graphical representations of the discriminatory power of a scoring system. Using the notation from Sobehart & Keenan (2001), the ROC curve is a plot of the HR against the FAR, while the CAP curve is a plot of the HR against the percentage of the sample.
For the ROC curve, a perfect model would pass through the point (0,1) since it always makes “good” predictions, and never “bad” predictions (it has FAR = 0% and a HR = 100% for all possible cut-off points). A “naïve” model is not able to distinguish defaulting from non-defaulting firms, thus will do as many “good” as “bad” predictions, though for each cut-off point, the HR will be equal to the FAR. A better model would have a steeper curve, closer to the perfect model, thus a global measure of the discriminant power of the model would be the area under the ROC curve. This can be calculated has15:
1 0
( ) ( )
AUROC=
∫
HR FAR d FARFor the CAP or Lorenz curve, a perfect model would attribute the lowest scores to all the defaulting firms, so if x% of the total population are defaults, then the CAP curve of a perfect model would pass through the point (x,1). A random model would make as many “good” as “bad” predictions, so for the y% lowest scored firms it would have a HR of y%. Then, a global measure of the discriminant power of the model, the Accuracy Ratio (AR), compares the area between the CAP curve of the model being tested and the CAP of the random model, against the area between the CAP curve of the perfect model and the CAP curve of the random model.
5. MODEL VALIDATION 21 It can be shown16 that there is a linear relationship between the global measures resulting from the ROC and CAP curves:
(
)
2* 0.5
AR= AUROC−
The KS methodology17 considers the distance between the distributions of 1 – HR (or Type I Errors) and 1 – FAR (or True predictions). The higher the distance between the two distributions, the better the discriminating power of the model. The KS statistic corresponds to the maximum difference for any cut-off point between the 1 – FAR
and 1 – HR distributions.
Analyzing Figures 13 to 20, we can conclude that all three models have significant discriminating power and have similar performances. Results for Altman’s Z’-Score Model for Private Firms (Altman 2000) are also reported as a benchmark (Model D):
0% 10% 20% 30% 40% 50% 60% 70% 80% 90% 100%
0% 10% 20% 30% 40% 50% 60% 70% 80% 90% 100%
FAR
HR
Model A Model B Model C Model D Random Model Figure 13 – Receiver Operating Characteristics Curves
16 See, for example, Engelmann, Hayden & Tasche (2003).
17 The Kolmogorov-Smirnov statistic is a non-parametric statistic used to test whether the density
5. MODEL VALIDATION 22
0% 10% 20% 30% 40% 50% 60% 70% 80% 90% 100%
0% 10% 20% 30% 40% 50% 60% 70% 80% 90% 100%
% of Sample
HR
Perfect Model Model A Model B Model C Model D Radom Model Figure 14 – Cumulative Accuracy Profiles Curves
0% 10% 20% 30% 40% 50% 60% 70% 80% 90% 100%
0% 5% 10% 15% 20% 25% 30% 35%
Score %
C
u
m
m
u
lat
ive F
req
u
en
cy
1-FAR (1-Type II Error) 1-HR (Type I Error) Figure 15 – Model A: Kolmogorov-Smirnov Analysis
5. MODEL VALIDATION 23
0% 10% 20% 30% 40% 50% 60% 70% 80% 90% 100%
0% 5% 10% 15% 20% 25% 30% 35%
Score, %
Erro
r,
%
1-HR (Type I) FAR (Type II) Figure 16 – Model A: Types I & II Errors
0% 10% 20% 30% 40% 50% 60% 70% 80% 90% 100%
0% 5% 10% 15% 20% 25% 30% 35%
Score %
C
u
m
m
u
la
ti
ve F
req
u
en
cy
1-FAR (1-Type II Error) 1-HR (Type I Error) Figure 17 – Model B: Kolmogorov-Smirnov Analysis
5. MODEL VALIDATION 24
0% 10% 20% 30% 40% 50% 60% 70% 80% 90% 100%
0% 5% 10% 15% 20% 25% 30% 35%
Score, %
Erro
r,
%
1-HR (Type I) FAR (Type II) Figure 18 – Model B: Types I & II Errors
0% 10% 20% 30% 40% 50% 60% 70% 80% 90% 100%
0% 10% 20% 30% 40% 50% 60% 70% 80% 90%
Score %
C
u
m
m
u
lat
ive F
req
u
en
cy
1-FAR (1-Type II Error) 1-HR (Type I Error) Figure 19 – Model C: Kolmogorov-Smirnov Analysis
5. MODEL VALIDATION 25
0% 10% 20% 30% 40% 50% 60% 70% 80% 90% 100%
0% 10% 20% 30% 40% 50% 60% 70% 80% 90%
Score, %
E
rro
r,
%
1-HR (Type I) FAR (Type II) Figure 20 – Model C: Types I & II Errors
The results for both ROC/CAP analysis and KS analysis are summarized in the table below (Model D is the Z’-Score):
Main Sample Out-of-Sample
AUROC σAUROC AR KS AUROC σAUROC AR A 71.88% 1.15% 43.75% 32.15% 73.04% 7.53% 46.07% B 71.88% 1.15% 43.77% 32.97% 75.29% 6.55% 50.59% C 71.87% 1.15% 43.74% 32.94% 74.15% 6.88% 48.29% D 62.53% 1.25% 25.07% 19.77% 61.11% 6.87% 22.22%
Table 3 – AUROC, AR and KS Statistics
A more rigorous comparison of the discriminating power of the models can be obtained through a statistical test for the difference between the estimated AUROC’s of the different models18. The results of applying this test to the differences between all models for both samples are given in the following table:
5. MODEL VALIDATION 26 Main Sample Out-of-Sample
Test
θi - θj σ (θi - θj) P-Value θi - θj σ (θi - θj) P-Value A - B -0.0089% 0.2225% 96.83% -2.2571% 2.8844% 43.39% A - C 0.0053% 0.2372% 98.23% -1.1086% 2.7449% 68.63% A - D 9.3425% 1.7807% 0.00% 11.9256% 7.7745% 12.50% B - C 0.0141% 0.0476% 76.68% 1.1485% 0.5115% 2.47% B - D 9.3514% 1.7788% 0.00% 14.1827% 6.7577% 3.58% C - D 9.3372% 1.7751% 0.00% 13.0342% 7.0051% 6.28%
Table 4 – Testing the Differences between AUROC’s
The results indicate that for both samples, Models A, B and C have similar discriminating power, and all three perform significantly better that the Z’-Score model.
5.2 Statistical
Significance
All estimated regressions were subject to a variety of statistical tests, in order to ensure the quality of the results at several levels:
i. Residual Analysis was performed with the purpose of testing the distributional assumption of the errors of the regression. Although the logistic regression assumes that the errors follow a binomial distribution, for large samples (such as the one in this study), it approximates the normal distribution. The standardized residuals19 from the logistic regressions should then follow a
standard normal distribution. At this stage, severe outliers were identified and eliminated. These outliers are observations for which the model fits poorly (has an absolute studentized residual20 greater than 2), and that can have a very large influence on the estimates of the model (a large DBeta21).
ii. The significance of each estimated coefficient was tested using the Wald test. This test compares the maximum likelihood value of the estimated coefficient to the estimate of its standard error. This test statistic follows a standard normal distribution under the hypothesis that the estimated coefficient is null.
19 The standardized residuals correspond to the residuals adjusted by their standard errors. This
adjustment is made in logistic regression because the error variance is a function of the conditional mean of the dependent variable.
20 The studentized residual corresponds to the square root of the change in the -2 Log Likelihood of the
model attributable to deleting the case from the analysis. It follows an asymptotical normal distribution and extreme values indicate a poor fit.
21 DBeta is an indicator of the standardized change in the regression estimates obtained by deleting an
5. MODEL VALIDATION 27 For the three models, all of the estimated coefficients are significant at a 90% significance level.
iii. In order to test the overall significance of each estimated model, the Hosmer and Lemeshow test was used. This goodness-of-fit test compares the predicted outcomes of the logistic regression with the observed data by grouping observations into risk deciles. From the analysis of Figures 21 to 23 we can conclude that the estimated logistic regressions significantly fit the observed data. 0 20 40 60 80 100 120 140
1 2 3 4 5 6 7 8 9 10
Group # o f O b se rv at io n s 850 900 950 1000 1050 1100 1150
Observed Defaults Expected Defaults Observed Regulars Expected Regulars
Figure 21 – Model A: Hosmer-Lemeshow Test
0 20 40 60 80 100 120 140
1 2 3 4 5 6 7 8 9 10
Group # o f O b ser va ti o n s 850 900 950 1000 1050 1100 1150
Observed Defaults Expected Defaults Observed Regulars Expected Regulars
5. MODEL VALIDATION 28 0 10 20 30 40 50 60 70 80 90 100
1 2 3 4 5 6 7 8 9 10
Group # o f O b ser vat io n s 0 20 40 60 80 100 120 140 160
Observed Defaults Expected Defaults Observed Regulars Expected Regulars
Figure 23 – Model C: Hosmer-Lemeshow Test
iv. After selecting the best linear model, the assumption of linearity between each variable and the logit of the dependent variable was checked. This was performed in four stages:
1- The Box-Tidwell test (Box-Tidwell 1962) was performed on all continuous variables, in order to confirm the linearity assumption;
2- For all variables that failed the linearity test in the previous step, a plot of the relationship between the covariate and the logit is presented, allowing to investigate the type of non-linear relationship;
3- For all continuous variables with significant non-linear relationships with the logit, the fractional polynomial methodology is implemented (Royston and Altman 1994) in order to adequately capture the true relationship between the variables;
4- Check whether the selected transformation makes economic sense; v. The last assumption to be checked was the independence between the
independent variables. If multicolinearity is present, the estimated coefficients will be unbiased but their estimated standard errors will tend to be large. In order to test for the presence of high multicolinearity, a linear regression model using the same dependent and independent variables is estimated, and the tolerance statistic22 is calculated for each independent variable. If any of
22 The tolerance statistic corresponds to the variance in each independent variable that is not explained
5. MODEL VALIDATION 29 the tolerance statistics are below 0,20 then it is assumed that we are in the presence of high multicolinearity, and the estimated regression is discarded.
5.3 Economic
Intuition
All estimated coefficients follow economic intuition in the sense that the sign of the coefficients indicates the expected relationship between the selected variable and the default frequency. For example, in Model C the estimated coefficient for variable R23 is +0.123, this means that the higher the Personnel Costs relative to the Turnover the higher the estimated credit score of the firm. In other words, firms with lower labor productivity have higher credit risk. A similar rationale can be applied to all variables presented on Tables 1 and 2 above. The relationships suggested by all the estimated coefficients and respective signs are all in accordance to economic intuition.
For the non-linear relationships it is best to observe graphically the estimated relationship between the independent variable and the logit of the dependent (see Figure 24 in section 5.4). For all four estimated regressions, this relationship is clear: there is a positive relationship between the variable R20 and the estimated default frequency. The only difference is that the intensity of this relationship is not constant, it depends on the level of the independent variable.
5.4 Analysis of the Results
In Appendix 4, the final results of the estimations are presented for all three models: the two-equation model (Model A), the unweighted single-equation model (Model B) and the weighted single-equation model (Model C). The first step to obtain each model was to find the best linear combination through backward and forward selection procedures. The estimation equation that complied with both economic intuition and positive statistical diagnosis (described in steps i. to iii. of section 5.2), and had the higher discriminating power was considered the optimal linear model. The second step was to check for non-linear relationships between the independent variables and the logit of the dependent. Results indicate that for all four selected linear regressions, there is a clear non-linear relationship between variable R20 and the logit of the dependent variable. In order to account for this fact, the procedure
5. MODEL VALIDATION 30 described in step iv. of section 5.2 was implemented. The resulting non-linear relationship for the four regressions is illustrated in Figure 24 below:
-6 -5 -4 -3 -2 -1 0
0 1 2 3 4 5 6
Var 20
Lo
gi
t
Low ess Var 20 Multivariate Model A Multivariate Model B Multivariate Model C
Figure 24 – Plot of the Univariate Smoothed Lowess Logit vs. Multivariate Fractional Polynomial Adjustment of Var. 20
After the optimal non-linear regressions are selected, a final test for multicolinearity was implemented. Only the Trade & Services regression of the two-equation model presented signs of severe multicolinearity. Since there is no practical method to correct this problem, the model was discarded and the second best model suggested by the fractional polynomial procedure was selected. This alternative specification does not suffer from multicolinearity, as it can be observed in the results presented in Appendix 423.
In short, the modeling procedure consisted on selecting the best discriminating regression from a pool of possible solutions that simultaneously complied with economic and statistical criteria.
23 In order to ensure stability of the final results, the whole modeling procedure was repeated with
several random sub-samples of the main dataset. Across all sub-samples the variables selected for each model were the same, the values of the estimated coefficients were stable, and the estimated AR’s were similar.
31
6
Quantitative Rating System and Probability of
Default Estimation
The scoring output provides a quantitative assessment of the credit quality of each firm. Rating classes can be built through a partition of the scoring scale into k groups. A default frequency can, in turn, be estimated for each partition, dividing the number of default observations by the total number of observations for each rating class. Furthermore, these default frequencies can be leveled in order to allow for the global default rate of the dataset to be similar to the projected default rate of the universe. These adjusted default frequencies represent the Probability of Default (PD) estimates of the quantitative rating system for each rating class. In light of the NBCA, these can be interpreted as an approximation to the long-run averages of one-year realized default rates for the firms in each rating class24.
The quantitative rating system presented in this section is not directly comparable to the traditional rating approaches adopted by the rating agencies. The two main differences between the systems are the scope of the analysis and the volatility of the rating classes. Regarding the scope of the analysis, the system developed in this study is concerned with only one risk dimension, the probability of default. Ratings issued by the agencies address not just obligor risk but the facility risk as well. The other major difference is related to the time horizon, the quantitative system has a specific one-year time horizon, with high volatility subject to economic cycle fluctuations. The agencies approach is to produce through-the-cycle ratings, with unspecific, long-term time horizon. Cantor and Packer (1994) provide a description of the rating methodologies for the major rating agencies, while Crouhy et al (2001) present the major differences between the internal rating system of a bank and the rating systems of two major credit rating agencies.
Regarding the quantitative rating system, two alternative methodologies were employed in order to obtain the optimal boundaries for each rating class. The goal is for the rating system to be simultaneously stable and discriminatory. A stable rating
6. QUANTITATIVE RATING SYSTEM & PD ESTIMATION 32 system is one with infrequent transitions, particularly with few ample transitions25. A discriminatory rating system is a granular system with representative and clear distinct classes, in terms of the frequency of default that should increase monotonically from high to low rating classes.
The first methodology employed consists on obtaining coherent rating classes through the use of cluster analysis on the scoring estimates. The second methodology was devised as an optimization problem that attempts to map the historical default frequencies of rating agency whole letter obligor ratings.
6.1 Cluster
Methodology
Clustering can be described as a grouping procedure that searches for a “natural” structure within a dataset. It has been used thoroughly in a wide range of disciplines as a tool to develop classification schemes. The observations in the sample are reduced to k groups in a way that within each group, these observations are as close as possible to each other than to observations in any other group.
Due to the large number of observations, a K-Means algorithm was implemented26. In order to determine the optimal number of clusters, the Calinski & Harabasz (1974) method was used. This index has been repeatedly reported in the literature as one of the best selecting procedures (Milligan & Cooper 1985). The index is calculated as:
( )
(
)
(
)
(
)
(
)
2 1 2 1 1( ) / 1
/ 1 / ( ) / k i i i k n
i ij i i j
n Y Y k
BSS k CL k
WSS k n n Y Y n k
= = = − − − = = − − −
∑
∑∑
where BSS is the Between Sum-of-Squares; WSS the Within Sum-of-Squares; k the number of clusters; n the number of observations; Yij estimated score for observation j
in cluster i.
The optimal k is the one that maximizes the value of CL(k), since it will be at this point that the relative variance between groups respective to the variance within the groups will be higher.
25 An ample transition is a rating upgrade/downgrade involving several rating notches. For example, if
a firms has a downgrade from Aaa to Caa in just one period.
6. QUANTITATIVE RATING SYSTEM & PD ESTIMATION 33 The cluster analysis was performed on the scoring estimates of the three models estimated previously. Table 5 reports the CL(k) index for k = 2 up to k= 20:
k Model A Model B Model C 2 25,092 25,644 28,240 3 30,940 32,046 36,176 4 35,105 36,854 44,639 5 39,411 42,252 50,774 6 43,727 45,889 58,179 7 48,015 51,642 65,751 8 54,666 49,930 72,980 9 55,321 56,529 77,201 10 61,447 62,321 86,546 11 55,297 57,629 93,152 12 62,620 63,913 95,021 13 69,788 71,726 104,821 14 65,603 78,093 110,153 15 73,152 73,530 116,503 16 78,473 75,129 126,060 17 74,141 84,335 129,162 18 79,710 82,801 138,090 19 75,293 78,527 138,461 20 79,154 87,544 134,544 Table 5 - CL(k) index for k = 2 up to k = 20
For Model A, the optimal number of clusters is 18, for Model B 20, and for Model C 19. In order to directly compare the resulting rating systems, classes were aggregated into k = 727. This class aggregation was performed taking in consideration both stability and discriminatory criteria. Figures 25 and 26 present the distribution of the default frequency and of the number of observations by rating class, for each model:
27K = 7 is the minimum number of classes recommended in the NBCA (Basel Committee on Banking
Supervision 2003, par. 366) and it is also the number of whole letter rating classes of the major rating agencies.
6. QUANTITATIVE RATING SYSTEM & PD ESTIMATION 34
0% 1% 2% 3% 4% 5% 6% 7%
Aaa Aa A Baa Ba B Caa
Model A Model B Model C
Figure 25 – Default Frequency by Rating Class (Cluster Method)
0% 5% 10% 15% 20% 25% 30% 35%
Aaa Aa A Baa Ba B Caa
Model A Model B Model C
Figure 26 – Number of Observations Distribution by Rating Class (Cluster Method) Results in Figure 25 are similar across all three models, the default frequency rises from lower to higher risk ratings (only exception being the inflection point for Model A between classes Aa and A), although this rise is only moderate. The defaulted frequencies reported are calibrated frequencies that, as mentioned before, can be interpreted has the actual PD estimates for each rating class. Since the dataset was
6. QUANTITATIVE RATING SYSTEM & PD ESTIMATION 35 biased towards the default observations, the resulting default frequencies were leveled so that the overall default ratio would equal 1,5%28.
Regarding the distribution of observations (Figure 26 above), it is interesting to observe that the three models that have in so far presented very similar results actually produce clearly distinct rating classes. Model A suggests a more uniformly distributed system, with only the lowest rating class having fewer observations. Model B presents a distribution more concentrated on the higher rating classes, while Model C presents a more orthodox distribution, with higher concentration on the middle ratings and lower weight on the extremes.
With the assumptions made, for the cluster methodology, Model B is the one that presents the less attractive rating system: it is not able to better discriminate between rating classes in terms of default frequency to a significant extent, and it assigns very high ratings too often. Models A and C rating systems have a similar discriminating power, although the rating distribution suggested by Model C is the one closer to what should be expected from a balanced portfolio. Thus the empirical evidence seems to corroborate the hypothesis advanced in section 4.2, the weighting of the sample for the scoring model is helpful in order to identify coherent classes through a cluster methodology.
6.2 Historical / Mapping Methodology
The second methodology tested consists on defining the class boundaries in such a way that the resulting default frequencies for each class (after calibration) would approximate as best as possible a chosen benchmark. For this study, the benchmark used was Moody’s historical one-year default frequencies for corporate whole rating grades. Table 4 provides descriptive statistics for the Moody’s ratings:
28 The calibration value should be similar to the best estimate of the annual default ratio of the universe.
For this study, it is estimated that this value should be equal to 1,5% for the non-financial private Portuguese firms.
6. QUANTITATIVE RATING SYSTEM & PD ESTIMATION 36 Rating Min 1st Quartile Median Mean StDev 3rd Quartile Max
Aaa 0 0 0 0 0 0 0
Aa 0 0 0 0.06 0.18 0 0.83
A 0 0 0 0.09 0.27 0 1.7
Baa 0 0 0 0.27 0.48 0.37 1.97
Ba 0 0 0.64 1.09 1.67 1.29 11.11
B 0 0.38 2.34 3.71 4.3 5.43 20.78
Caa-C 0 0 7.93 13.74 17.18 20.82 100
Investment-Grade 0 0 0 0.15 0.28 0.21 1.55 Speculative-Grade 0 0.59 1.75 2.7 3.04 3.52 15.39 All Corporate 0 0.18 0.67 1.1 1.38 1.32 8.4
Table 6 - Annual Global Issuer-Weighted Default Rate Descriptive Statistics, 1920-200329
It is relevant to point out that this is not an attempt to create an alternative to Moody’s ratings. The objective is to obtain a rating system whose default frequencies share some properties with an external reference. A downside of this mapping methodology is that implicitly we assume that our benchmark has all the desired properties, and that the underlying structure of our population is similar to the one used to produce the benchmark statistics. The methodology was set up as an optimization problem that can be formalized as follows:
(
)
1 1
2 , ,
1
min
k
k b i i x x
i
y y − =
−
∑
…
subject to i , 0 , 0 ,
i i i
i
d
y x d i
x
= > > ∀
where b i
y is the default frequency of the benchmark for class i, yi is the default
frequency of the model for class i, di is the number of default observations in class i
and xi is the number of observations in class i.
Figures 27 and 28 present the results of applying this methodology to the scoring models estimated previously:
6. QUANTITATIVE RATING SYSTEM & PD ESTIMATION 37
0% 2% 4% 6% 8% 10% 12% 14% 16%
Aaa Aa A Baa Ba B Caa
Model A Model B Model C Moodys
Figure 27 – Default Frequency by Rating Class (Historical Method)
0% 5% 10% 15% 20% 25% 30% 35%
Aaa Aa A Baa Ba B Caa
Model A Model B Model C
Figure 28 – Number of Observations Distribution by Rating Class (Historical Method) Figure 27 shows the default frequency by rating class for each model and selected benchmark. The default frequency presented are calibrated frequencies, the calibration is similar to the one described in the previous section. All three models can moderately approximate the benchmark, although only results for Model A provide a good fit for the default frequency in the lowest rating class. Even so, the results for the three models are clearly positive in terms of discriminatory power. When comparing the default frequencies between the two methodologies, it is clear that the historical
6. QUANTITATIVE RATING SYSTEM & PD ESTIMATION 38 methodology yields much steeper rating scales, starting at lower default rates for the higher rated classes, and ending at clearly higher default rates for the lower rated classes than the cluster methodology30. Consequently, the resulting distributions of observations for the rating systems based on the historical methodology (Figure 28, above) are less granular, with higher concentrations in the middle / lower classes. For all three models, only the very best firms belong to one of the two higher rating classes, and the worst class is reserved for the very worst performing firms. Comparing the distributions of observations by rating class based on the three scoring models, there are no clear differences between them.
6.3 Rating Matrices and Stability
Once the optimal boundaries for each rating class are determined, a rating classification can be attributed for each observation of the dataset. Tracking the evolution of the yearly observations of each firm enables the construction of one-year transition matrices. If, for example, a firm is classified as Baa in the fist period considered, in the next period it could either have an upgrade (to Aaa, Aa or A), a downgrade to (Ba, B, Caa), remain at Baa, default, or have no information in the dataset (Without Rating – WR).
The analysis of the transition matrix is helpful in order to study the stability of the rating system. The fewer transitions, i.e., low percentages in the off-diagonal elements of the matrix, the more stable the rating system. Furthermore, transitions involving jumps of several notches (for example, a transition from Aaa to Caa) are undesirable. Thus, a stable rating system is one whose rating transitions are concentrated in the vicinity of the main diagonal elements of the matrix.
Another relevant aspect of the transition matrix is the transition from each rating class to default. In terms of discriminatory power, a better rating system is one where the transitions to default rise at an exponential rate, from the higher rating to the lower rating classes.
30 The default rates for the higher rating class, resulting from the historical methodology, are 0%
because historically there are no observed one-year defaults for the benchmark, in the period considered.
6. QUANTITATIVE RATING SYSTEM & PD ESTIMATION 39 Tables 7 to 9 present the transition matrices for the three models considered, with the class boundaries determined by the cluster methodology, while Tables 10 to 12 present the matrices based on the historical methodology:
Aaa Aa A Baa Ba B Caa D WR Aaa 41.15% 20.37% 4.71% 1.22% 1.06% 0.65% 0.00% 0.81% 30.03%
Aa 19.13% 29.82% 15.93% 6.11% 3.49% 1.16% 0.07% 2.98% 21.31% A 7.15% 23.74% 25.84% 12.88% 8.25% 2.78% 0.08% 3.20% 16.08% Baa 2.31% 14.08% 19.47% 19.25% 17.60% 6.93% 0.33% 5.39% 14.63% Ba 1.21% 4.93% 10.85% 16.70% 29.69% 15.20% 0.43% 5.92% 15.06% B 0.37% 1.76% 2.61% 4.27% 18.30% 42.96% 2.40% 11.85% 15.47% Caa 0.00% 0.95% 0.95% 0.00% 3.81% 34.29% 9.52% 25.71% 24.76%
Table 7 – Model A - 1 Year Transition Matrix (Cluster Method)
Aaa Aa A Baa Ba B Caa D WR Aaa 42.43% 23.57% 1.72% 0.36% 0.27% 0.00% 0.09% 0.63% 30.92%
Aa 13.42% 46.57% 14.09% 3.32% 0.38% 0.21% 0.04% 3.20% 18.76% A 1.58% 26.52% 32.79% 14.78% 2.19% 0.43% 0.43% 4.81% 16.48% Baa 0.46% 8.27% 24.22% 33.40% 8.27% 2.99% 1.04% 7.55% 13.80% Ba 0.14% 2.32% 9.71% 29.28% 21.16% 8.12% 3.77% 10.72% 14.78% B 0.00% 1.89% 2.95% 14.74% 21.47% 21.05% 7.58% 13.05% 17.26% Caa 0.00% 1.54% 0.00% 7.34% 11.97% 16.22% 18.15% 21.62% 23.17%
Table 8 – Model B - 1 Year Transition Matrix (Cluster Method)
Aaa Aa A Baa Ba B Caa D WR Aaa 26.67% 28.80% 7.20% 0.80% 0.00% 0.27% 0.00% 0.53% 35.73%
Aa 7.10% 41.27% 19.01% 3.85% 0.74% 0.44% 0.07% 1.63% 25.89% A 1.15% 18.70% 40.28% 15.40% 3.72% 0.68% 0.10% 3.20% 16.76% Baa 0.25% 3.84% 23.96% 32.14% 13.96% 2.89% 0.50% 5.41% 17.04% Ba 0.07% 1.25% 9.42% 24.50% 29.29% 13.10% 1.62% 7.28% 13.47% B 0.09% 0.35% 2.26% 9.03% 23.00% 32.38% 6.34% 11.37% 15.19% Caa 0.00% 0.00% 1.15% 0.29% 5.48% 26.51% 23.34% 19.88% 23.34%
Table 9 – Model C - 1 Year Transition Matrix (Cluster Method)
Aaa Aa A Baa Ba B Caa D WR Aaa 13.33% 26.67% 16.67% 6.67% 0.00% 0.00% 0.00% 0.00% 36.67%
Aa 1.44% 14.83% 25.84% 15.31% 0.48% 0.96% 0.00% 0.00% 41.15% A 0.40% 5.23% 34.97% 26.83% 3.52% 0.60% 0.00% 1.01% 27.44% Baa 0.04% 0.80% 13.43% 45.59% 16.65% 1.69% 0.00% 2.96% 18.84% Ba 0.04% 0.16% 1.65% 21.18% 44.64% 11.38% 0.04% 5.69% 15.22% B 0.00% 0.10% 0.26% 3.64% 22.44% 44.83% 0.26% 12.47% 16.00% Caa 0.00% 0.00% 0.00% 0.00% 0.00% 22.22% 0.00% 55.56% 22.22%
6. QUANTITATIVE RATING SYSTEM & PD ESTIMATION 40 Aaa Aa A Baa Ba B Caa D WR Aaa 18.97% 36.21% 12.07% 0.00% 0.00% 0.00% 0.00% 0.00% 32.76%
Aa 2.85% 32.43% 24.32% 6.16% 1.05% 0.30% 0.00% 0.75% 32.13% A 0.07% 12.79% 35.91% 16.80% 6.75% 0.98% 0.00% 2.46% 24.24% Baa 0.00% 3.44% 22.66% 31.96% 21.35% 2.00% 0.00% 2.96% 15.63% Ba 0.00% 0.42% 5.65% 17.58% 43.55% 11.80% 0.04% 5.31% 15.64% B 0.00% 0.05% 0.76% 2.48% 20.88% 47.44% 0.43% 12.18% 15.77% Caa 0.00% 0.00% 0.00% 0.00% 5.00% 25.00% 0.00% 30.00% 40.00%
Table 11 – Model B - 1 Year Transition Matrix (Historical Method)
Aaa Aa A Baa Ba B Caa D WR Aaa 18.92% 29.73% 16.22% 0.00% 0.00% 0.00% 0.00% 0.00% 35.14%
Aa 2.24% 21.41% 35.14% 3.83% 0.96% 0.32% 0.00% 0.00% 36.10% A 0.22% 5.17% 46.79% 14.62% 5.29% 0.84% 0.00% 2.08% 24.97% Baa 0.00% 1.13% 24.27% 33.36% 20.49% 2.06% 0.00% 3.18% 15.52% Ba 0.00% 0.21% 5.42% 18.13% 43.13% 11.77% 0.04% 5.33% 15.96% B 0.00% 0.05% 0.81% 2.49% 20.90% 47.51% 0.34% 12.13% 15.77% Caa 0.00% 0.00% 0.00% 0.00% 0.00% 22.22% 0.00% 38.89% 38.89%
Table 12 – Model C - 1 Year Transition Matrix (Historical Method)
Results based on the historical methodology are more stable and display higher discriminatory power than the results based on the cluster methodology. In terms of stability, the historical based results have less high level transitions. For example, none of the three matrices based on this methodology have transitions from the high classes Aa, A, Baa to lowest class Caa, while all of the three matrices based on the cluster methodology have such transitions.
In terms of discriminatory power, the matrices based on the historical methodology also present better results, since the transitions to default start at lower percentages for the higher classes and increase continuously to considerable higher percentages than the transitions based on the cluster methodology.
Regarding the results for each model, within each methodology, none of them produces a clearly more attractive rating matrix.
41
7
Regulatory Capital Requirements
Under the New Basel Capital Accord (NBCA)31, financial institutions will be able to use their internal risk assessments in order to determine the regulatory capital requirements. In the first pillar of the Accord – Minimum Capital Requirements – two broad methodologies for calculating capital requirements for credit risk are proposed. The first, the Standardized Approach, is similar to the current capital accord, where the regulatory capital requirements are independent of the internal assessment of the risk components of the financial institutions. Conversely, in the second methodology – the Internal Ratings-Based Approach – banks complying with certain minimum requirements can rely on internal estimates of risk components in order to determine the capital requirements for a given exposure. Under this methodology, two approaches are available: a Foundation and an Advanced approach. For the Foundation Approach, credit institutions will be able to use their own estimates of the PD but rely on supervisory estimates for the other risk components. For the Advanced Approach, banks will be able to use internal estimates for all risk components, namely the PD, Loss-Given-Defaults (LGD), Exposure-At-Default (EAD) and Maturity (M). These risk components are transformed into Risk Weighted Assets (RWA) through the use of risk weight functions32.
Up to this point we have devised six alternative methodologies for determining one of the risk components, the PD. Assuming fixed estimates for the other risk components33 we are able to estimate capital requirements under the IRB Foundation approach, and compare them to the capital requirements under the current accord. Table 13 provides results for all six models:
31 Basel Committee on Banking Supervision (2003).
32 Appendix 6 provides a description of the formulas used to compute the RWA for corporate
exposures.
33 The parameters assumed are LGD = 45%, M = 3 years, EAD for SME = 0.3 Million Eur and EAD
for large firms = 1.5 Million Eur. For the calculations under the current capital accord, it is assumed that all exposures have the standard risk weight of 100%.
7. REGULATORY CAPITAL REQUIREMENTS 42 Capital Reqts (Eur)
Model RWA % Average
IRB Found. Basel I
Capital Difference A 90.95% 272,396,629.19 299,496,000.00 27,099,370.81 B 91.45% 273,885,689.68 299,496,000.00 25,610,310.32
Hi
stori
cal
C 91.59% 274,315,296.00 299,496,000.00 25,180,704.00 A 96.24% 288,220,548.59 299,496,000.00 11,275,451.41 B 91.11% 272,881,107.86 299,496,000.00 26,614,892.14
Cluster
C 91.79% 274,906,654.20 299,496,000.00 24,589,345.80 Table 13 – Average RWA and Total Capital Requirements
Results are similar for all models, the capital requirements under the IRB Foundation approach are lower than those that would be required under the current capital accord. For the Historical rating methodology, the two-equation scoring specification (Model A) is the one that provides the highest capital relief, but for the Cluster rating methodology it is the one that provides the lowest.
Figures 29 to 34 provide the distribution if the relative RWA for each rating class of all six methodologies, weighted by the number of observations attributed to each class by each rating methodology:
0% 30% 60% 90% 120% 150% 180% 210%
-1% 0% 1% 2% 3% 4% 5% 6% 7%
PD
RW
A
RWA SME RWA Corporate Portfolio Average
7. REGULATORY CAPITAL REQUIREMENTS 43
0% 30% 60% 90% 120% 150% 180% 210%
-1% 0% 1% 2% 3% 4% 5% 6% 7%
PD
RW
A
RWA SME RWA Corporate Portfolio Average
Figure 30 – Model B - IRB Capital Requirements (Cluster Method)
0% 30% 60% 90% 120% 150% 180% 210%
-1% 0% 1% 2% 3% 4% 5% 6% 7%
PD
RW
A
RWA SME RWA Corporate Portfolio Average
7. REGULATORY CAPITAL REQUIREMENTS 44
0% 50% 100% 150% 200% 250%
-1% 0% 1% 2% 3% 4% 5% 6% 7% 8% 9% 10% 11% 12% 13%
PD
RW
A
RWA SME RWA Corporate Portfolio Average
Figure 32 – Model A - IRB Capital Requirements (Historical Method)
0% 50% 100% 150% 200%
-1% 0% 1% 2% 3% 4% 5% 6% 7% 8%
PD
RW
A
RWA SME RWA Corporate Portfolio Average
7. REGULATORY CAPITAL REQUIREMENTS 45
0% 50% 100% 150% 200%
-1% 0% 1% 2% 3% 4% 5% 6% 7% 8% 9%
PD
RW
A
RWA SME RWA Corporate Portfolio Average
Figure 34 – Model C - IRB Capital Requirements (Historical Method)
The results based on the Historical Methodology are more concentrated on the middle classes, and typically only the two lowest rating classes have a risk weight above the standard Basel I weight. Results under the Cluster Methodology are more evenly spread out through the different classes, with the three up to five lowest rating classes having a risk weight above Basel I requirements.