Zenoss Event Management
Version 3
September 2009
Updated January 2010
Jane Curry
Skills 1st Ltd
www.skills-1st.co.uk
Jane Curry Skills 1st Ltd 2 Cedar Chase Taplow
Maidenhead SL6 0EU 01628 782565
Synopsis
This paper is intended as an intermediatelevel discussion of the Zenoss event system. It assumes that the reader is already familiar with the Zenoss Event Console and with basic navigation around the Zenoss Graphical User Interface (GUI). It looks in some detail at the architecture behind the Zenoss event system – the daemons and how they are interrelated – and it looks at the structure of a Zenoss event and the event life cycle. Zenoss can receive events from many sources in addition to Zenoss itself. Events from Windows, Unix syslogs and Simple Networks Management Protocol (SNMP) TRAPs are all examined in detail.
The process by which an incoming event is transformed into a particular Zenoss event is known as event mapping and has a number of different possible techniques for
performing that conversion. These will all be explored along with the creation of new event classes.
Once an event has been received and classified by Zenoss, automation may be required. Alerting by email and pager are discussed as is the ability to run any script as an Event Command.
This paper was written using Zenoss 2.4.1.
The paper is a companion text to the Zenoss Event Management Workshop.
Notations
Throughout this paper, text to by typed, file names and menu options to be selected, are highlighted by italics; important points to take note of are shown in bold.
Table of Contents
1 Introduction...5 2 Zenoss event architecture...5 2.1 Event Console...5 2.2 Event database tables and the Event Manager...9 2.3 Event life cycle...13 2.3.1 Event generation...15 2.3.2 Application of device context...16 2.3.3 Event class mapping...17 2.3.4 Application of event context...18 2.3.5 Event transforms...18 2.3.6 Database insertions...19 2.3.7 Resolution...20 2.3.8 Ageing out events...21 3 Events generated by Zenoss...21 3.1 zenping...22 3.2 zenstatus...23 3.3 zenwin...23 3.4 zenprocess...24 3.5 zenperfsnmp...24 3.6 Availability monitoring daemons and device status pages...24 4 Syslog events...25 4.1 Configuring syslog.conf and syslogng.conf...26 4.2 Zenoss processing of syslog messages...27 5 Zenoss processing of Windows event logs...34 6 Event Mapping...35 6.1 Working with event classes and event mappings...36 6.2 Rules in event mappings...39 6.3 Regex in event mappings...40 6.4 Other elements of event mappings ...41 7 Event transforms...42 7.1 Using zendmd to run Python commands...44 7.1.1 Referencing an existing Zenoss event for use in zendmd...44 7.1.2 Using zendmd to understand event attributes...45 7.1.3 Using zendmd to understand event methods...47 7.2 Transform examples...48 7.2.1 Combining user defined fields from Regex with transform...48 7.2.2 Applying event and device context in relation to transforms...49 8 Zenoss and SNMP...51 8.1 SNMP introduction...51 8.2 Zenoss SNMP architecture...52 8.2.1 The zentrap daemon...528.3 Interpreting MIBs...55
8.3.1 zenmib example...55
8.3.2 A few comments on importing MIBs with Zenoss...58
8.4 The MIB browser ZenPack...62
8.5 Mapping SNMP events...62
8.5.1 SNMP event mapping example...63
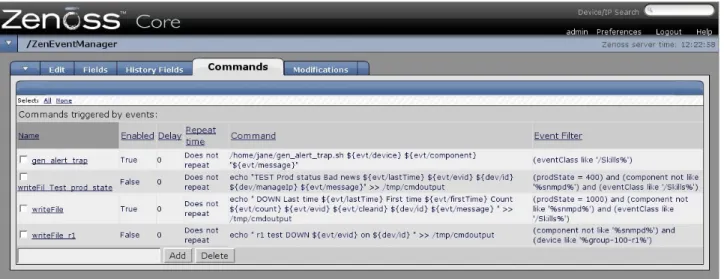
9 Event Commands...68
9.1 Creating event commands...68
9.2 Debugging event commands...70
10 Events, Alerts & Production Status...74
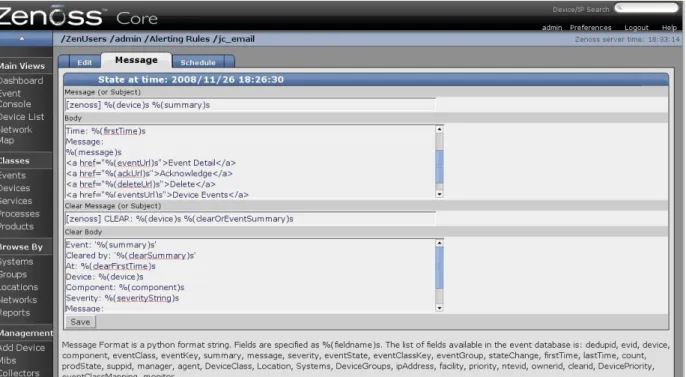
10.1 Alerting rules for email and paging...74
10.2 Other alerting possibilities...76
10.3 The effect of device Production Status...78
11 Conclusions...79
1 Introduction
Zenoss is an Open Source, multifunction systems and network management tool. There is a free, Core offering (which does seem to have most things you need), and a chargeable offering, Enterprise, which has extra addon goodies such as high availability configurations, distributed management servers, rolebased access and various support contracts which include some education and consultancy. For a comparison of the “fee” alternatives, try http://www.zenoss.com/product/pricing .Zenoss offers configuration discovery, including layer 3 topology maps, availability
monitoring, problem management and performance management. It is designed around the ITIL concept of a Configuration Management Database (CMDB), “the Zenoss Standard Model”. Zenoss is built using the Pythonbased Zope web application server and uses the objectoriented Zope Object Database (ZODB) as the CMDB, used to store Python objects and their states. Zenoss uses ZEO, as a layer between Zope and the ZODB. The relational MySQL database is used to hold current and historical events. Performance data is held in Round Robin Database (RRD) files. The default protocols for monitoring are typically “agentless” the Simple Network Management protocol (SNMP), Windows Management Instrumentation (WMI) and collecting events from syslogs. It is also possible to monitor devices using telnet, ssh and to use Nagios plugins. Zenoss provides a good “Getting Started with Zenoss” document along with a “Zenoss Administration Guide” and a “Zenoss Developer's Guide”; you can get these from http:// www.zenoss.com/community/docs . There is also a wealth of information on the Zenoss website but it is rather diffused between FAQs, HowTos, a Wiki and contributions to the various forums. A useful book is available from PACKT Publishing, “Zenoss Core Network and System Monitoring” by Michael Badger, which provides much of the same information as the Zenoss Administration Guide but in a much clearer format with plenty of screenshots. This paper is an attempt to expand on the event information in the Administration Guide by drawing on my own experience and the collected wisdom of the community contributions.
2 Zenoss event architecture
2.1 Event Console
When an event arrives at Zenoss, it is parsed, associated with an event classification and then typically (but not always), it is inserted into the status table of the events
database. Events can then be viewed by users using the Event Console of the Zenoss Graphical User Interface (GUI).
There are three ways to access the Event Console. The main Event Console is reached from the Event Console menu on the left. The default is to show all status events with a severity of Info or higher, sorted first by severity and then by time (most recent first). Events are assigned different severities:
● Critical Red
● Error Orange
● Warning Yellow
● Info Blue
● Debug Grey
● Clear Green
The events system has the concept of active status events and historical events (two different database tables in the MySQL events database).
Events in the console can be filtered by Severity (Info and above by default) and by State New, Acknowledged and Suppressed where New and Acknowledged are shown by default. Any event which has been Acknowledged changes to a wishywashy version of the same colour. A Suppressed event also has the wishywashy version of the colour. There is a Search box at the top right for filtering events based on the presence of any string within any field of an event.
From the Event Console, one or more events can be selected by checking the box alongside the event and the table menu dropdown can be used for various functions including “Acknowledge Events”, “Move to History” and “Map Events to Class”.
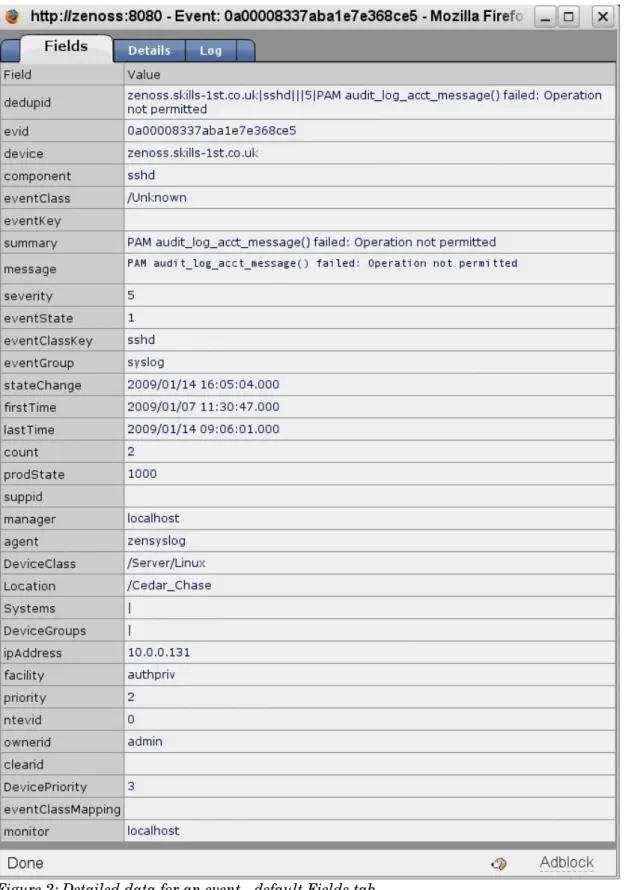
The column headers of the Event Console can be used to change the sorting criteria and the icon at the far right of the event can be used to display the detailed data of the event.
The detailed data shows the default event fields under the Fields tab, any userdefined fields under the Details tab and the Log tab records actions such as acknowledge and clearing, along with date, time and the user that performed these actions. It is also possible to add your own user messages to en event's Log but only while it is in the status table of the events database, not once it has been moved to the history table (Ack / UnAck status makes no difference).
The fields under the Details tab may include text messages for the Explanation and
Resolution event fields.
Note that if you wish to Undelete an event from the history tables of the database, this is possible with the dropdown table menu; however it does not change any previous Acknowledged status.
By default, the Event Console is refreshed every 60 seconds. If you wish to freeze the console, click the “Stop” link at the top of the console (beside the box with 60 in it); the link changes to say “Start”. To return to automatic refresh, click the “Start” link. An Event Console can also be accessed which automatically filters events for a
particular device. Navigate to the main page for a device and use the Events tab to show all events for that device.
The third method of displaying an Event Console applies an automatic filter of event class or subclass. Start from the Events menu on the left. The Events tab will show an Event Console filtered by the chosen class or subclass. Note that the toplevel dropdown menu has an option to Add Event. This is useful for generating test events.
Each of these three methods of accessing an Event Console shows active events. To see events that have been sent to the history table of the events database, click the blue
View Event History link at the top right of the Event Console.
2.2 Event database tables and the Event Manager
Zenoss events are held in a MySQL database called events which is created when
Zenoss is installed. By default, the zenoss user can access this database with a password of zenoss.
The main tables within the events database are status and history. The active events are kept in the status table and the historical events (typically resolved, cleared events) are held in the history table. The format of each of these tables and the valid fields for a Zenoss event can be seen be examining the database setup file in
/usr/local/zenoss/zenoss/Products/ZenEvents/db/zenevents.sql .
zenevents.sql also defines the history table in a similar fashion.
A further four tables are defined for heartbeat, alert_state, log and detail . The detail table can be used to extend the default event fields to include any information that the Zenoss administrator requires for an event, including Explanation and Resolution text.
Some of these event fields are particularly pertinent depending on how the event was generated:
● Syslog events populate the facility and priority fields ● Windows events populate the ntevid field
● SNMP TRAPs populate at least a community field in the detail table. They also use the detail table to provide any variables passed by an SNMP TRAP.
● The agent field denotes which Zenoss daemon generated or processed the incoming event; for example, zentrap, zeneventlog, zenping .
Connection information for the events database along with caching and maintenance parameters, can be accessed from Event Manager in the menu on the left of the Zenoss console.
By default, status events of severity below Error, are aged out to the events history table after 4 hours. Historical events are never deleted.
2.3 Event life cycle
The life cycle of an event has eight phases: ● Event generation
● Device context – additional information about the device that generated the event ● Event class mapping – to distinguish one type (class) of event from another
● Event context additional information pertinent to a class of event ● Event transform – manipulation of event fields
● Database insertion ● Resolution
● Age out
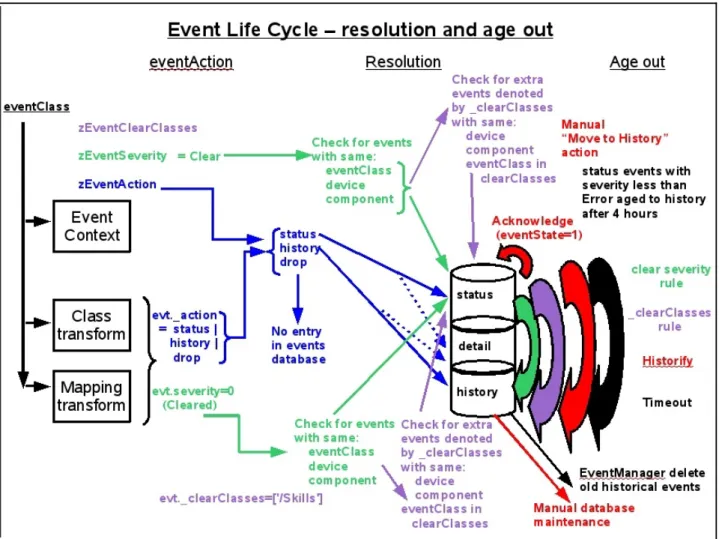
Processing of an event depends on the event class that an event is assigned to – the value of its eventClass field. A description of each of these phases will be given here: subsequent sections of the paper provide more details of some areas.
In Figure 7, the first six phases of the event life cycle are shown. The blue, dashed path shows the progress of an internally generated Zenoss event, which does not pass through an event mapping phase. An eventClass field is produced by the daemon that
generated the event. Its only way to apply a transform is as a class transform.
The purple path shows the progress of an event that is generated externally to Zenoss. The initial parsing daemon must provide an eventClassKey field which is then used, along with other fields, in an event class mapping Rule and/or Regex, which in turn provides an eventClass field. After mapping, the event may pass through both an event class transform and an event mapping transform.
Figure 8 shows the latter phases of the event life cycle. Blue paths show the effect of the zProperty zEventAction on the insertion of the event into the various tables of the event database. Green paths show the effect when the zProperty zEventSeverity is equal to
Cleared. Purple paths show the additional clearing effect of the zProperty zEventClearClasses.
The movement of events between tables of the events database are colourcoded with green for clearing based on severity=Cleared, purple for clearing based on
zEventClearClasses, red for manual actions (including Acknowledge which does not move the event between tables), and black for movements based on timeouts.
2.3.1 Event generation
Fundamentally, events will either be generated by Zenoss itself in the process of discovery, availability and performance checking, or events will be generated outside Zenoss and captured by specialised Zenoss daemons.
Zenoss daemon Example of when event generated
zenping ping failure on interface
zendisc new device discovered
zenstatus TCP / UDP service unavailable
zenprocess process unavailable
zenwin Windows service failed
zenperfsnmp SNMP performance data collection failure
Table 2.1.: Events generated by Zenoss itself
Zenoss daemon Example of when event generated
zensyslog processes syslog events received on UDP/514 (default) zeneventlog processes Windows events received using WMI
zentrap processes SNMP TRAPs received on UDP/162
Table 2.2.: External events captured by specialised Zenoss daemons
Events generated internally by Zenoss need no further processing to interpret the event. The daemon that generates the event parses the native information and assigns a value to the eventClass field and any other relevant fields such as component, summary, message and agent. Typically the eventClassKey field will be blank. Some Zenoss daemons populate the eventKey field (for example an Interface discovery event will populate the eventKey field with the IP address of the discovered interface).
Events that are initially generated outside Zenoss are captured by zensyslog,
zeneventlog or zentrap. These daemons each have a parsing mechanism to interpret the native event into the Zenoss event format. The Python code for this parsing is in
$ZENHOME/Products/ZenEvents. ( By default, $ZENHOME will be
/usr/local/zenoss/zenoss ). SyslogProcessing.py decodes syslog events; zentrap.py
decodes SNMP TRAPs.
Typically, these parsing mechanisms do not deliver a value for eventClass; rather they deliver a value for the eventClassKey field, along with values for some other fields such as component, summary, message and agent. It is then the job of the event mapping phase to distinguish the event class.
2.3.2 Application of device context
Early in the event processing life cycle, device context is applied to the event. This means that six fields of the event are populated by determining the device that
generated the event and then looking up the following values for the device in the ZODB database: ● prodState ● Location ● DeviceClass ● DeviceGroups ● Systems ● ipAddress (may have already been assigned)
2.3.3 Event class mapping
Event class mapping tends only to be applicable to events that originate outside the Zenoss system. It is the process by which an event is assigned a value for its
eventClass field and, potentially, other fields.
Typically, the event generation phase will deliver an event with a few fields populated; generally this does not include the eventClass field but does include the eventClassKey field. Often the Zenoss parsing daemon (such as zensyslog), will use the same eventClassKey for several different native events. For example, an eventClassKey of dropbear is used for several login security events. The component, summary, message and agent fields may also be populated. The event class mapping phase examines the event (such as it is, so far) and then uses a number of tests to determine the eventClass to assign to this event:
1. An eventClassKey field must exist for mapping to be successful.
2. A Python Rule can be written to test any available field of the event or any available attribute of the device from which the event came. Such rules can be complex Python expressions, including logical ANDs and ORs. If the rule is satisfied, the incoming event's eventClass field is given the class associated with that mapping. If the rule is not satisfied, this mapping is discarded, the class is not associated, and the next mapping will be tested for a match. A Rule does not have to exist in a mapping instance.
3. If the Rule is satisfied (or does not exist), the mapping can then use a Regex
Python regular expression to parse the event's summary field, checking for particular strings. The Regex can also assign parts of the summary field to new, userdefined detail fields of the event. If a Rule exists and is satisfied, the class mapping will apply, even if the Regex is not satisfied; any userdefined fields in the Regex will not be created if the Regex does not match. If a Rule does not
exist then the Regex must be satisfied for the mapping (and any transform) to apply.
4. The GUI dialogue that defines the mapping specifies the eventClassKey, the Rule, the Regex and any Transform. A sequence number is also available so that if multiple incoming events have the same eventClassKey then the sequence number defines the order in which the various mappings will be applied, lowest number first. The first Rule / Regex mapping combination that matches will be applied.
2.3.4 Application of event context
Event context is defined by the zProperties of an event. Event context can be defined at the event class level, for an event subclass, or at the event mapping level. As with all objectoriented attributes, the values are inherited by child objects so applying event context to a class automatically sets it for any subclasses and subclass mappings. The three event context attributes are:
● zEventAction status | history | drop default is status ● zEventClearClasses by default this is an empty Python list of strings ● zEventSeverity Original by default
Event context is applied in the event life cycle, after Rule and Regex processing but before any event transforms. Thus, the zEventAction zProperty can specify the history database but an event transform could override that action by setting the evt._action value to status.
2.3.5 Event transforms
Event transforms can be specified for an event class mapping or for an event class (or subclass). A transform is written in Python and can be used to modify any available fields of either the event or the device that generated the event. It can also create user defined fields.
From Zenoss 2.4, cascading event transforms mean that class transforms are applied from every level in the appropriate class hierarchy, followed by any transform for an applied event mapping. Prior to Zenoss 2.4, either a mapping transform was applied,
or a class transform, but not both. Class transforms were only applied to the exact class, not from the event class hierarchy.
A transform in an event mapping will only be executed once the eventClassKey has been matched, and the Rule has been satisfied (if it exists). If a Rule does not exist, any Regex has to be satisfied for the transform to be executed.
2.3.6 Database insertions
Zenoss events are stored in a MySQL database called events (by default). The events databases has a number of tables defined – see
/usr/local/zenoss/zenoss/Products/ZenEvents/db/zenevents.sql for the configuration of tables and triggers for the events database.
The main tables for the event life cycle are the status table for active events, the
history table for resolved events and the detail table for userdefined fields of events. Some fields of the event are only assigned at database insertion time – they are not available at event mapping or event transform time. These include: ● count ● evid ● stateChange ● dedupid ● suppid ● eventClassMapping ● firstTime is the same as lastTime until database insertion The Python code that drives database insertion can be found in $ZENHOME/Products/ ZenEvents; EventClass.py, EventClassInst.py and MySqlSendEvent.py are the main files. Some of the event fields can only be determined by reference to other events already in the database – such as count, dedupid, stateChange and firstTime. Zenoss automatically applies a duplication detection rule so that if a “duplicate” event arrives, then the repeat count of an existing event will simply be incremented. “duplicate” is defined as having the following fields the same: ● device ● component ● eventClass ● eventKey ● severity If the event does not populate the eventKey field, then the summary field must also match. At database insertion time, the dedupid field is created by concatenating the above fields together, separated by the pipe (vertical bar) symbol. Thus an example dedupid might be:
zenoss.skills-1st.co.uk|su|/Security/Su||5|FAILED SU (to root)jane on /dev/pts/1
where the device is zenoss.skills1st.co.uk, component is Security, eventClass is
/Security/Su , the eventKey is unset, severity is 5 (Critical), and the summary is
2.3.7 Resolution
Resolution is generally the process by which an event is moved from the status table of the events database to the history table.
A second possible definition of “resolution” is that the event is dropped entirely, never reaching the status table – this can be achieved either from the event context by setting zEventAction to drop, or in a transform with evt._action=drop . These same mechanisms can also be used during initial event processing, to set the event action to history, thus preventing the event from ever appearing in the status table.
A third possibility is to set the event's eventState field to Suppressed which means the event does not display, by default, in the Event Console status display. The suppressed eventState mechanism only appears to be used by the zenping daemon.
An event can be “resolved” by human intervention. The Event Console dropdown table menu provides an option to Move to history; the Zenoss Administration Guide describes this as “historifying”. It also provides the option to Acknowledge an event.
Acknowledging changes the eventState field to Acknowledged (as opposed to New); it changes the colour of the event to a wishywashy version of the same colour. It does not
move the event into the history table.
The more interesting forms of event resolution involve correlation of events; there are two different mechanisms. The basic principle is that “good news” clears “bad news”. The first clearing mechanism is that any event with a severity of Cleared will search the status table of the events database and move any similar events to the history table. “Similar” is defined as having the same eventClass, device and component fields. All “similar” events are cleared, not just the most recent.
When correlation takes place a number of the existing “bad news” event fields are updated. stateChange, deletedTime and clearid are all modified with clearid becoming the value of the evid field of the clearing, “good news” event. The “good news” event, with its Cleared severity, is automatically moved to the history table.
The second correlation mechanism is to specify in the event context, one or more event classes in the zEventClearClasses zProperty. This attribute will only be used on
clearing events. The effect is that any similar events of the listed classes will also be cleared, in addition to events of the same class as the clearing event. “Similar” in this case means the same device and component fields, plus the class specified in
zEventClearClasses. Note that the same effect can be achieved in a transform by assigning a list of class names to evt._clearClasses .
2.3.8 Ageing out events
Maintenance is required on the tables of the events database or the disk will simply fill up eventually. Two mechanisms are provided by the Event Manager:
● By default, events with severity less than Error will be aged from the status table to the history table after 4 hours. These parameters can be modified.
● Historical events can be deleted once they are older than a given number of days. The default is 0 – that is, no events are deleted from the history table
automatically.
Manual maintenance on the MySQL database may also be required. Zenoss provides a utility in $ZENHOME/Products/ZenUtils:
ZenDeleteHistory.py --numDays=10 to clear history events older than 10 days
The script should be run as the zenoss user.
Alternatively, the MySQL database can be manipulated directly by those with SQL knowledge. Here are a few examples; again, work as the zenoss user (note you need the trailing semicolon on SQL statements):
mysql -uzenoss -pzenoss -Devents Access mysql as zenoss user, to events db select * from heartbeat; Show all heartbeat events
delete from heartbeat where device='localhost'; Delete local heartbeat events
select * from status where device='mybox'; Show all status events for mybox
select * from detail where evid NOT IN (select evid from status UNION select evid from history); Show detail records for events deleted from status and history
delete from detail where evid NOT IN (select evid from status UNION select evid from history); Delete detail records for events deleted from status and history
3 Events generated by Zenoss
In the course of discovery, availability monitoring and performance monitoring, Zenoss may generate events to represent a change in the current status. Although many events are “bad news” it should be recognised that events can also be “good news” Interface Up, Threshold no longer breached, etc.
Events generated by Zenoss are dependent on the various polling intervals configured. To examine the default parameters, use the Collectors option from the Zenoss lefthand menu. Click on localhost (the collector on the Zenoss system). Note that earlier versions of Zenoss used the term and menuoption Monitors rather than Collectors.
Parameters to note particularly are:
● SNMP polling cycle 300 secs ( 5 mins)
● Polling for processes 180 secs (3 mins)
● Status polling for TCP/UDP services 60 secs (1 min) ● Polling for Windows services 60 secs (1 min)
● Windows WMI poll 60 secs (1 min)
● Ping polling 60 secs (1 min)
3.1 zenping
The most basic level of availability checking is to pingpoll. The zenping daemon will, by default, pingpoll each interface, every minute. An interface down event is generated when the ping fails to get a response. This event is automatically cleared when a
similar ping is successful; meantime, while an interface remains down, the count field of the event is increased.
The zenping daemon can detect when the network path to a device is broken, for example if a singlepointoffailure router is down. In this case, an event is generated
with an eventState field of Suppressed and the summary field reports not only the interface for which the ping failed, but also the causal device; for example: ip 10.191.101.1 is down, failed at bino.skills1st.co.uk All other device availability monitoring is dependent on ping access. Once a ping has failed, SNMP, process, TCP/UDP service and windows service monitoring will all be suspended until ping access is restored. The count field of the higher level monitoring events will not increase until ping access is resumed. Also note that if there is no ping access, no performance information will be collected. If a device really does not support ping, perhaps because of firewall restrictions, then ensure that the zProperty zPingMonitorIgnore is set to True; this will permit SNMP and ssh availability monitoring and performance data collection.
The logfile for zenping is zenping.log in $ZENHOME/log.
3.2 zenstatus
The zenstatus daemon can be configured to check for access to various TCP and/or UDP ports on both Windows and Unix architectures. By default, it checks every minute. Zenoss comes with a huge number of services preconfigured; these can be examined from the Services > IpService left hand menu. By default, none of these service
monitors are active. Service monitoring for a device can be configured from the device's main page – use the OS tab and the table dropdown menu beside IP Services to add a service to be monitored for this device.
As with ping polling, a “good news” service event for a device automatically clears a similar “bad news” event and the count field of the event increases whilst the service remains down.
The logfile for zenstatus is zenstatus.log in $ZENHOME/log.
3.3 zenwin
The zenwin daemon monitors Windows services (not TCP / UDP services). These can be examined from the Services > WinService left hand menu. By default, none of these monitors are active. Windows service monitoring for a device can be configured from the device's main page – use the OS tab and the table dropdown menu beside Win Services
to add a service to be monitored for this device.
zenwin uses the Windows Management Instrumentation (WMI) interface to access services on the remote system every minute, by default. The zProperties for a device (or device class) must be configured to allow access to WMI before windows service polling can be successful. As with ping polling, a “good news” windows service event for a device automatically clears a similar “bad news” event and the count field increases on subsequent failed polls.
3.4 zenprocess
zenprocess monitors Windows and Unix systems for the presence of processes. In a Unix context, this would be whether the process appears in a ps ef listing; in a Windows context, the process must appear in the Windows Task Manager (and note that this check is case sensitive on both architectures). Monitoring is every 3 minutes, by default. Configuration of process monitoring for a device is similar as for services – use the
device's main page > OS tab and the table dropdown menu beside OS Processes to add a process to be monitored.
Process monitoring is actually achieved using the Host Resources Management
Information Base (MIB) of SNMP, by retrieving the hrSWRun table. This means that if SNMP access to a device is broken, there will be no process information.
As with the other availability daemons, “good news” events clear “bad news” events and the count field increases on subsequent failed polls.
The logfile for zenprocess is zenprocess.log in $ZENHOME/log.
3.5 zenperfsnmp
zenperfsnmp polls each device every 5 minutes, by default. It can collect both SNMP performance information and status information for processes. Process monitoring is achieved using the SNMP Host Resources MIB so that if an SNMP agent fails, then process monitoring is also affected. This is not the case for Windows service monitoring. TCP / UDP service monitoring also does not rely on SNMP on any platform.
Within 5 minutes of an SNMP poll failure, an “snmp agent down” event should be generated. Within a further 3 minutes there should be an “Unable to read processes on device ..” event, if process monitoring is configured. Note also that the count field for individual missing process events should stop increasing. Counts for missing service events will be unaffected by the loss of SNMP. While SNMP access to the device remains broken, the count field for the “Unable to read processes on device ..” event will increase every 3 minutes.
3.6 Availability monitoring daemons and device status pages
Each device has its own Device Status page. There is an overall status icon button at the top of the page that fundamentally reports ping access (if ping access is enabled) – green for good status; red for bad. Note that if a device's zProperties are customised not
to pingmonitor, then this overall status button will always remain green!
The top righthand panel of the Device Status page reports component status for other monitored elements such as interfaces, services and processes. The Other category includes status for events reported via syslog or Windows event logs, where the colour of
the button represents the severity of the event. Note that Acknowledging such events has no effect on the Device Status page.
4 Syslog events
The Unix syslog mechanism is pervasive throughout all versions of Unix / Linux although slightly different versions and formats exist. There are also open source implementations of syslog for Windows systems and many networking devices also support the syslog concept. Typically system messages are output to one or more log files such as /var/log/messages. The syslog subsystem can also be configured to send syslog messages to a central syslog rather than holding files on each system. The wellknown default port for forwarding syslog messages is UDP/514.
A standard syslog system is configured by the syslog.conf file, typically in /etc . A newer version of syslog is implemented on some systems, syslogng, which has greater
filtering capabilities. The syslogng configuration file is typically/etc/syslogng/syslog ng.conf.
A syslog message includes a priority and a facility. The priorities are:
0 emerg 1 alert 2 crit 3 err 4 warning 5 notice 6 info 7 debug Facilities include:
auth (4) authpriv (10)
cron (9) daemon (3)
ftp (11) kern (0)
lpr (6) mail (2)
news (7) syslog (5)
user (1) uucp (8)
These definitions can be found in syslog.h (typically in /usr/include/sys). Both priority and facility are encoded in a single 32bit integer where the bottom 3 bits represent priority and the remaining 28 bits are used to represent facilities.
For example, if the facility/priority tag is <22>, this would be 00010110 in binary, where the bottom 110 represents a priority of 6 (info) and the top 00010 represents a facility of 2 = mail.
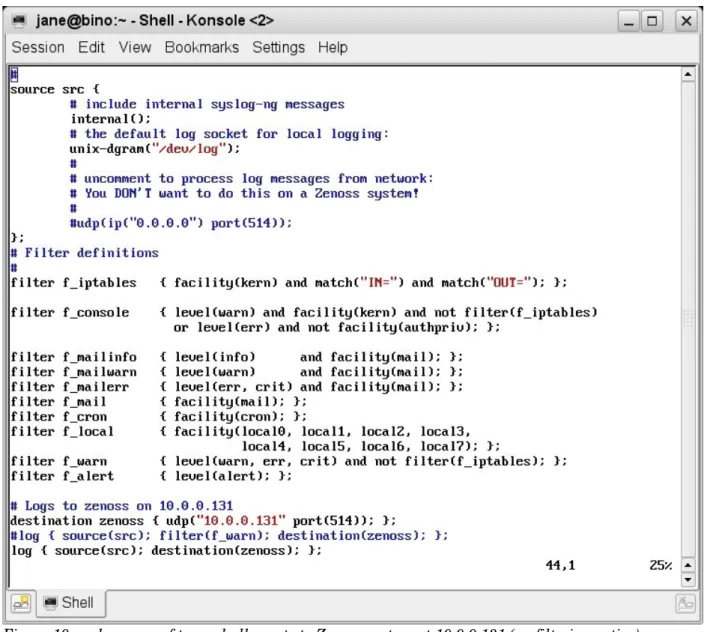
4.1 Configuring syslog.conf and syslog-ng.conf
Any device that is going to report syslog events to Zenoss must have its syslog.conf file configured with the destination address of the Zenoss system. The original syslog.conf permits filtering based on priority and facility so, a catchall statement to send all events to the Zenoss system, would be:
*.debug @<IP address of your Zenoss system>
syslogng.conf requires at least a source, a destination and a log statement. syslogng offers superior filtering over the original syslog so one or more filter statements may also be present.
4.2 Zenoss processing of syslog messages
To collect syslog messages with Zenoss, the zensyslog process automatically starts on port UDP/514 and collects any syslog messages directed from other systems. zensyslog then parses these messages into Zenoss events. You must ensure that the syslog.conf file on the Zenoss system does not enable collecting remote syslogs or the syslogd and zensyslog processes will clash over who gets UDP/514 (it is possible to reconfigure either daemon, if required).
To examine the incoming syslog messages and the parsing that zensyslog performs, the level of zensyslog logging can be increased.
1. Use the Settings menu on the Zenoss lefthand menu and choose the Daemons
tab.
2. Click the edit config link for the zensyslog daemon. 3. Change the following parameters and click Save:
logorig select this
logseverity Debug
4. Inspect the underlying configuration file in $ZENHOME/etc/zensyslog.conf. 5. The logorig line says to log the original incoming syslog message; it will be in
$ZENHOME/log/origsyslog.log. Note that this parameter is unique to zensyslog and is useful for debugging.
6. The logseverity line is a generic Zenoss daemon parameter; a value of 10 is the maximum Debug level.
7. Don't forget to Save this change
8. Use the Restart link to recycle zensyslog. Alternatively, as the zenoss user, issue the command:
zensyslog restart
9. Examine the zensyslog log file in $ZENHOME/log/zensyslog.log
10.A new incoming event starts with a line showing hostname and ip address, eg.
host=zen241.class.example.org, ip=172.16.222.241
11.The next 2 lines show the raw message and the decoding for facility and priority. 12.Lines starting with tag show the zensyslog parsing process as it tests the
incoming line against various Python regular expressions, hopefully ending with a tag match line.
13.If a match is successful, an eventClassKey may be determined 14.The last line for a parsed event should be a Queueing event .
Whenever different native event log systems are integrated there is almost inevitably a mismatch of severities. The following table demonstrates this.
Zenoss syslog priority Windows
Critical (red) (5) emerg (0) Error (1)
Error (orange) (4) alert (1) Warning (2)
Warning (yellow) (3) crit (2) Informational (4)
Info (blue) (2) err (3) Security audit success (8)
Debug (grey) (1) warning (4) Security audit failure (16) Clear (green) (0) notice (5)
info (6) debug (7)
Table 4.1.: Event severities for Zenoss, syslog and Windows
Note that the numeric value of Zenoss event severity decreases as events get less critical but that the priority of syslog events increases as events get less critical. Default mapping from syslog priority to Zenoss event severity, is performed by
/usr/local/zenoss/zenoss/Products/ZenEvents/SyslogProcessing.py – search for
defaultSeverityMap around line 163. The result is that:
● syslog priority < 3 (emerg, alert, crit) map to Zenoss severity 5 (Critical) ● syslog priority 3 (err) maps to Zenoss severity 4 (Error)
● syslog priority 4 (warning) maps to Zenoss severity 3 (Warning) ● syslog priority 5 or 6 (notice , info) map to Zenoss severity 2 (Info)
Outofthebox, all syslog events map to the Zenoss event class of /Unknown .
SyslogProcessing.py in $ZENHOME/Products/ZenEvents is the code that parses any incoming syslog message and generates a Zenoss event.
The first section has a series of Python regular expressions to match against the incoming syslog line. Each expression is checked in turn until a match is found. If no match is found then an entry goes to $ZENHOME/log/zensyslog.log with parseTag failed .
The main body of SyslogProcessing.py starts by assigning values from the incoming event to Zenoss event class fields, as follows:
def process(self, msg, ipaddr, host, rtime): evt = dict(device=host,
ipAddress=ipaddr, firstTime=rtime, lastTime=rtime, eventGroup='syslog')
At this stage, no account of duplicates is taken so the firstTime and lastTime fields are both set to the timestamp on the incoming event. Note that the Zenoss eventGroup field is hardcoded at this stage to syslog .
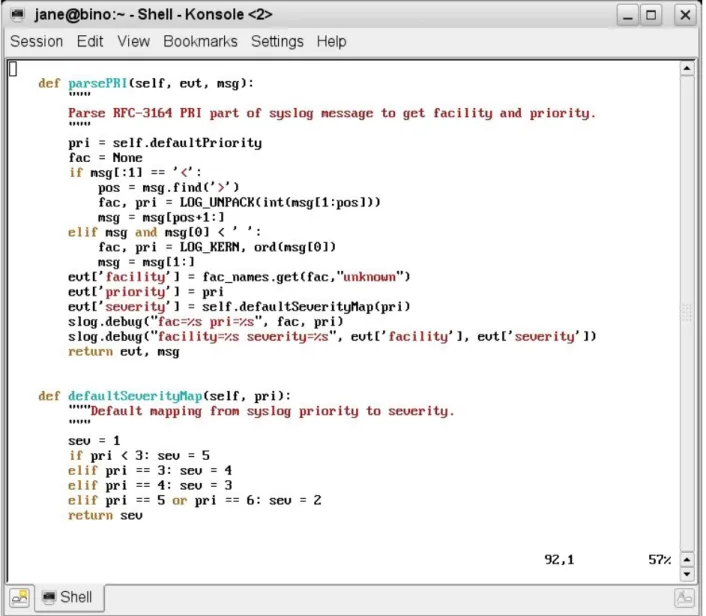
parsePRI is the Python function called to parse out the syslog priority and facility. The defaultSeverityMap function is called from within the parsePRI function to set the severity field of the Zenoss event.
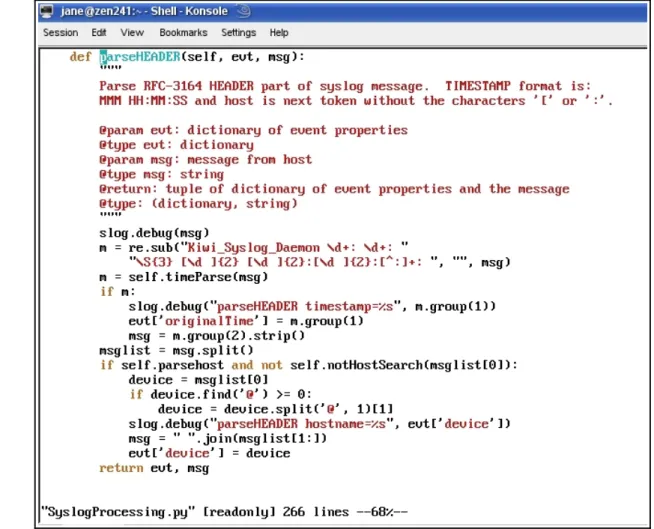
Next, the parseHEADER function is called to extract the timestamp and host name from the incoming event. If the hostname does not exist then an attempt is made to lookup the name from the IP address using a gethostbyname call. The device field of the Zenoss event is set at the end of this function.
The parseTag function is called to parse out the syslog tag, using the regex expressions at the beginning of the file. If no match exists then a parseTag failed message is logged. The end of the function returns the remainder of the incoming message in the Zenoss event summary field.
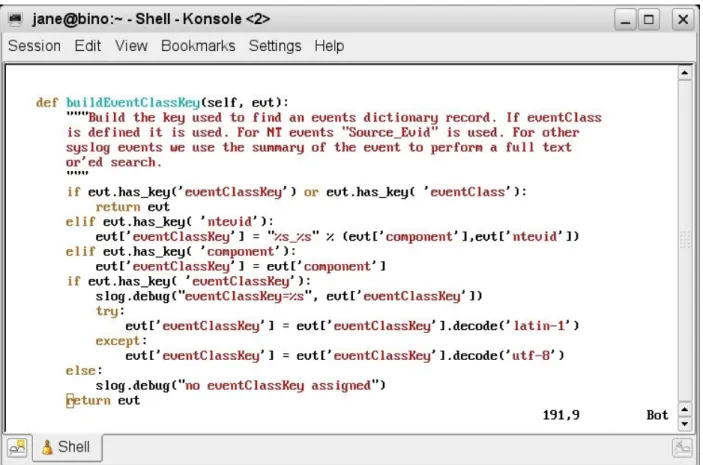
The crux of event processing in Zenoss is to derive an eventClassKey – this is done with the buildEventClassKey function.
Figure 15: SyslogProcessing.py parsing the syslog tag
Note that if the event has the component field populated then that is used as the eventClassKey after checking for a preexisting eventClassKey and for an ntevid field.
5 Zenoss processing of Windows event logs
The zeneventlog daemon is responsible for processing events from Windows event logs . It uses the WMI mechanism so, like the zenwin daemon for monitoring Windows services, the Windows zProperties for a device (or device class) must be configured correctly. From the dropdown table menu of a device's status page, choose More > zProperties. Scroll down to the zWin... properties and check you have the following settings. Don't forget to Save if necessary.
● zWinEventlog True
● zWinEventlogMinSeverity 16 (this will gather ALL events)
● zWinPassword < the correct password for Administrator>
● zWinUser Administrator
● zWmiMonitorIgnore False
Note especially the zWinEventLog property to turn on/off event log collection and
zWinEventLogMinSeverity that provides a crude filtering mechanism (see the earlier Table 4.1 on page 28 for the different severities for Windows Event logs).
It is the zeneventlog daemon in Zenoss that receives incoming Windows events and parses them into Zenoss events. Typically, the Source field on the Windows event maps to the component field in the Zenoss event; the Zenoss eventClassKey is composed of the Windows <Source>_<Event ID> (eg. Perflib_2003); the Zenoss eventGroup becomes the Windows log file name (Application, Security, etc) and the Windows Event ID is mapped to the Zenoss ntevid field.
Many Windows event log events are automatically mapped to event classes but they may have a low severity (such as Debug) and they may have their zEventAction event zProperty set to history so that they do not appear in the status table of the events database.
Watch out for events of class /Status/Wmi/Conn, typically after a Windows system reboot. Until this event is moved to history, no other events will be received from the WMI interface on the Windows system as the zenwin daemon will not reconnect and zeneventlog will receive no events.
There is also a syslog utility available for Windows systems from Datagram Consulting at http://syslogserver.com . The client utility is SyslogAgent and is made available under the GNU license. Syslog server utilities for Windows are also available as
chargeable products. This means that Windows event logs can also be collected with the zensyslog daemon. Note that the Syslog agent is capable of being configured to monitor Windows application log files, in addition to the standard Windows event logs. When monitoring the standard event logs, there are better filtering capabilities than when using zeneventlog.
6 Event Mapping
Zenoss events are categorised into a hierarchy of event Classes, many of which are defined outofthebox but which can easily be modified or augmented. The process of
Event Class Mapping is about associating an incoming event with a particular Zenoss Event Class (setting its eventClass field) and, potentially, modifying other fields of that event by using an event transform.
Event classes and subclasses are treated identically from the pointofview of event class mapping. The class hierarchy can be useful in that event context, as implemented by event zProperties (such as zEventSeverity, zEventAction), follows the normal rules for object inheritance – if zEventAction is set to drop on the event class /Ignore , then any subclasses of /Ignore will also inherit that property.
Notable outofthebox event zProperties are that /Ignore classes and subclasses drop incoming events (ie. they do not appear in either the status or the history databases);
/Archive classes and subclasses automatically move events to the history database. Most event classes have one or more mappings associated with them – these are known as instances . Note that an event does not have to have any mappings associated, in which case an event of that class will only appear in an Event Console if the daemon that generates the event, assigns the event class at that time (/Perf events may well come into this category, for example). Outofthebox event class mappings are defined in
$ZENHOME/Products/ZenModel/data/events.xml . They can be inspected from the Zenoss GUI by selecting Events in the left hand menu and drilling down the subclass hierarchy under the Classes tab. Alternatively, the Mappings tab shows a more mappingcentric list, rather than a classcentric list.
Most outofthebox event class mappings simply match on the eventClassKey field which is populated by the native event parsing mechanism (such as zensyslog, zeneventlog, zentrap ). These mechanisms may generate several different events with the same eventClassKey field; thus other techniques are needed to distinguish between such events and potentially to separate them into different event classes. The sequence number in an event mapping gives the order in which mappings are tested against the incoming event. Depending on which mapping actually matches (if any) will determine the resulting eventClass of the event.
6.1 Working with event classes and event mappings
Events are organised in an objectoriented hierarchy; thus attributes assigned to a “parent” event class are inherited by a “child” event subclass.
New event classes can be defined by selecting the lefthand Events menu, drilling down to a relevant subclass, if required, and then using the dropdown table menu alongside
SubClasses to Add New Organizer. The name supplied is the name of the new event class. For example, drill down to the /Security event class and create a new subclass called Su.
The simplest way to map an event to a new or different class is to start from an existing event in the Event Console. The following scenario explains this, creating a new event class mapping called su which maps an incoming event to the event class /Security/Su.
1. Generate a syslog FAILED SU event at the Zenoss system.
2. Open an Event Console that shows the event and inspect its details, including the
Details tab.
3. Select the event and using the table menu, select Map Events to Class . Select your new /Security/Su class from the dropdown list. You should be shown the event class mapping panel. Click the Edit tab.
4. You should find that the name of the new event class mapping is set to su and the Event Class Key is set to su (note lower case s in both cases). The
eventClassKey field is actually derived from the component field of the incoming event in SyslogProcessing.py (around line 256). The summary field of the event should have been copied into the mapping Example box. 5. Add a text string to the Explanation box such as “Auto added by event mapping”. 6. Add a text string to the Resolution box such as “This is a dummy resolution”. 7. Open a Zenoss GUI window that shows all Su events (you may find it useful to have several browser tabs open to focus on different aspects of the Zenoss GUI). Select all the Su events and Move to History.
8. Generate a new Su event.
9. Check the details of the new event in the Event Console. The event should have mapped to eventClass /Security/Su . The severity should be Info (blue). The details of the event should show the eventClassMapping field set to
/Security/Su/su .
Any existing event mapping can be modified starting from the Events lefthand menu and use the Mappings tab. The Show All button at the bottom of the first page, will display all mappings in alphabetical order. Once the mapping is selected, changes can be made from the Edit tab.
Whenever you change an event mapping, it is advisable to clear (Move to History) any existing events of that category before testing the new configuration. This is achieved by selecting one or more events and using the dropdown table menu.
When you are working with event mappings, don't forget the Event tab which filters an Event Console by Event Class; also, any Event Console has a filter available at the top right of the screen.
It is useful to refer to event classes using the breadcrumb path seen at the top of a page, such as /Events/Security/Su .
Test events can be created from the Event Console dropdown table menu, Add Event
Note that this is only available from an Event Console reached by starting from the left hand Events menu, not from a generic console or the events for a specific device (this changed between Zenoss 2.3 and 2.4).
Alternatively, the command line zensendevent can be used (you should ensure you are the zenoss user). This takes parameters:
● d device ● p component ● k eventClassKey ● s severity
● c eventClass
● port=PORT default is 8081 ● server=SERVER default is localhost ● auth=AUTH default is admin:zenoss
● The remainder of the line after these options is used for the summary field
(strictly the Message field in the GUI dialogue populates the event summary field)
6.2 Rules in event mappings
The Rule element of an event class mapping uses Python expressions to test any instantiated field of the incoming event against a value. Expressions can be complex including Python method calls and logical ANDs and ORs. The default event fields that are defined, are given in Appendix D3 of the Zenoss Administration Guide. Note that some of these fields are not actually available at event mapping time – notably evid, stateChange, count, dedupid, suppid and eventClassMapping .
The Rule element can also use Python expressions to test for values of attributes of the
device that generated the event. Some of the methods and attributes that are available for devices are documented in Appendix D2 of the Zenoss Administration Guide, under the section on TALES expressions (Template Attribute Language
Expression Syntax is part of Zope. Zope is the application server that Zenoss is built on ).
The Rule element will only be used if the eventClassKey field in the mapping has achieved a match with the incoming event. After that, if a Rule exists, it must be satisfied before this mapping (and hence class) is applied.
6.3 Regex in event mappings
The Regex element of an event class mapping can be used to parse the summary field of the incoming event, which is presented by the parsing daemon (zensyslog, zeneventlog, zentrap). The Regex element uses the Python format for regular expressions and can use the Python named group syntax to not only check for literal strings but also to define regular expressions for variable parts of a string, and associate that variable part with a name. Variable parts of the string are captured into Python named groups – this means that:
● You can have one expression match lots of similar but different incoming events ● The variable part (typically between the (?P and \S+) ) can be passed to the rest
of the event processing mechanism as a named field of the event. ● Thus, in the Regex
● exit before auth \(user '(?P<eventKey>\S+)', (?P<failures>\S+) fails \): Max auth tries reached ● (?P<eventKey>\S+) will parse the characters after user ' upto the next
single quote and place that string into the eventKey field of the event. Similarly (?P<failures>\S+) will hold the string that follows a comma and space and is ended by space and fails.
● Matching the literal string representing a bracket requires the backslash escape or the bracket will be interpreted as a metacharacter.
● The rest of the event summary must match the literal text in the Regex; however, other text can appear beyond the end after tries reached .
● The Example box usually shows a sample event summary that is matched by the regular expression in the Regex box.
Hence, the event summary field can be parsed to generate new, userdefined fields for the event which will be shown in the Details tab of an event's details and can be used in any subsequent event transforms.
The Regex element is only used if both the eventClassKey and the Rule (if any) are satisfied. If the Rule fails, the Regex will not be tested, nor will any named group, user defined fields be generated. If a Rule does not exist and the Regex does not match, the userdefined fields will not be generated and the event class mapping to this event class will fail. No event transforms will take place. If a Rule does exist and is satisfied but the Regex fails then any userdefined fields will not be generated but the event class mapping will be successful and any mapping transform will take place.
6.4 Other elements of event mappings
The Example element of an event class mapping is a sample string that is useful when constructing a Regex. The Regex will turn red if the Regex does not match the Example string when the Save button is used.
The Explanation and Resolution elements of an event class mapping are strings that can be configured to provide further information to Zenoss users. They appear in the
Details tab of an event's detail. Note that these elements can only be literal strings; they cannot use either standard or userdefined fields from the event.
The combination of eventClassKey, Rule and Regex determine the event class that will be associated with the incoming event and what transforms (if any) will take place. There may still be multiple combinations of these that satisfy any given incoming event.
If so, the Sequence tab is used to decide the precedence of evaluation of matching event mappings. The mappings will be tested from the lowest to the highest sequence number. Once a match is found, any subsequent mappings (with higher sequence numbers) will be ignored. Generally, a mapping with more specific matching criteria will have a lower sequence number. A particular example of event mappings that use sequence numbers, is the event class mapping called defaultmapping which must have an eventClassKey of
defaultmapping . There are at least 6 mappings, all called defaultmapping , outofthe box. Each maps to a different class. A default mapping is a special case that is used by the event mapping process if no match can be found for the eventClassKey field (note that if the eventClassKey field does not exist then no mapping at all will be applied). In the case where an eventClassKey match is not found, the mapping process reevaluates looking for a match with the special eventClassKey of defaultmapping . It is possible to create new mappings, either with the name of defaultmapping or, indeed, with a
different name, provided the eventClassKey is defaultmapping . The sequence numbers of all such default mappings should be adjusted to prioritise these default mappings.
7 Event transforms
Transforms can be used to do a number of clever things! Some default event fields can be modified; new, userdefined fields can be created; fields can be retrieved from events already in the MySQL database. You can have simple assignments of field values or set them based on complex Python programs. The transform mechanism can be applied in two ways: ● event class transforms ● event class mapping transforms
Prior to Zenoss 2.4, an event class transform was only used for events inserted directly to that exact event class by the parsing mechanism (zensyslog, zentrap, zensendevent, AddEvent with Event Class specified, etc). If a transform existed in an event class
mapping that was used, the event class transform was not used.
Zenoss 2.4 introduced cascading event transforms. This changes things in two ways. Given an event class /Toptest with a subclass of /T1, if an event arrives that already has class /Toptest/T1, then the Toptest transform will be applied, followed by the T1 transform. If an event arrives that does not have a preallocated class but whose event class is determined to be /Toptest/T1, by the Rule / Regex of the event class mapping, t1, then transforms will be applied in the order:
● Toptest class > T1 class > t1 event class mapping
It is perfectly possible for a transform to use userdefined event fields instantiated by earlier transforms; however, be very aware that if any statement in a transform fails (perhaps because a field doesn't exist), then the processing of that transform will stop at
that point and no further statements will be executed. Any further transforms will be executed (at least until an error is reached).
All transforms are executed once the Rule and Regex elements of a mapping have been successfully tested and after device and event context have been applied. Thus, at transform time, most of the standard event fields are available, except those populated at database insertions time (evid, stateChange, dedupid, count, eventClassMapping – and the firstTime and lastTime fields will be the same). Any userdefined fields created by the Regex are also available.
Event class transforms can be useful on the /Unknown class to selectively change the class for events that would otherwise be /Unknown .
Other than that, the two applications of transforms are very similar – it is basically Python code to modify event fields.
Note that if a transform tries to reference a field of an event that does not yet exist (like count) then that line of the transform and any subsequent lines will be ignored. Such an error will not trigger any error messages in the transform dialogue. Inspect the end of $ZENHOME/log/zenhub.log and $ZENHOME/log/event.log to see the error message reporting the absence of the attribute.
A class transform is configured starting from the Events lefthand menu, by drilling down to the class in question (not the class mapping) and then use the top dropdown table menu to bring up the More > Transform menu.
A mapping transform is specified as part of the same event mapping dialogue that defines the Rule and Regex fields. In each case, if the Python syntax is incorrect, when you use the Save button, then the transform is all displayed in red text, indicating an error.
Figure 19 on page 39 showed an event mapping called linetest which includes a transform to create several userdefined event fields, some based on values from the event and some with values from the device that generated the event. The event summary field is set to a string constructed from literal text, standard event fields and userdefined fields.