23
Distributed CESVM-DR Anomaly Detection for
Wireless Sensor Network
Nurfazrina Mohd Zamry, Anazida Zainal & Murad A. Rassam
Information Assurance and Security Research Group Universiti Teknologi Malaysia, UTM Johor Bahru, Johor, MalaysiaSubmitted: 12/01/2018. Revised edition: 30/10/2018. Accepted: 4/11/2018. Published online: 30/05/2019 DOI: https://doi.org/10.11113/ijic.v9n1.218
Abstract—Nowadays, the advancement of the sensor
technology, has introduced the smart living community where the sensor is communicating with each other or to other entities. This has introduced the new term called internet-of-things (IoT). The data collected from sensor nodes will be analyzed at the endpoint called based station or sink for decision making. Unfortunately, accurate data is not usually accurate and reliable which will affect the decision making at the base station. There are many reasons constituted to the inaccurate and unreliable data like the malicious attack, harsh environment as well as the sensor node failure itself. In a worse case scenario, the node failure will also lead to the dysfunctional of the entire network. Therefore, in this paper, an unsupervised one-class SVM (OCSVM) is used to build the anomaly detection schemes in recourse constraint Wireless Sensor Networks (WSNs). Distributed network topology will be used to minimize the data communication in the network which can prolong the network lifetime. Meanwhile, the dimension reduction has been providing the lightweight of the anomaly detection schemes. In this paper Distributed Centered Hyperellipsoidal Support Vector Machine (DCESVM-DR) anomaly detection schemes is proposed to provide the efficiency and effectiveness of the anomaly detection schemes.
Keywords—Anomaly detection, support vector machines,
unsupervised anomaly detection, dimension reduction
I. INTRODUCTION
Wireless Sensor Networks (WSNs) have been used in many domains ranges from industrial to military application to monitor, control as well as tracking purpose. For instance, the tiny sensor nodes are deployed at the mountain or urban area for environmental monitoring, embedded in the animal
for tracking as well as positioned at a war zone for detecting the adversary. These tiny nodes are communicated the sensed data continuously with each other, via the intermediate node i.e. cluster head or parent node or directly to the base station. Meanwhile, the network architecture can be either based on flat or hierarchical network architecture. Basically, the sensor nodes composed of sensing unit, processing, unit, radio unit, and power unit. Unfortunately, due to the tiny in a sized sensor node is come with limited energy, computation, and storage.
24 consumed rather than processing thousands of data in a sensor node. Therefore, one of the ways to minimize data communication by implementing the data aggregation techniques. Implementing the data aggregation is related to the gathering the data at one point while organized the network framework. Nevertheless, data aggregation technique have minimized the energy consumption thus significantly affected the efficiency of the entire network. Meanwhile, [2] have stated that data aggregation technique can be categorized based on the basis of network topology, network flow, quality of services and many more.
In this paper, we propose a Distributed Centered Hyper-ellipsoidal Support Vector Machine (DCESVM-DR) scheme by implemented CESVM-DR anomaly detection scheme proposed in [3] on hierarchical Low-Energy Adaptive Clustering Hierarchy (LEACH) network topology. Clustering–based data aggregation network topology namely LEACH-CR have been designed to improve the energy efficiency of WSNs communication. The network energy efficiency of LEACH-CR, as well as data effectiveness of DECESVM-DR, will be evaluated to measure the performance the proposed anomaly detection technique based on data aggregation network topology.
II. RELATED WORK
The related work will be discussed of data aggregation network topology and the anomaly detection for WSNs. Both data aggregation network topology and the anomaly detection are discussed to ensure 1) to minimize the communication and prolong the network lifetime; 2) to accurately collecting sensed data from the monitoring environment. Therefore, the proposed DCESVM-DR scheme contributes to more effective and efficient anomaly detection scheme.
A. DATA AGGREGATION NETWORK TOPOLOGY
Data aggregation network topology can be categorized into a structure-based or structure-free[4] while some of the researches have categorized data aggregation structure into the flat network and hierarchical network. There are many types of research focused on data aggregation including [2], [5], [6]. The differentiation between the flat network and the hierarchical network are shown in Table 1.
TABLE 1.Differentiation of Hierarchical Network and Flat Network [5]
Hierarchical Network Flat Network
Data aggregation performed by cluster heads or a leader node.
Data aggregation is performed by different nodes along the multi-hop path.
Overhead involved in cluster or chain formation throughout the network.
Data aggregation routes are formed only in regions that have data for transmission.
Even if one cluster head fails, the The failure of the sink node may
Hierarchical Network Flat Network
network may still be operational. result in the breakdown of the entire network.
Lower latency is involved since sensor nodes perform short range transmissions to the cluster head.
Higher latency is involved in data transmission to the sink via a multi-hop path.
Routing structure is simple but not necessarily optimal.
Optimal routing can be guaranteed with additional overhead.
Node heterogeneity can be exploited by assigning high energy nodes as cluster heads.
Does not utilize node heterogeneity for improving energy efficiency.
The in-network data aggregation is defined as the global process of gathering and routing information through a multi-hop network, processing data at intermediate nodes with the objective of reducing resource consumption (in particular energy), thereby increasing network lifetime [6]. On the other hand, in-network aggregation techniques require three basic ingredients which are: 1) suitable networking protocols; 2) effective aggregation functions and 3) efficient ways of representing the data [6]. There are many simple aggregation functions such as average, median, quantile, min, max, etc. have been used to aggregate the data measurements. Furthermore, the more complex aggregation function is designed by taking the spatial, temporal or semantic correlation into accounts such as Temporal coherency-aware in-Network Aggregation (TiNA), Data Aggregation and Dilution by Modulus Addressing (DADMA) and Data Aggregation by means of Feedback Control.
25 Fig. 1. The taxonomy of data aggregation network protocol [2]
Data aggregation in the flat network can be established when the base station flooding query messages to the sensor nodes in the network and then the sensor nodes will respond to the base station if their data is matched with the query message. The advantage of applying data aggregation in the flat network is higher robustness of the network due to the same data can be sent along multiple-pathway in the network. However, as the data communication are not have any specific structure, excessive communication in the network will faster the energy depletion. Moreover, each sensor node plays the same role and is equipped with approximately the same battery power.
As the flat network is energy excessive which can quicken the sensor node lifespan and lead to the dysfunctional of the network. Therefore, several hierarchical data-aggregation approaches have been proposed to mitigate the drawback of the flat network data aggregation to extend the energy efficiency as well as the scalability of the network. In term of energy efficiency, the data communication will be reduced by aggregating the data at the intermediate node. Meanwhile, the scalability of the network can be achieved when the faraway nodes in large size network can transmit their data to the other sensor rather than directly sent to the base station.
Tree-based network data aggregation is among the earliest hierarchical network topology where the sensor nodes are arranged into tree-like structures. The data are communicated from the leaves usually call the child nodes to the root which can be called parent nodes. The data aggregation will be performed by the parent’s nodes after child nodes sent their data to parent nodes. Tree-based data aggregation is suggested by [2] that suitable to be used in applications that require in-network data aggregation. The drawback of tree-based is that, when the parent nodes are interrupted or dead, the entire data sent from the child will
also be lost. Still, the tree-based network can provide energy-efficient network when the designer of the optimal aggregation functions and perform efficient energy management [6].
As same as the tree-based network data aggregation, cluster-based network data aggregation are arranged in the hierarchical network topology. The different between cluster networks data aggregation is the entire network are clustered in the small cluster where cluster head is selected as an intermediate node to perform the data aggregation and transmit the data to the base station. Again, the scalability will be affected when the cluster-head need to communicate the long distant data to the base station. Therefore energy will quickly deplete while affected the accuracy of the data collected at the base station. There are lots of research have been done to improve both energy consuming and network scalability for cluster-based network data aggregation. For instance, LEACH and other LEACH variants are among favored protocols to be implemented as cluster-based network data aggregation. As both cluster-based and tree-based network data aggregation shared a lot of similarities, thus the advantages and disadvantages are similar to each other.
As structure-free network data aggregation did not attach with any of network structure, two challenged have been specified to performed data aggregation. The first challenge is routing are performed on-the-fly as there is no specific network structure need to be followed. The other challenge is each node not need to wait for the data from other nodes since there are no clearly network structure to be followed. Therefore both challenges create the uncertainty of the performance of data aggregation while exhausting the sensor nodes. As the conclusion, structure-free network data aggregation give advantages in term of maintaining the network structure but superfluous data communications
As summarized by [6], many protocols are based on clustering where data aggregation can be directly aggregated at the cluster head compared to flat-based and structure-free network data aggregation protocols. Few adjustments have been made in cluster-based network data aggregation protocols to ensure the energy efficiency as well as the scalability of the network. In this paper, the cluster-based data aggregation network topology will be utilized to communicate the data from the sensor nodes to the base station.
B. ANOMALY DETECTION IN WSNs
26 approaches of an anomaly detection mechanisms namely supervised, unsupervised and semi-supervised which differentiated by the type of the background knowledge of the data available. The supervised mechanism used the prior knowledge dataset and trained the normal and abnormal labeled data to detect the anomalous data. Contrary, the unsupervised mechanism detects an anomalous data without any prior knowledge of the data. The classifier will learn the normal behavior of the data measurement during the data training phase. Meanwhile, the semi-supervised mechanism, classifier generally learns about to detect the anomalous data. Due to labeled data are hard to get from the real-world scenario, the unsupervised mechanism is favored to be adapted in anomaly detection schemes. Moreover, since no labeled data to be trained in unsupervised mechanism thus can provide time-consuming anomaly detection scheme.
The taxonomy of anomaly detection techniques for WSNs has been discussed in [3]–[5]. Statistical-based, Nearest Neighbor-based, Clustering-based, Classification-based as well as Spectral Decomposition-Classification-based which been presented in [4], are summarized as the common techniques used to detect anomalous data in WSNs environments. Nevertheless, the advantages, as well as their limitation, have been discussed in [3]. Anomaly detection also has been categorized based on their detection techniques which sort by the type of which models they learn. For instance, [7] have classified anomaly detection approach into statistical-based, nearest neighbor-based, clustering-based, classification based and spectral-decomposition-based as shown in Fig. 2. In the statistical-based technique, data are detected as anomalous when the distribution of new data is very low, not fitted to the estimated distribution model
learned. Further, the statistical-based technique is categorized into parametric and non-parametric which the classifier has the knowledge or not have any knowledge of the data distribution respectively. There are two techniques under this approach parametric called Gaussian and non-Gaussian. Meanwhile, kernel density estimator and histogram are classified under the non-parametric approach. Nearest neighbor-based are based on data mining and machine learning technique. Data is detected as an anomalous when their distance is far from the respect of their nearest neighbors. As same as nearest neighbor-based, clustering-based classify as anomalous data using the similarity measure. The clustering-based technique is widely used in the data mining community. The classification-based technique generally the classifier will learn the normal data behavior during the training phase and then used the normal data behavior to classify the new data measurement as normal or anomalous. Support Vector Machines (SVM) and Bayesian are approaches that classify under this classification-based anomaly detection technique. Lastly, spectral decomposition-base technique used principle components to create the normal model behavior which classifies the smallest components as an anomalous data. Nevertheless, each of this anomaly detection technique has the advantages and drawback. Therefore, designing the anomaly detection schemes based on the techniques are different from one domain to another. In this paper, the anomaly detection scheme will use one-class SVM (OCSVM) the unsupervised of SVM to fit the limitation of WSNs in term of absent of unlabeled sensor data and the less computational complexity of the classifier
27 III. PROPOSED DISTRIBUTED CESVM-DR
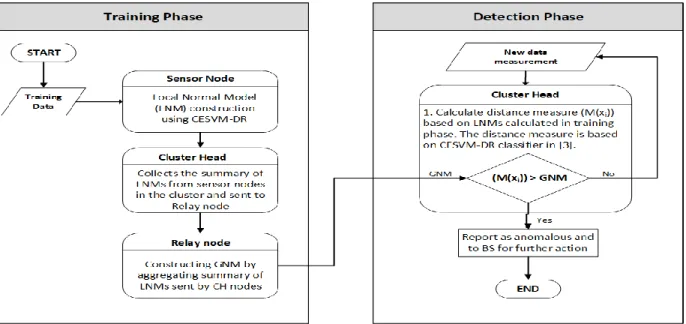
Fig. 3 represents the overview of the proposed DCESVM-DR anomaly detection model. The training phase of the proposed anomaly detection scheme is conducted offline where each node constructing their Local Normal Model (LNM) based on CESVM-DR classifier. Then, each sensor nodes will send their summary of LNM to cluster head (CH) that follow the clustering network architecture to construct Global Normal Reference Model (GNM) by combining their LNMs using data aggregation function. The special node called relay node is introduced to aggregate the LNMs collected from CH nodes. The relay node is introduced to cope with the long-distance communication as some CH nodes are located far from BS. Therefore, this can helps to enhance the scalability of the network.
In proposed DCESVM-DR, the relay node is again used to collect GNM constructed by CH to produce Global Normal Reference Model Relay (GNMR). The GNMR is combined GNM from CH which intent to view GNM in
more globally as compared to GNM combining from CH nodes. The GNMR is sent back to each CH nodes to use in the next detection phase. Meanwhile, the detection phase is conducted online to classify the new data measurement into normal or anomalous data.
The CESVM-DR classifier based on unsupervised OCSVM is proposed to mitigate the computational complexity occurred by CESVM anomaly detection scheme. As mention by [10], CESVM scheme has an advantage in term of detection accuracy and flexibility in terms of parameter selection, however, prohibitive communication overhead. Meanwhile, there are many researches had applied dimension reduction techniques to reduce the data dimension for instance in [8]–[11]. In this research, the CCIPCA algorithm which is a variant of PCA dimension reduction techniques is used to compute the eigenvalue and eigenvector during the training phase. The eigenvalue and eigenvector are used to reduce the new data measurement in the detection phase.
28 Both eigenvalue and eigenvector along with a calculated radius, mean and standard deviation are stored in the nodes are called LNM. Each node will send the summary of LNM which is radius to CH to aggregate the LNM and formed the GNM. Then CH sent their GNM to relay node to formed GNMR. The GNMR is sent back to CH for the detection phase. In the detection phase, new measurement collected from the CH nodes will be classified as a normal or anomalous node. In the detection phase, the distance measure of the new data measurements are calculated based on the stored LNM constructed from the training phase. The distance measured is compared with a Radius of GNMR, RGNMR.
Fig. 4. Methodology using CESVM-DR Classifier
Fig. 4 shows the flowchart of the CESVM-DR scheme to execute the anomaly detection. In the CESVM-DR scheme, CESVM is used as OCSVM classifier operated as unsupervised anomaly detection technique. In order to minimize the communication overhead as well as computation complexity, CCIPCA dimension reduction is incorporated to calculate the eigenvalue and eigenvector of the training data and will be used to reduce the dimension of the new data measurement during the testing phase. The formulation of CESVM and CCIPCA can be referred in [12], [13] respectively. CESVM-DR is performed in a training phase which operated offline to build the normal model. Meanwhile, the detection phase is performed online mode to detect the anomalous from new measurements.
IV. RESULT AND ANALYSIS
This section will demonstrate the evaluation results using the proposed DCESVM-DR scheme. The dataset is taken from Grand St. Bernard (GSB) which one of the SensorScope project. 23 sensor nodes were deployed which
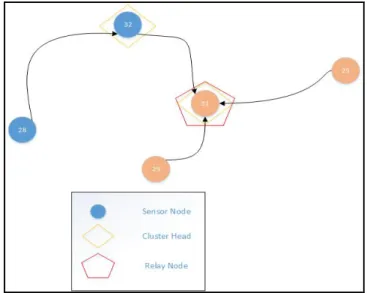
divided into small and large clusters contained five nodes and 18 nodes respectively. GSB dataset is taken from the small cluster by extracting data measurements from nodes N25, N28, N29, N31, and N32. Two features which are ambient temperature and relative humidity is used to evaluate the multivariate data scenario. The network structure is portrayed as in Fig. 5 which based on hierarchical network structure. Detection will be performed at the CH nodes N31 and N32 after the RGNMR is sent by relay nodes N31. The effectiveness is measured based on the detection rate (DR), False Positive Rate (FPR), False Negative Rate (FNR) as well as detection accuracy (ACC). The average result of the performance measured is shown in Table 2 which compared with local CESVM schemes.
Fig. 5. Network structure for evaluating DCESVM-DR
Table 2 shows the effectiveness result for DCESVM-DR anomaly detection model for detection rate (DR), False Positive Rate (FPR), False Negative Rate (FNR) as well as detection accuracy (ACC).
TABLE 2. DCESVM-DR model effectiveness result for CH N31 and N32 compared with local CESVM scheme
N31 N32
CESVM-DR CESVM CESVM-DR CESVM
DR 100% 99.6% 100% 98.8%
ACC 98.9% 98.9% 98.9% 98.8%
FPR 1.2% 1.2% 1.2% 1.2%
FNR 0.0% 1.2% 0.0% 1.2%
29 DCESVM-DR model correctly detect the anomalous data compared to CESVM anomaly detection scheme. Meanwhile, the accuracy rate for DCESVM-DR and CESVM shows the same result which is 98.9% for node N31. Accuracy rate for N32 shows the result of 98.9% for DCESVM-DR while CESVM result is 98.8% which is DCESVM-DR 0.1% better than CESVM. This is reflected from the False Alarm Rate (FAR) as DCESVM-DR shows 1.2% FPR and 0% FNR while CESVM recorded 1.2% for both FPR and FNR. The FPR indicates that both DCESVM-DR and CESVM have falsely detected normal data as anomalous. On the other hand, FNR indicates the anomalous data is wrongly detected as normal data as reported by CESVM anomaly detection scheme. The efficiency evaluation for both DCESVM_DR anomaly detection model and CESVM anomaly detection scheme is shown in Table 3.
TABLE 3. DCESVM-DR model efficiency evaluation as compared with local CESVM scheme
Scheme Memory
Utilization
Computational Complexity
Communication Overhead CESVM O (mn + np) O(n2 + m2n) O(np)
DCESVM-DR
O (mn+ nd)
O(n2+ m2dn) O(nd)
CESVM keeps the eigenvalue and eigenvector, thus the complexity is represented by O (mn + np) where m represent a low-rank approximation of Kernel Gram. Meanwhile, the memory complexity of the CESVM-DR is O (mn + nd) where d represents the dimension of data vector and d is less the p. The total computational complexity of CESVM-DR is O (n2+ m2dn) as the computational of eigenvalue and eigenvector calculated from CCIPCA technique have been reduced and O(n2) represents the calculation of Gram matrix, K. Computational complexity of CESVM scheme involves the computation of a K, an Eigen-decomposition of Gram matrix and a linear optimization problem. The total computational complexity of CESVM is represented as O (n2 + m2n) where m less than n that represents the low-rank approximation of the Gram matrix. The communication overhead of DCESVM-DR is represented as O (nd) when communication is done between a pair of sensor nodes. If the CESVM is operated in a distributed manner, the communication overhead of CESVM is represented as O (np) when communication is done between a pair of sensor nodes.
V. CONCLUSION
This paper has presented the distributed anomaly detection model based on the hierarchical network model. The lightweight anomaly detection classifier based on unsupervised OCSVM. The advantages of a linear optimization problem which can minimize the computational complexity also made the CESVM is used as
a classifier. The CESVM scheme has an advantage in term of detection accuracy and flexibility in terms of parameter selection, however, prohibitive communication overhead. Therefore to reduce the communication complexity of CESVM for use in distributed detection the CESVM is suggested to exploit for data vectors low dimensional subspace. In this research, an anomaly detection scheme namely CESVM-DR have been proposed by integrated CESVM with CCIPCA dimension reduction technique to reduce the data dimension and minimized the CESVM computational complexity. The effectiveness and efficiency result shows the proposed DCESVM-DR is preferable to be applied in distributed anomaly detection.
REFERENCES
[1] M. Xie, S. Han, B. Tian, and S. Parvin. (2011). Anomaly Dtection in Wireless Sensor Networks : A Survey, J. Netw. Comput. Appl., 34(4), 1302-1325. [2] V. Pandey, A. Kaur, and N. Chand. (2010). A
Review on Data Aggregation Techniques in Wireless Sensor Network, 1(2), 1-8.
[3] N. M. Zamry, A. Zainal, and M. A. Rassam. (2018). Unsupervised Anomaly Detection for Unlabelled Wireless Sensor Networks Data, Int. J. Adv. Soft Comput. its Appl., 10(2), 172-191.
[4] K.-W. Fan, S. Liu, and P. Sinha. (2007). Structure-Free Data Aggregation in Sensor Networks, IEEE Trans. Mob. Comput., 6(8), 929-942.
[5] R. Rajagopalan and P. K. Varshney. (2006). Data Aggregation Techniques in Sensor Networks : A Survey, IEEE Commun. Surv. Tutorials, 8(4). [6] E. Fasolo, M. Rossi, J. Widmer, and M. Zorz. (2007).
In-network Aggregation Techniques for Wireless Sensor Networks: A Survey, Wirel. Commun., 14(2), 70-87.
[7] Y. Zhang, N. Meratnia, and P. J. M. Havinga. (2008). An Online Outlier Detection Technique for Wireless Sensor Networks using Unsupervised Quarter-Sphere Support Vector Machine, International Conference on Intelligent Sensors, Sensor Networks and Information Processin, 151-156.
[8] S. M. Erfani, S. Rajasegarar, S. Karunasekera, and C. Leckie (2016). High-Dimensional and Large-Scale Anomaly Detection using a Linear One-Class SVM with Deep Learning, Pattern Recognit., 58, 121-134. [9] M. A. Rassam and A. Zainal. (2015). Principal
Component Analysis-based Data Reduction Model For Wireless Sensor Networks, Int. J. Ad Hoc Ubiquitous Comput., 18(1–2), 85-101.
30 [11] S. Siripanadorn, W. Hattagam, and N. Teaumroong.
(2010). Anomaly Detection using Self-organizing Map and Wavelets in Wireless Sensor Networks, Int. Conf. Appl. Comput. Sci. - Proc., 4(3), 291-297. [12] S. Rajasegarar, C. Leckie, and M. Palaniswami.
(2008). CESVM : Centered Hyperellipsoidal Support
Vector Machine Based Anomaly Detection, 1610-1614.
![TABLE 1. Differentiation of Hierarchical Network and Flat Network [5] Hierarchical Network Flat Network](https://thumb-us.123doks.com/thumbv2/123dok_us/8003240.2121544/2.892.469.842.87.317/table-differentiation-hierarchical-network-network-hierarchical-network-network.webp)
![Fig. 2. Taxonomy of Anomaly Network by [7]](https://thumb-us.123doks.com/thumbv2/123dok_us/8003240.2121544/4.892.97.797.671.1016/fig-taxonomy-of-anomaly-network-by.webp)