COMPARISON OF MAGNESIUM AMOUNT IN BLACK, GREEN,
FRUIT, AND HERBAL TEAS
Michaela Zeiner
[a]*, Iva Juranovic Cindric
[b], Michaela Kröppl
[c], Gerhard
Stingeder
[a]Paper was presented at the 4th International Symposium on Trace Elements in the Food Chain, Friends or Foes, 15-17 November, 2012, Visegrád, Hungary
Keywords: magnesium, black tea, fruit tea, green tea, herbal tea, ICP-OES.
The diet is the main source of minerals and trace elements, thus exposure to dietary essential elements has a direct impact on human health. Magnesium is a major component of the bones, but furthermore it influences the nervous system and muscle activity. Therefore its needs must be met via nutrition. There is a non-negligible discrepancy between intake and requirements. So magnesium is often uptaken in form of nutrition supplements. Thus there is an interest in the amount of magnesium in natural products, where it is supposed to vary. In this study, various commercially available tea bags of different kinds of tea (black tea, green tea, fruit tea and herbal tea) were analysed for their magnesium content. After a microwave assisted digestion with nitric acid and water at temperatures up to 220°C, the element concentration was measured with ICP-OES (inductively coupled plasma-optical emission spectroscopy) as it is a simultaneous, fast and reliable method with low detection limits. All samples were prepared in duplicate. In all samples high amounts of magnesium (approx. 1 g kg-1) could be
found. No statistically significant differences were registered between the different classes of teas.
* Corresponding Author Fax: +43-47654-6059
E-Mail: [email protected]
[a] Division of Analytical Chemistry, Department of Chemistry, BOKU - University of Natural Resources and Life Sciences, Muthgasse 18, 1190 Vienna, Austria
[b] Laboratory of Analytical Chemistry, Faculty of Science, University of Zagreb, Horvatovac 102a, 10000 Zagreb, Croatia
[c] Upper Austrian University of Applied Sciences, Campus Wels; Stelzhamerstraße 23, 4600 Wels, Austria
Introduction
Tea is one of the most popular beverages in the world since more than 2000 years.1 Usually a tea drink or infusion is prepared by seeping dried parts of certain plants in boiling or at least hot water. Whereas infusions prepared in this way contain only little proteins, vitamins, fibres or carbohydrates, they represent a source of some essential dietary metals as well as of metal binding polyphenols.2 The most common kinds of tea are the true tea types (black, Oolong, green and white tea) derived from the tea plants. In last decades however, the popularity of the so-called herbal or fruit tea (infusions of fruits or herbs) is increasing to the elevated ecological awareness and the trend to a healthier life style.
The determination of minerals from major down to trace elements in tea, dried fruits and their infusions is important because of the metabolic role of some essential or toxic metals. There is not only the need of knowledge of the food's nutritional value which refers to major or minor-elements,3 but there is also a concern to verify that food does not contain minerals in toxic quantities. These elements might be harmful to the human organism, regardless whether their presence is naturally occurring or is due to contamination. Furthermore the uptake and utilisation of certain elements, such as iron and copper is reduced by the consumption of real tea infusions caused by the tannins.
This effect was not found for other minerals including magnesium.4
Magnesium is a physiologically essential constituent playing an important role in different vital processes occurring in the human body. It is not only a major component of the bones, but furthermore it influences the nervous system and muscle activity. Being a cofactor in almost all phosphorylation reactions involving ATP Magnesium is considered as an indirect antioxidant.5
As reported by Pugh and colleagues6 vegetation represents a useful indicator of (heavy) metal contamination in the environment via root uptake of metals, and can be used for monitoring pollution across both spatial and temporal scales. The soil properties,7 such as mother rock composition, also influence the total metal content in tea leaves and thus in infusions. Therefore leaves and blossoms used for tea preparation can be used as indicator of environmental contamination, and also for their geographical origin.
Thus it is expected that the total magnesium content in tea or tea leaves varies between different real tea types (e.g. black or green) and within these classes in certain ranges between different brands. Even higher differences are supposed to be found in fruit and herbal teas since they derive from other plants.
Due to importance of magnesium for human health tea powder and tea infusions have already been analysed, but mostly with low number of samples.
A study of ten tea powders purchased in the USA including herbal and green tea revealed higher magnesium contents in herbal teas than in the real teas. Decaffeinated green tea even contained more Mg than caffeinated green tea, namely 4.6 g kg-1 and 3.3-3.7 g kg-1, respectively.9
Regarding real tea types the investigation of McKenzie et al. has to be mentioned. They determined the magnesium content in black, green, Oolong, Pu-erh and white tea. The results are in the range from 2.0 up to 2.8 g kg-1 for all kinds studied.10
Basgel and Erdemoglu determined besides other elements the amounts of total magnesium in seven medicinal herbs cultivated in Turkey, which are commonly used for the preparation of healing infusions. The contents found ranged from 1.6 up to 3.8 g kg-1.11
Peppermint and nettle leaves from commercially available tea bags as well as infusions derived from them were analysed for their elemental composition by Lozak and colleagues. In the former 5.8 g kg-1 magnesium were found.12
Magnesium data are also documented in literature for the medicinal plants sage and mountain germander, the contents of the whole herbs being 4.0 g kg-1 and 1.4 g kg-1, respectively.13
Experimental
Tea samples
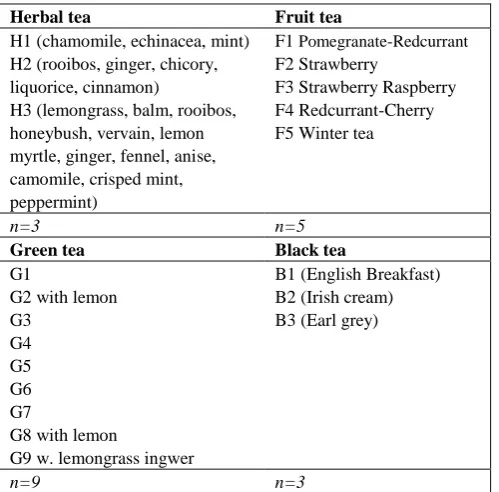
Four different tea types, real tea (black and green) as well as fruit and herbal tea have been analysed. All samples (powders) were tea bags commercially available in Austria and Croatia. An overview is given in Table 1. Prior to sample preparation the tea bags of one sample were opened and the powders were homogenised.
Table 1 Analysed Tea samples
Herbal tea Fruit tea
H1 (chamomile, echinacea, mint) H2 (rooibos, ginger, chicory, liquorice, cinnamon)
H3 (lemongrass, balm, rooibos, honeybush, vervain, lemon myrtle, ginger, fennel, anise, camomile, crisped mint, peppermint)
F1 Pomegranate-Redcurrant
F2 Strawberry
F3 Strawberry Raspberry F4 Redcurrant-Cherry F5 Winter tea
n=3 n=5
Green tea Black tea
G1
G2 with lemon G3
G4 G5 G6 G7
G8 with lemon
G9 w. lemongrass ingwer
B1 (English Breakfast) B2 (Irish cream) B3 (Earl grey)
n=9 n=3
Digestion of the tea samples
In order to determine the total magnesium content of the samples these were mineralised after homogenisation by acidic microwave assisted digestion. About 100 to 120 mg of each pooled tea powder sample were accurately weighed into the Teflon microwave digestion flasks. After addition of 5 mL HNO3 (65 ww%, p.a, Merck) and 4 mL distilled water the flasks were left opened till gas emissions from nitric acid stopped. The flasks were then closed and put into the microwave oven (StarT” from MLS). The temperature programme applied was (time [min]/power [W]: 3/700; 9/500; 23/1000 with a maximum allowed temperature of 220°C. After cool-down to room temperature the completely digested samples were filled up to 10.0 mL with distilled water. All samples were digested in duplicate. Samples without tea powders were also prepared as blank samples.
Determination of the magnesium concentration by ICP-OES
The instrument used was a Prodigy High Dispersive ICP-OES spectrometer (Teledyne Leeman, Hudson, NH, USA) working in a simultaneous mode. The optimal instrumental conditions are listed in Table 2.
Table 2 ICP-OES operating conditions
Instrument Prodigy High Dispersive ICP
Spectrometer High resolution Echelle polychromator
Large format programmable array detector (L-PAD)
RF-Generator 40 MHz “free-running”
Output power 1.1 kW
Argon flow Coolant:18 L min-1 , Auxiliary:
0.8 L min-1Nebulizer: 1 L min-1
Peristaltic pump 1.0 mL min-1
Nebulizer Pneumatic (glass concentric)
Spray chamber Glass cyclonic
Plasma viewing Axial
Sample uptake delay 30 s
Wave lengths 280.271 nm; 285.213 nm
All measurements were performed in triplicate. All standards were prepared by dilution of the multi element stock solution Multistandard CertiPUR IV from Merck using nitric acid (c = 1 mol L-1). Nitric acid (c = 1 mol L-1) was also used as calibration blank and rinsing agent between the samples. The calibration range was up to 10 mg L-1.
Validation parameters
In order to estimate the accuracy of the method, spiking experiments were carried out at three concentration levels (1.0, 3.0 and 5.0 mg L-1) by addition of a certain volume of aqueous multielement standard stock solution to selected digested samples prepared as described above. All spiked samples were prepared in triplicate and measured by ICP-OES.
Limit of detection and limit of quantification were determined by measuring a reagent blank solution and a spiked microwave assisted digested sample ten times, whereby the calculation is based on 3 for LOD and 9 forLOQ.
Calculation
The elemental contents were calculated from the measured concentrations in the digested solutions taking into consideration blanks, dilutions, and mass of dried sample used for digestion to obtain results of mass concentrations per dry weight. All standard deviations are based on measurements in triplicate. The obtained data were statistically analysed by a t-test (p 0.05) for revealing statistically significant differences.
Results and discussion
Analytical figures of merit
The recoveries found were 94.7% at 280.271 nm and 86.3% at 285.213 nm. The precision was comparable for both wavelengths, ranging from 0.5 up to 3%. The LOD determined was 0.1 ng g-1 dry tea powder without significant difference between the two wavelengths. The correlation coefficients for the calibration curves at both wavelengths were beyond 0.9995. Due to the better findings for the measurements at 280.271 nm, the data registered this wavelength were used for further evaluation.
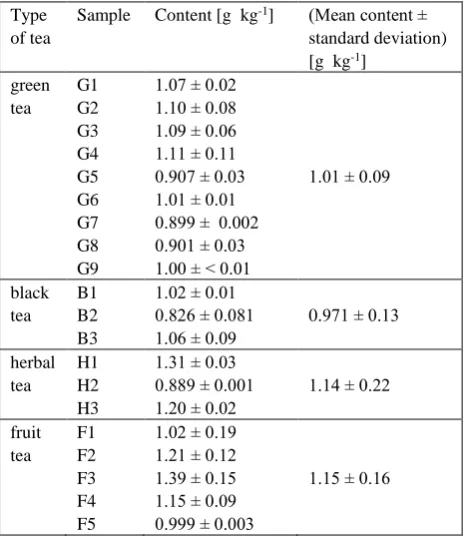
Table 3 Total magnesium concentrations in the different tea powder samples
Type of tea
Sample Content [g kg-1] (Mean content ±
standard deviation) [g kg-1]
green tea G1 G2 G3 G4 G5 G6 G7 G8 G9
1.07 ± 0.02 1.10 ± 0.08 1.09 ± 0.06 1.11 ± 0.11 0.907 ± 0.03 1.01 ± 0.01 0.899 ± 0.002 0.901 ± 0.03 1.00 ± < 0.01
1.01 ± 0.09
black tea
B1 B2 B3
1.02 ± 0.01 0.826 ± 0.081 1.06 ± 0.09
0.971 ± 0.13
herbal tea
H1 H2 H3
1.31 ± 0.03 0.889 ± 0.001 1.20 ± 0.02
1.14 ± 0.22
fruit tea F1 F2 F3 F4 F5
1.02 ± 0.19 1.21 ± 0.12 1.39 ± 0.15 1.15 ± 0.09 0.999 ± 0.003
1.15 ± 0.16
Magnesium content in the tea powders
The results for the total magnesium contents in the tea powders tested are shown as mean values in Table 3 along
calculated for each sample (triplicate measurement of duplicate digestion) as well as for each tea type as mean.
These data underwent a t-test (p 0.05) in order to see if there are any statistically significant differences between the various types of tea powder. Due to low number of samples and the high variability within one kind of tea powder, the differences in the magnesium contents found were all not statistically significant. This finding can be easily seen from the following diagram with the error bars (Figure 1).
The results found in the present study fit to those reported in the Polish study on black tea.12 The data obtained for the other tea types are in the same order of magnitude as given in literature, but a little bit lower. The biggest difference is evident for herbal tea based on the diverse composition of herbs in the mixtures analysed. Differences might be caused by different cultivars, soil compositions and agricultural practices.
Figure 1. Magnesium contents in the different teas types
Especially regarding fruit and herbal tea it can be assumed that the tendency of accumulation of a certain element strongly depends on the plant species.
Conclusions
The present investigation of various tea types did not reveal statistically significant differences between them. Real tea types (black and green) as well as herbal and fruit tea powders contain about 1 g kg-1 magnesium. These results are in the same of order of magnitude as data in tea leaves and medicinal herbals reported in literature.
Further studies will enlarge the data basis of metal concentrations in tea powders and tea infusions. Furthermore a correlation study between magnesium and other elements as well as with organic compounds present in the different tea types is planned.
References
1Karak, T., Bhagat, R.M., Food Res. Int., 2010, 43, 2234–2252.
2Powell, J. J., Burden, T. J., Thompson, R. P. H., Analyst, 1998,
123, 1721-1724.
4Prystai, E.A., Kies, C.V., Driskell, J.A., Nutr. Res., 1999, 19, 167-177.
5Lukaski, H.C., Nutrition, 2004, 20, 632-644..
6Pugh, R.E., Dick, D.G., Fredeen, A.L., Ecotox. Environ. Safety,
2002, 52, 273-279.
7Street, R., Drabek, O., Szakova,, J., Mladkova, L., Food Chem..,
2007, 104, 1662–1669.
8Pohl, P., Prusisz, B., Talanta, 2006, 69, 1227-1233.
9Gallaher, R.N., Gallaher, K., Marshall, A.J., Marshall, A.C., J.
Food Comp. Anal., 2006, 19, S53–S57.
10McKenzie, J.S., Jurado, J.M., de Pab, F., Food Chem., 2010, 123,
859-864
11Basgel, S., Erdemoglu, S.B., Sci. Tot. Environ., 2006, 359, 82-89.
12Łozak, A., Sołtyk, K., Ostapczuk,P., Fijałek, S., Sci. Tot.
Environ., 2002, 289, 33-40.
13Juranovic Cindric, I. Zeiner, M., Glamuzina, E., Stingeder, G.,
Microchem. J., 2012, doi:10.1016/j.microc.2012.06.013