©Science and Education Publishing DOI:10.12691/acis-3-1-3
Heterogeneous Data and Big Data Analytics
Lidong Wang*
Department of Engineering Technology, Mississippi Valley State University, Itta Bena, MS, USA *Corresponding author: [email protected]
Abstract
Heterogeneity is one of major features of big data and heterogeneous data result in problems in data integration and Big Data analytics. This paper introduces data processing methods for heterogeneous data and Big Data analytics, Big Data tools, some traditional data mining (DM) and machine learning (ML) methods. Deep learning and its potential in Big Data analytics are analysed. The benefits of the confluences among Big Data analytics, deep learning, high performance computing (HPC), and heterogeneous computing are presented. Challenges of dealing with heterogeneous data and Big Data analytics are also discussed.Keywords
: Big Data, Big Data analytics, heterogeneous data, deep learning, data mining, machine learning, heterogeneous computing,computational intelligence, artificial intelligenceCite This Article:
Lidong Wang, “Heterogeneous Data and Big Data Analytics.” Automatic Control and Information Sciences, vol. 3, no. 1 (2017): 8-15. doi: 10.12691/acis-3-1-3.1. Introduction
Heterogeneous data are any data with high variability of data types and formats. They are possibly ambiguous and low quality due to missing values, high data redundancy, and untruthfulness. It is difficult to integrate heterogeneous data to meet the business information demands. For example, heterogeneous data are often generated from Internet of Things (IoT). Data generated from IoT often has the following four features [1]. First, they are of heterogeneity. Because of the variety of data acquisition devices, the acquired data are also different in types with heterogeneity. Second, they are at a large-scale. Massive data acquisition equipment is used and distributed, not only the currently acquired data, but also the historical data within a certain time frame should be stored. Third, there is a strong correlation between time and space. Every data acquisition device is placed at a specific geographic location and every piece of data has a time stamp. The time and space correlation is an important property of data from IoT. Fourth, effective data accounts for only a small portion of the big data. A great quantity of noises may be collected during the acquisition and transmission of data in IoT. Among datasets acquired by acquisition devices, only a small amount of data is valuable. There are following types of data heterogeneity
[2]:
• Syntactic heterogeneity occurs when two data sources are not expressed in the same language. • Conceptual heterogeneity, also known as semantic
heterogeneity or logical mismatch, denotes the differences in modelling the same domain of interest.
• Terminological heterogeneity stands for variations in names when referring to the same entities from different data sources.
• Semiotic heterogeneity, also known as pragmatic heterogeneity, stands for different interpretation of entities by people.
Data representation can be described at four levels [3]. Level 1 is diverse raw data with different types and from different sources. Level 2 is called ‘unified representation’. Heterogeneous data needs to be unified. Also, too much data can lead to high cognitive and data processing costs. This layer converts individual attributes into information in terms of ‘what-when-where’. Level 3 is aggregation. Spatial data can be naturally represented in the form of spatial grids with thematic attributes. Processing operators are segmentation and aggregation, etc. Aggregation aids easy visualization and provides an intuitive query. Level 4 is called ‘situation detection and representation’. The situation at a location is characterized based on spatiotemporal descriptors determined by using appropriate operators at level 3. The final step in situation detection is a classification operation that uses domain knowledge to assign an appropriate class to each cell.
collection are needed for research purposes. The collection of metadata and data provenance is a major challenge when the data are collected under duress and stressful situations [6].
The challenges of Big Data algorithms concentrate on algorithm design in tackling the difficulties raised by big data volumes, distributed data distributions, and complex and dynamic data characteristics. The challenges include the following stages. First, heterogeneous, incomplete, uncertain, sparse, and multi-source data are pre-processed by data fusion techniques. Second, dynamic and complex data are mined after pre-processing. Third, the global knowledge obtained by local learning and model fusion is tested and relevant information is fed back to the pre-processing stage. Then the model and parameters are adjusted according to the feedback. In the whole process, information sharing is not only a promise of smooth development of each stage, but also a purpose of big data processing [7].
This paper focuses on four aspects: 1) introduces data processing methods including data cleaning, data integration, and dimension reduction and data normalization for heterogeneous data and Big Data analytics; 2) presents big data concepts, Big Data analytics, and Big Data tools; 3) compares traditional DM/ML methods with deep learning, especially their feasibility in Big Data analytics; 4) discusses the potential of the confluences among Big Data analytics, deep learning, HPC, and heterogeneous computing.
2. Data Processing Methods for
Heterogeneous Data and
Big Data Analytics
2.1. Data Cleaning
Data cleaning is a process to identify, incomplete, inaccurate or unreasonable data, and then to modify or delete such data for improving data quality [1]. For example, the multisource and multimodal nature of healthcare data results in high complexity and noise problems. In addition, there are also problems of missing values and impurity in the high-volume data. Since data quality determines information quality, which will eventually affect the decision-making process, it is critical to develop efficient big data cleansing approaches to improve data quality for making accurate and effective decisions [8].
A missing value for a variable is one that has not been entered into a dataset, but an actual value exists [9]. Simple (non-stochastic) imputation is often used. In simple imputation, missing values in a variable are replaced with a single value (for example, mean, median, or mode). However, simple imputation produces biased results for data that aren’t missing completely at random (MCAR). If there are moderate to large amounts of missing data, simple imputation is likely to underestimate standard errors, distort correlations among variables, and produce incorrect p-values in statistical tests. This approach should be avoided for most missing data problems [10]. The study of the linear correlations enabled
to fill in some new unknown values. People may try to explore the correlations between the variables with unknowns and the nominal variables of this problem. Unknown values could be filled by exploring more accurate correlations. Whenever people handle a dataset with missing values, they can follow several strategies. The most common are: 1) remove the cases with unknowns; 2) fill in the unknown values by exploring the similarity between cases; 3) fill in the unknown values by exploring the correlations between variables; and 4) use tools that are able to handle these values [11].
A database may also contain irrelevant attributes. Therefore, relevance analysis in the form of correlation analysis and attribute subset selection can be used to detect attributes that do not contribute to the classification or prediction task. Including such attributes may otherwise slow down and possibly mislead the learning step. Typically, data cleaning and data integration are performed as a pre-processing step. Inconsistencies in attribute or dimension naming can cause redundancies in the resulting dataset. Data cleaning can be performed to detect and remove redundancies that may have resulted from data integration. The removal of redundant data is often regarded as a king of data cleaning as well as data reduction [12].
2.2. Data Integration
In the case of data integration or aggregation, datasets are matched and merged on the basis of shared variables and attributes. Advanced data processing and analysis techniques allow to mix both structured and unstructured data for eliciting new insights; however, this requires “clean” data. Data fusion techniques are used to match and aggregate heterogeneous datasets for creating or enhancing a representation of reality that helps data mining. Mid-level data fusion methodologies that merge structured and machine-produced data basically work well. On the other hand, high level data fusion tasks for merging multiple unstructured analogue sensor inputs remains challenging [13].
Data integration tools are evolving towards the unification of structured and unstructured data and will begin to include semantic capabilities. It is often required to structure unstructured data and merge heterogeneous information sources and types into a unified data layer. Most data integration platforms use a primary integration model based on either relational or XML data types. Advanced Data Virtualization Platforms have been proposed which use an extended integration data model with the ability to store and read/write all types of data in their native format such as relational, multidimensional, semantic data, hierarchical, and index files, etc. [14].
process is to identify correspondences between semantically identical entities of the schemas; 2) catalogue integration — in Business-to-Business (B2B) applications, trade partners store information about their products in electronic catalogues. Finding correspondences among entries of the catalogues is referred to the catalogue matching problem.
Knowledge acquisition from autonomous, semantically heterogeneous and distributed data sources, query-centric, and federated approaches to data integration are of special interest [5]. For unstructured and structured data integration, following approaches can be used [16]:
• Natural language processing pipelines: The Natural Language Processing (NLP) can be directly applied to projects that demand dealing with unstructured data.
• Entity recognition and linking: Extracting structured information from unstructured data is a fundamental step. Part of the problem can be resolved by information extraction techniques such as entity recognition, relation extraction, and ontology extraction. These tools help to automatically build semi-structured knowledge. There are frameworks that are mature to certain classes of information extraction problems although their adoption remains limited to early-adopters.
• Use of open data to integrate structured & unstructured data: Entities in open datasets can be used to identify named entities (people, organizations, places), which can be used to categorize and organize text contents. Named entity recognition and linking tools such as DBpedia Spotlight can be used to link structured and unstructured data. While bringing together data from heterogeneous systems, there are three sources of data errors: data entry errors, data type incompatibilities, and semantics incompatibilities in business entity definitions. Traditionally enterprises used ETL (Extract, Transform and Load) and data warehouses (DW) for data integration. However, a technology known as “Data Virtualization (DV)” has found some acceptance as an alternative data integration solution in last few years. “Data Virtualization” is a federated database termed as composite database. Data Virtualization and Enterprise Data Standardization has the promise of reducing the cost and implementation time of data integration. Unlike DW, DV defines data cleaning, data joins and transformations programmatically using logical views. DV allows for extensibility and reuse by allowing for the chaining of logical view. Enterprise data standardization mostly avoids data type mismatches and semantic incompatibilities in data. DV is not a replacement for DW; DV could offload certain analytical workloads from DW. Regression analysis, multi-dimensional data structures, and the analysis of large amounts of data mostly require DW [17].
Data lakes are an emerging and powerful approach to the challenges of data integration as enterprises increase their exposure to mobile and cloud-based applications and the sensor-driven Internet of Things (IoT). Data lakes are repositories for large quantities and varieties of data, both structured and unstructured. Data lakes are more suitable for the less-structured data that companies need to process. However, difficulties associated with the data lakes integration challenges include, but are not limited to:
1) developing advanced metadata management over raw data extracted from heterogeneous data sources; 2) dealing with the structural metadata from the data sources, and annotating data and metadata with semantic information to avoid ambiguities. Without any metadata or metadata management, dumping all data into a data lake would lead to a ‘data swamp’ and the data lake is hardly usable because as the structure and semantics of the data are not known [18].
2.3. Dimension Reduction and Data
Normalization
There are several reasons to reduce the dimensionality of the data. First, high dimensional data impose computational challenges. Second, high dimensionality might lead to poor generalization abilities of the learning algorithm in some situations (for example, the sample complexity increases exponentially with the dimension in nearest neighbour classifiers). Finally, dimensionality reduction can be used for finding meaningful structure of the data, the interpretability of the data, and illustration purposes [19].
Feature subset selection (FSS) is a well-known task of data mining and machine learning. Genetic algorithms (GAs),
Hill Climbing
, andSimulated Annealing
, etc. are commonly used algorithms for feature subset selection tasks. The dimensionality reduction made by an FSS process can provide several advantages: 1) a faster induction of the final classification model, 2) an improvement of the final classification model’s comprehensibility, and 3) an improvement in classification accuracy [20]. Techniques for feature selection can be divided in two approaches: feature ranking and subset selection. In the first approach, features are ranked by some criteria and then features above a defined threshold are selected. In the second approach, one searches a space of feature subsets for the optimal subset. Moreover, the second approach can be split in three parts: 1) filter approaches — people select the features first, then they use this subset to execute a classification algorithm; 2) embedded approaches — the feature selection occurs as part a classification algorithm; and 3) wrapper approaches — an algorithm for classification is used over the dataset to identify the best features [21].In datasets with a large number of variables, there is usually much overlap in the information covered by the set of variables. One simple way to find redundancies is to check a correlation matrix obtained by correlation analysis
• Pre-processing: Learning complex models of high-dimensional data is often very slow and is also prone to overfitting. The number of parameters in a model is usually exponential in the number of dimensions. With PCA one can also whiten the representation, which rebalances the weights of the data to give better performance in some cases.
• Modeling: PCA learns a representation that is sometimes used as an entire model, e.g., a prior distribution for new data.
• Compression: PCA can be used to compress data, by replacing data with its low-dimensional representation. Key steps for using PCA or EFA (Exploratory Factor Analysis) are as follows: 1) prepare the data such as screening the data for missing values; 2) select a factor model, deciding whether PCA (data reduction) or EFA (uncovering latent structure) is a better fit for the research goals and choosing a specific factoring method (for example, maximum likelihood) if an EFA approach is selected; 3) decide how many components/factors to extract; and 4) extract the components/factors. As for selecting the number of components to extract, several criteria are available for deciding how many components to retain in a PCA. They include: 1) basing the number of components on prior experience and theory; 2) selecting the number of components needed to account for some threshold cumulative amount of variance in the variables (for example, 80 percent); 3) selecting the number of components to retain by examining the eigenvalues of the correlation matrix among the variables [10].
Some algorithms require that the data be normalized (standardized) before the algorithm can be effectively implemented. Normalization (or standardization) means replacing each original variable by a standardized version of the variable that has unit variance. The effect of this normalization (standardization) is to give all variables equal importance in terms of the variability. Data is often normalized before performing the PCA [22].
3. Big Data, Big Data Analytics and Big
Data Tools
There are gaps between Big Data and the current capabilities of data analysis in continuous auditing (CA) systems. Specifically, the original three Vs (huge Volume, high Velocity, and huge Variety) introduce the gaps of data consistency, data identification, and data aggregation to link databases in a CA system. Each of the gaps creates the corresponding challenges in Table 1. Data identification refers to records that link two or more separately recorded pieces of information about the same individual or entity. When data are structured, identification is easy. However, identification becomes difficult in the big data audit where much of the data might be unstructured. The lack of data integrity usually relates to data tampering and incomplete data. Data consistency is the most important issue for CA of big data and relates to interdependent data between applications and across an organization. Data confidentiality means certain data or the associations among data points are sensitive and cannot be released to others. In the era of big data, data can easily be associated with other data. Once
some sensitive data are leaked, they can propagate with high velocity and connect to a large amount of related data. Thus, big data confidentiality becomes even more urgent and important to preserve brand image and secure competitive advantage. Data aggregation is necessary for the normal operation of continuous auditing using big data to meaningfully summarize and simplify the big data that is most likely coming from different sources [25].
Table 1. Big Data Analytics in Continuous Auditing [25]
Big Data Features: 4Vs
• Volume • Variety • Velocity • Veracity
Big Data Gaps
• Data identification • Data integrity • Data consistency
• Data confidentiality
• Data aggregation
Challenges in Continuous Auditing
• Conflicting data • Incomplete data
• Data with various identifies • Data with different formats • Asynchronous data • Illegally tampered data • Searching encrypted data • Auditing encrypted data • Auditing aggregated data
Heterogeneity is one of the essential features of big data. The data from different and various sources inherently possess many different types and representation forms, and it may be interconnected, interrelated, and represented inconsistently. Heterogeneity of big data also means that it is an obligation to acquire and deal with structured, semi-structured, and even entirely unstructured data simultaneously [26]. Big data relates large-volume and complex datasets with multiple independent sources. The analysis of big data can be troublesome because it often involves the collection and storage of mixed data based on different patterns or rules (heterogeneous mixture data)
[27]. It is important to increase context awareness. For example, existing data in manufacturing has no relation to the context about users’ history, schedule, habits, tasks, and location, etc. In the context of big data, contextualisation can be an attractive paradigm to combine heterogeneous data streams for improving the quality of a mining process or classifier. In addition, context awareness has demonstrated to be useful in reducing resource consumption by concentrating big data generation processes (e.g., the monitoring of real-world situations via cyber-physical systems) only on the sources that are expected to be the most promising ones depending on currently applicable (and often application-specific) context [28]. There are three paradoxes of big data [29]:
but its collection is invisible; and its tools and techniques are opaque, shrouded by the layers of physical, legal, and technical privacy by design. • The power paradox — Big data sensors and big
data pools are predominantly in the hands of powerful intermediary institutions, not ordinary people. If privacy, autonomy, transparency, and identity protections are not built into big data from the outset, the Power Paradox will diminish big data’s lofty ambitions.
Generally speaking, values hidden in big data depend on data freshness. Therefore, an importance principle related to the analytical value should be developed to decide which data shall be discarded and which data shall be stored [1]. For a solution of big data analytics, the following needs to be completed [30]:
• Data loading — Software has to be developed to load data from multiple and various data sources. A system needs to deal with the distributed nature of Hadoop on the one side and the non-distributed nature of the data source. The system needs to deal with corrupted records and need to provide monitoring services.
• Data parsing — Most data sources provide data in a certain format that needs to be parsed into the Hadoop system. Some formats like JSON are complicated to parse because a record can be many lines of text and not just one line per record.
• Data analytics —A solution of big data analytics needs to support rapid iterations in order for data to be properly analyzed.
Types of Big Data analytical methods generally include
[40]: 1) descriptive analytics — involving the description and summarization of knowledge patterns; 2) predictive analytics — forecasting and statistical modelling to determine future possibilities; and 3) prescriptive analytics — helping analysts in decision-making by determining actions and assessing their impacts. Distributed systems, massive parallel processing (MPP) databases, non-relational, or in-memory databases have been used for big data. MPP databases provide high query performance and platform scalability. Non-relational databases such as Not Only SQL (NoSQL) are used to store and manage unstructured or non-relational data and aim for massive scaling, data model flexibility, and simplified application development and deployment. In-memory databases manage the data in server memory, thus eliminating disk input/output (I/O) and enabling real-time responses from the database. In addition, in-memory databases have been used for advanced analytics on big data, especially to speed the access to and scoring of analytic models for analysis [41]. There are some Big Data tools such as Hive, Splunk, Tableau, Talend, RapidMiner, and MarkLogic. Hive makes it easy to manage and query large datasets residing in the distributed storage. Splunk focuses on in harnessing machine data created from various sources like sensors and websites. Tableau is a data visualization tool that enables users to create scatter bar charts, plots, and maps. Talend is an open source tool for developing, testing and deploying data management and application integration products. RapidMiner gives businesses a centralized solution that features a powerful and robust graphical user interface that enables users to create,
maintain, and deliver predictive analytics. MarkLogic can be used to deal with bulky data loads and allow users to access it through real-time updates and alerts [42].
When velocity gets very high, big data tools will likely be the only option. Big data tools are able to extract and analyse data from enormous datasets very quickly, which is particularly useful for rapidly changing data that can be analysed through in-memory processing. Big Data tools are able to distribute complex processing jobs to a large number of nodes, reducing the computational complexity
[31]. Hadoop over HDFS is the underlying architecture. Oozie and Elastic MapReduce (EMR) with Flume and Zookeeper are used for handling the volume and veracity of data, which are standard Big Data management tools
[32]. MapReduce works with numeric and nominal values. It can process a massive job in a short period of time; however, algorithms must be rewritten and understanding systems engineering is required [23]. With YARN, Hadoop now supports various programming models and both near-real-time and batch outputs [18]. There are many quality software tools allowing to reap the benefits of big data. For example, the Kitenga Analytics Suite from Dell is an industry leading big data search and analytics platform that was designed to integrate information of all types into easily deployed visualizations. Kitenga is Hadoop-enabled for big data scalability and allows for integration of heterogeneous data sources and cost efficient storage of growing data volumes. Kitenga can directly analyse Hadoop results using information visualization tools that bind directly to Hadoop Distributed File System (HDFS) files as well as index the created data and metadata into a searchable form with embedded visualization capabilities [33]. System administrators responsible for maintaining Big Data compute platforms often use one of the following three strategies [34]:
• Internal compute cluster. For long-term storage of unique or sensitive data, it often makes sense to create and maintain an Apache Hadoop cluster using a series of networked servers within the internal network of an organization.
• External compute cluster. There is a trend across the IT industry to outsource elements of infrastructure to ‘utility computing’ service providers. Some organizations make it simple for system administrators to rent pre-built Apache Hadoop clusters and data storage systems.
• Hybrid compute cluster. A common hybrid option is to provision external compute cluster resources using services for on-demand Big Data analysis tasks and create a modest internal computer cluster for long-term data storage.
The analysis of big data involves multiple distinct phases as shown in the Table 2[35] below, each of which introduces challenges. Many significant challenges extend beyond the analysis phase. For example, Big data has to be managed in context, which may be noisy, heterogeneous, and not include an upfront model. Doing so raises the need to track provenance and handle error and uncertainty
and data privacy; 3) lifting the benefits from already available Open Data and Linked Data sources. The challenges of Big Data include not only the scale, but also heterogeneity, lack of structure integration, data quality, privacy, and security, etc. Achieving the great potential of big data requires a thoughtful and holistic approach to data management, analysis and information intelligence [43].
Table 2. The Pipeline and Some Challenges of Big Data Analytics Aspects Description
Major Steps in the Analysis of Big Data
Acquisition/Recording, Cleaning/Extraction/Annotation, Integration/Aggregation/Representation, Analysis/Modelling, Interpretation
Challenges during the Steps Heterogeneity, Timeliness, Scale, Privacy, Human Collaboration
Even if a correlation may prove to be robust over a given period, Big Data analytics alone cannot provide insight into what might cause the correlation to break down — nor what pattern may emerge in its place. A critique of Big Data analytics is that the existence of massive datasets does not eradicate traditional statistical traps – especially those of sample error and sample bias. Claims relating to the ubiquity of sensor networks and other sources of big data are often exaggerated or ignore specific and consistent sources of bias [13]. Future requirements that the next generation of Big Data technologies should address [16]:
• Handle the growth of the Internet — As more users come online, Big Data technologies will need to handle larger volumes of data.
• Real-time processing — Big Data processing was initially carried out in batches of historical data. In recent years, stream processing systems such as Apache Storm have become available and enable new application capabilities.
• Process complex data types — Data such as graph data and possible other types of more complicated
data structures need to be easily processed by Big Data technologies.
• Efficient indexing — Indexing is fundamental to the online lookup of data and is therefore essential in managing large collections of documents and their associated metadata.
• Dynamic orchestration of services in multi-server and cloud contexts — Most platforms today are not suitable for the cloud and keeping data consistent between different data stores is challenging.
• Concurrent data processing — Being able to process large quantities of data concurrently is very useful for handling large volumes of users at the same time.
4. Traditional Data Mining and Machine
Learning, Deep Learning and Big Data
Analytics
Outlier detection is one of the tasks of data mining. Computer-based methods for outlier detection can be categorized into four approaches: the statistical approach, the density-based local outlier approach, the distance-based approach, and the deviation-based approach [12]. Local Outlier Factor (LOF) is an algorithm for identifying density-based local outliers. The local density of a point is compared with that of its neighbours through LOF. If the former is significantly lower than the latter (with an LOF value being greater than one), the point is in a sparser region than its neighbours, which suggests it be an outlier. A shortcoming of LOF is that it only works on numeric data. Another way to detect outliers is clustering. Clustering techniques could be used to identify clusters of one or a few records that are distant from others. By grouping data into clusters, those data that are not assigned to any clusters are taken as outliers
[22,36].
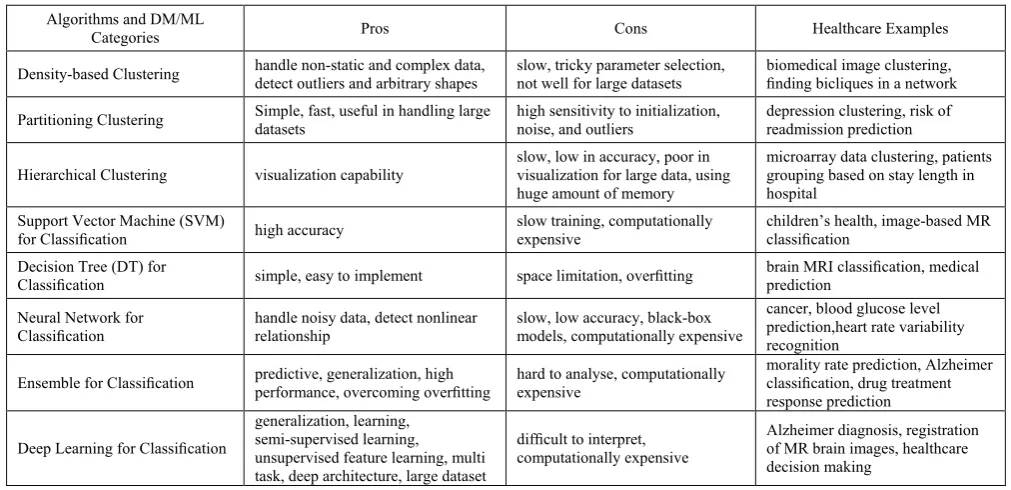
Table 3. Deep Learning and Some Traditional Data Mining (DM) and Machine Learning (ML) Algorithms Used in Health Care [8]
Algorithms and DM/ML
Categories Pros Cons Healthcare Examples
Density-based Clustering handle non-static and complex data, detect outliers and arbitrary shapes slow, tricky parameter selection, not well for large datasets biomedical image clustering, finding bicliques in a network
Partitioning Clustering Simple, fast, useful in handling large datasets high sensitivity to initialization, noise, and outliers depression clustering, risk of readmission prediction
Hierarchical Clustering visualization capability slow, low in accuracy, poor in visualization for large data, using huge amount of memory
microarray data clustering, patients grouping based on stay length in hospital
Support Vector Machine (SVM)
for Classification high accuracy slow training, computationally expensive children’s health, image-based MR classification
Decision Tree (DT) for
Classification simple, easy to implement space limitation, overfitting brain MRI classification, medical prediction
Neural Network for
Classification handle noisy data, detect nonlinear relationship slow, low accuracy, black-box models, computationally expensive
cancer, blood glucose level prediction,heart rate variability recognition
Ensemble for Classification predictive, generalization, high performance, overcoming overfitting hard to analyse, computationally expensive morality rate prediction, Alzheimer classification, drug treatment response prediction
Deep Learning for Classification
generalization, learning, semi-supervised learning, unsupervised feature learning, multi task, deep architecture, large dataset
difficult to interpret, computationally expensive
Non-numerical or alpha variables present some problems different from those of numerical variables. Some tools such as decision trees can handle alpha values in their alpha form. Other tool, such as neural networks can only handle a numeric representation of the alpha value [9]. Because of the diversity of database types, some databases may contain complex data objects including temporal data, spatial data, transaction data, hypertext, or multimedia data. It is unrealistic to expect one system to mine all kinds of data. Therefore, one may expect to have different data mining systems for different kinds of data [12]. There is a research direction called privacy-preserving data mining that aims to reconcile the tension between big data and privacy [28]. A framework was proposed to address the problem of learning from heterogeneous data, which is called Collective Data Mining (CDM) [5].
Due to unprecedented amounts of data or data complexity, high performance data mining is often required. High performance in data mining means to take advantage of parallel database management systems and additional CPUs to gain performance benefits. The primary objective of parallelism is to gain performance improvement. There are two main measures of performance improvement. The first is throughput – the number of tasks that can be completed in a given time interval. The second is response time – the amount of time it takes to complete a single task from the time the task is submitted. The two measures are normally quantified by the following metrics: scale up and speed up [20]. The Big Data and Analytics Reference Architecture was presented and described which delivers: 1) an approach to information management that unifies all forms of data including structured, semi-structured, and unstructured data; 2) ability to handle batch and real-time data feeds; 3) high performance in-database and in-memory analytics [37].
Deep learning algorithms use a huge amount of unsupervised data to automatically extract complex representation. Deep learning architectures have the capability to generalize in non-local and global ways. It extracts representations directly from unsupervised data without human interference. A key benefit of deep learning is the analysis and learning of massive amounts of unsupervised data, making it a valuable tool for Big Data analytics where raw data is largely unlabelled and un-categorized [38]. Deep learning and HPC working with Big Data improve computation intelligence and success; deep learning and heterogeneous computing (HC) working with Big Data increase success [39]. Analysing data with deep learning algorithms is a process to train the high-level data representation patterns based on a portion of the available input corpus, and then utilize the remaining input corpus with the learnt patterns for extracting the data abstractions and representations. A question to explore is what volume of input data is generally necessary to train useful or good data representations by deep learning algorithms. This can be future work on deep learning in Big Data analytics [38].
Table 3 outlines the advantages and disadvantages of deep learning and traditional data mining and machine learning algorithms in healthcare applications. Traditional data mining and machine learning methods have challenges in
handling large volumes of data, high dimension data, and un-categorized and unsupervised data, etc. Therefore, they have limitations in Big Data analytics.
5. Conclusion
It is important to develop efficient big data cleansing approaches to improve data quality. Data Virtualization and Data lakes are powerful approaches that help data integration. PCA and EFA are often used to perform data dimension reduction. Heterogeneity of big data also means dealing with structured, semi-structured, and unstructured data simultaneously. There are challenge in each phase of Big Data analytics. These include real-time processing, handling complex data types, and concurrent data processing, etc.
Traditional data mining and machine learning methods have limitations in Big Data analytics. Deep learning is capable of the analysis and learning of massive amounts of unsupervised data; therefore, it has the potential in Big Data analytics where raw data is largely unlabelled and un-categorized. Confluences among Big Data analytics, heterogeneous computing (HC), HPC, and Deep learning can be a research topic for heterogeneous big data.
References
[1] Chen M, Mao S, Liu Y. Big data: A survey. Mobile Networks and Applications. 2014 Apr 1; 19(2): 171-209.
[2] Jirkovský V, Obitko M. Semantic Heterogeneity Reduction for Big Data in Industrial Automation. InITAT 2014.
[3] Singh VK, Gao M, Jain R. Situation recognition: an evolving problem for heterogeneous dynamic big multimedia data. InProceedings of the 20th ACM international conference on Multimedia 2012 Oct 29 (pp. 1209-1218). ACM.
[4] Hai R, Geisler S, Quix C. Constance: An intelligent data lake system. In Proceedings of the 2016 International Conference on Management of Data 2016 Jun 26 (pp. 2097-2100). ACM.
[5] Caragea D. Learning classifiers from distributed, semantically heterogeneous, autonomous data sources (Doctoral dissertation, Iowa State University), 2004, 1-225.
[6] Anderson K, Arora A, Aoi S, Fujinuma K, et al. Big Data and Disaster Management, Technical Report No. GIT-CERCS-13-09; Georgia Institute of Technology, CERCS. A Report from the JST/NSF Joint Workshop, JST/NSF Joint Workshop Report on Big Data and Disaster Management, Editors, C. Pu and M. Kitsuregawa, May 2013.
[7] Wu, X., Zhu, X., Wu, G. Q., & Ding, W. (2014). Data mining with big data. IEEE Transactions on Knowledge and Data Engineering, 26(1), 97-107.
[8] Fang R, Pouyanfar S, Yang Y, Chen SC, Iyengar SS. Computational health informatics in the big data age: a survey. ACM Computing Surveys (CSUR). 2016 Jun 14; 49(1): 12.
[9] Pyle D. Data preparation for data mining. Morgan Kaufmann, 1999.
[10] Kabacoff R. R in action: data analysis and graphics with R. Manning Publications Co.; 2015 Mar 3.
[11] Torgo L, Torgo L. Data mining with R: learning with case studies. Boca Raton, FL:: Chapman & Hall/CRC; 2011.
[12] Han J, Pei J, Kamber M. Data mining: concepts and techniques. Elsevier; 2011 Jun 9.
[13] Data B. Transport: Understanding and assessing options. Corporate Partnership Board Report, the Organization for Economic Cooperation and Development (OECD)/International Transport Forum, May 2015, 1-66.
[15] Rudin C., Dunson D., Irizarry R., Ji H., Laber E., Leek J., & Wasserman L. Discovery with data: Leveraging statistics with computer science to transform science and society. July 2, 2014, 1-27.
[16] Curry E, Kikiras P, Freitas A. et al. Big Data Technical Working Groups, White Paper, BIG Consortium, 2012.
[17] Pullokkaran LJ. Analysis of data virtualization & enterprise data standardization in business intelligence (Doctoral dissertation, Massachusetts Institute of Technology), 2013.
[18] Stein B, Morrison A. The enterprise data lake: Better integration and deeper analytics. PwC Technology Forecast: Rethinking integration. 2014(1), 1-9.
[19] Shalev-Shwartz S, Ben-David S. Understanding machine learning: From theory to algorithms. Cambridge university press; 2014 May 19.
[20] Abbass HA, editor. Data Mining: A Heuristic Approach: A Heuristic Approach. IGI Global; 2001 Jul 1.
[21] Wikibook, Data Mining Algorithms In R - Wikibooks, open books for an open world. PDF generated using the open source mwlib toolkit. See http://code.pediapress.com/, 2014 14 Jul.
[22] Galit S, Nitin P, Peter B. Data Mining in Excel: Lecture Notes and Cases. Resampling Stats, Inc., USA, 2005 December 30.
[23] Harrington P. Machine learning in action. Greenwich, CT: Manning; 2012 Apr 16.
[24] Hertzmann A, Fleet D. Machine Learning and Data Mining Lecture Notes. Computer Science Department, University of Toronto. 2010.
[25] Zhang J, Yang X, Appelbaum D. Toward effective Big Data analysis in continuous auditing. Accounting Horizons. 2015 Jun; 29(2):469-76.
[26] Tak PA, Gumaste SV, Kahate SA, The Challenging View of Big Data Mining, International Journal of Advanced Research in Computer Science and Software Engineering, 5(5), May 2015, 1178-1181.
[27] Yenkar V, Bartere M. Review on “Data Mining with Big Data”. International Journal of Computer Science and Mobile Computing, 3(4), April 2014, 97-102.
[28] NESSI, Big Data: A New World of Opportunities, NESSI White Paper, the Networked Software and Services Initiative (NESSI), December 2012, 1-25.
[29] Stanford Law School, Big Data and Privacy: Making Ends Meet, The Future of Privacy Forum (FPF), September 10th, 2013, 1-122.
[30] Datameer, Inc. The Guide to Big Data Analytics, White Paper, 2013, 1-39.
[31] Schotman R, Mitwalli A. Big Data for Marketing: When is Big Data the right choice? Canopy – The Open Cloud Company, 2013, p8.
[32] Jaseena KU, David JM. Issues, challenges, and solutions: big data mining. NeTCoM, CSIT, GRAPH-HOC, SPTM–2014. 2014: 131-40.
[33] Daniel D. Gutierrez, InsideBIGDATA Guide to Big Data for Finance, White Paper, DELL and intel, Whitepaper, 2015, 1-14.
[34] Kreuter F, Berg M, Biemer P, Decker P, Lampe C, Lane J, O'Neil C, Usher A. AAPOR Report on Big Data. Mathematica Policy Research; 2015 Feb 12.
[35] Labrinidis A, Jagadish HV. Challenges and opportunities with big data. Proceedings of the VLDB Endowment. 2012 Aug 1; 5(12): 2032-2033.
[36] Zhao Y. R and data mining: Examples and case studies. Academic Press; 2012 Dec 31.
[37] Chappelle D. Big Data & Analytics Reference Architecture, Oracle White Paper, Oracle Enterprise Transformation Solutions Series, September 2013, 1-39.
[38] Najafabadi MM, Villanustre F, Khoshgoftaar TM, Seliya N, Wald R, Muharemagic E. Deep learning applications and challenges in big data analytics. Journal of Big Data. 2015 Feb 24; 2(1): 1.
[39] Wu R, Deep learning meets heterogeneous computing, Workshop, Baidu Inc., 2014.
[40] Sivarajah U, Kamal MM, et al. Critical Big Data Analysis Challenges and Analytical Methods, Journal of Business Research, 70, (2017, 263-286.
[41] Elgendy N and Elragal A, Big Data Analytics: A Literature Review Paper. P. Perner (Ed.): ICDM 2014, LNAI 8557, Springer International Publishing Switzerland, 2014, 214-227.
[42] Yusuf Perwej, An Experiential Study of the Big Data, International Transaction of Electrical and Computer Engineers System, 2017, Vol. 4, No. 1, 14-25.
![Table 1. Big Data Analytics in Continuous Auditing [25]](https://thumb-us.123doks.com/thumbv2/123dok_us/1087448.2082831/4.595.305.552.180.402/table-big-data-analytics-in-continuous-auditing.webp)