ADSORBENT FOR EFFICIENT REMOVAL OF MERCURY(II)
FROM AQUEOUS SOLUTION
Saad S.M. Hassan,
[a]*Ayman K. Kamel,
[a]Nassar S. Awwad,
[b,c]Awaad H. A.
Aboterika
[d]and Ibrahim S. Yahia
[e,f]Keywords: Removal, mercury, zinc oxide, sulfur, wastewater.
Decontamination of mercury from aqueous media remains a serious task for health and ecosystem protection. Removal of Hg(II) from the aqueous solution by ZnO:S has been investigated and elucidated. The effect of various parameters such as solution pH, adsorbent dose, contact time, initial adsorbate concentration has been studied and optimized. The optimized parameters for metal ion are pH value of 2.4, the equilibrium time was attained after 30 min, and the maximum removal percentage was achieved at an adsorbent loading weight of 0.08 g. It was found that the adsorption capacity of ZnO:S increased with increase in the initial mercury concentration. The equilibrium and kinetic data were found to be in good agreement with Freundlich isotherm model.
* Corresponding Authors Fax: +20 2 26822991
E-Mail: [email protected] (S.S.M. Hassan) [a] Department of Chemistry, Faculty of Science, Ain Shams
University, Cairo, Egypt
[b] Analytical Chemistry Department, Hot Labs Center, Atomic Energy Authority, Egypt
[c] Department of Chemistry, Faculty of Science, King Khalid University, P.O. Box 9004, Abha, Saudi Arabia
[d] Central laboratory, Faculty of Science, Ain Shams University, Cairo, Egypt
[e] Nano-Science & Semiconductors Labs, Department of Physics, Faculty of Education, Ain Shams University, Roxy, Cairo, Egypt
[f] Department of Physics, Faculty of Science, King Khalid University, P.O. Box 9004, Abha, Saudi Arabia.
INTRODUCTION
Mercury with unusual chemical and physical properties is universal pollutant. Even at very low concentration, mercury causes potential hazards due to its accumulation in food chain. A special characteristic of mercury is its strong absorption into biological tissues and slow elimination from them.1 The major effects of mercury poisoning manifest as
neurological and renal disturbances as it can easily pass the blood-brain barrier and affect the fetal brain. High concentrations of Hg(II) cause impairment of pulmonary function and kidney, chest pain and dyspnousea.2,3
Numerous cases of mercury poisoning, or Minamata disease are reported in different countries around the world which resulted due to the consumption of fish and shellfish by human.4
Because of the above reasons, mercury must be removed to very low levels from wastewater generated in industries such as metal smelting and caustic-chlorine production in mercury cells, metal processing, plating and metal finishing.5 Numerous physical and chemical separation
processes, such as solvent extraction, ion-exchange, precipitation, membrane separation, reverse osmosis, coagulation and photoreduction,6-9 have been applied for
effective reduction of mercury concentrations from various aqueous solutions.
Among various technologies developed over the years for mercury removal, adsorption holds great promise due to the
simplicity and relatively low-cost of adsorption technology as well as the effectiveness of adsorption method to purify water.10
Low-cost adsorbents already reported for the removal of Hg(II) include fly ash,11 coal,12-13-14 tree bark,15 human hair, 16 fertilizer waste,17 used tea leaves,18 waste rubber, 19
rice-husk ash,20 flax shive,21 oil shale,22 camel bone charcoal23
and iron ore slime.24
The aim of this work is to assess the ability of ZnO:S to adsorb Hg(II) from aqueous solution. Effect of various parameters e.g. solution pH, contact time, initial Hg(II) concentration and solid/liquid ratio was studied for the optimization of removal process. Furthermore, Hg(II) adsorption isotherm and mechanism were measured and discussed.
EXPERIMENTAL
Materials
A stock Hg(II) nitrate (1000 mg L-1) standard solution was
supplied by Merck. A solution (10 mg L-1) was prepared by
dilution with deionized distilled water and used as adsorbate. Adsorbent, i.e. ZnO nanoparticles was prepared by co-precipitation method. The starting materials were zinc acetate (Zn(OAc)2·2H2O), thiourea and sodium hydroxide.
To prepare sulphur doped zinc oxide (S:ZnO) with small percentage of sulphur, a 1 molar solution of zinc acetate was prepared in deionized water (Solution A). Similarly, 1 molar solution of thiourea was prepared in deionized water (Solution of B).
Then 50 mL of solution A and B are left on the magnetic stirrer/hotplate for 1 h at 60 oC and stirred at 800 rpm and
deionized water/ethanol. The dry precipitate was left in a muffle furnace at 550 ºC for 2 h. After that, the furnace was slowly naturally cooled to the room temperature. A yellowish white precipitate was obtained.
Equipment
FTIR spectrometry was carried out with a Thermo-Nicolet model iS10. The surface micromorphology of materials was investigated using a scanning electron microscope (SEM) and element composition was analyzed using energy dispersive X-ray (EDX) by Joel Model LVSEM 6360 (Japan). An Orion digital pH/mV meter (Model SA 720) with a combination glass electrode (Orion 81-02) was used for all pH measurements. A Perkin-Elmer Flow Injection Mercury System (Model FIMS-100) was used for determination of mercury.
Sorption experiments
Batch sorption experiments were conducted by using 25 mL aliquots of a test solution containing 1.0 mg Hg(II). The solutions were adjusted to pH 1–7 and placed in 250 mL reagent bottles. A known quantity (0.01–0.10 g) of ZnO:S was added to each bottle and the pH was adjusted to 2.4 using 0.1 N of either nitric acid or sodium hydroxide solution. The solutions were agitated at a speed of 150 rpm for 5–60 min at 25 ± 1 C in a shaking incubator. The zinc oxide:S was separated by filtration and mercury(II) content of the filtrate was determined using Flow Injection Mercury System (FIMS). The percentage removal (R, %) was calculated according to the following equation:
(1)
where
R is the percent removal of mercury,
C0 and Ce are the initial and final equilibrium mercury
concentration respectively (mg L-1).
Adsorption isotherms were obtained with different initial concentrations of Hg(II) while maintaining ZnO:S dosage at a constant level. In order to correct for any adsorption of mercury(II) on the container surface, control experiments were carried out in the absence of zinc oxide:S. These experiments indicated that no adsorption by the container walls was detected. In all experiments, the difference between the initial Hg(II) concentration (C0) and the
equilibrium concentration (Ce) was calculated and used to
determine the adsorptive capacity (qe) (mg g-1) as follows:
(2)
where
V is the total volume of mercury(II) solution (mL),
m is the mass of adsorbent used (g),
C0, is the initial concentration of the mercury(II)
solution (mg L-1) and
Ce, is the residual mercury(II)concentration (mg L-1).
The linear model, which describes the accumulation of solute by sorbent as directly proportional to the solution concentration is presented by the relation:
qe = KDCe (3)
The constant of proportionality or distribution coefficient
KD is often referred to as the partition coefficient.
The Langmuir model represents one of the first theoretical treatments of non-linear sorption, and has been successfully applied to a wide range of systems that exhibit limiting or maximum sorption capacities. The model assumes uniform energies of adsorption onto the surface and no transmigration of the adsorbate in the plane of the surface.
The Langmuir isotherm is given by:
0 e e
e
1
Q bC
q
bC
(4)where Q0and b are Langmuir constants related to adsorption
capacity and energy of adsorption, respectively.25
Eqn. (4) is usually linearized by inversion to obtain the following form:
(5)
Eqn. (5) is equally used to analyze batch equilibrium data by plotting 1/qe versus 1/Ce, which yields a linear plot if the
data conform to the Langmuir isotherm. The essential characteristics of the Langmuir isotherm can also be expressed in terms of a dimensionless constant separation factor or equilibrium parameter (RL), which is defined by
Eqn. (6).26
o L
bC
R
1
1
(6)where C0 is the initial solute concentration and b is the
Langmuir’s adsorption constant (L mg-1).
The RL value confirms the adsorption to be unfavourable
(RL > 1), linear (RL = 1), favorable (0 < RL<1) or irreversible
(RL = 0).27
The Freundlich isotherm is the most widely used non-linear sorption model and is given by Eqn. (7).
0 e
0
100
C
C
R
C
e
(
0
e)
V
q
C
C
m
0 0
e e
1
1
1
1
n e
F eq
K C
(7)where KF relates to sorption capacity and n to sorption
intensity.
The logarithmic form of Eqn. (7) given below is usually used to fit data from batch equilibrium studies.
e F e
1 logq logK logC
n
(8)
RESULTS AND DISCUSSION
Effect of solid/liquid ratio
The experimental data presented in figure 1clearly show that under the present experimental conditions, the removal of mercury increases with increasing adsorbent dose. The removal of mercury increased from 80 % at 0.016 g L-1
adsorbent dose to more than 94.7 % at 0.08 g L-1 adsorbent
dose. The observed mercury uptake increase is attributed to the increased adsorbent surface area available for contact with the Hg(II), which leads to increased number of surface-active groups. 28,29 The mercury uptake remains practically
the same, ~95 %, at adsorbent dose > 0.08 g L.
Figure 1. Effect of adsorbent dosage on the removal of Hg(II) by ZnO : S. Conditions: C0 10 mg L-1, time of contact, 30 min, pH 2.4
and temperature 25 C.
Effect of contact time
Figure 2 shows that the uptake of Hg(II) increases with increasing contact time and that the adsorption process is saturated after approximately 30 min of contact time. The contact times at which the adsorption reaches equilibrium differs as revealed by saturation studies reported by other workers for the uptake of Hg(II)30,31 and is related to the
accessibility and the binding capacity of the sulphur.
Figure 2. Effect of contact time on the removal of Hg(II) by ZnO:S. Conditions: C0 10 mg L-1, dose of ZnO:S 0.05 g, pH 2.4 and
temperature 25 C.
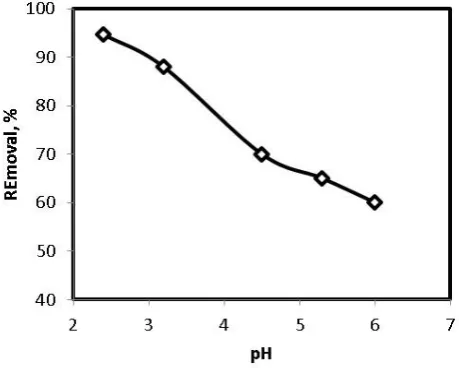
Effect of pH
To confirm the effect of pH on the adsorption of Hg to ZnO:S, a Hg adsorption experiment was performed while adjusting the initial pH of the Hg solution from pH 2 to 6 and maintaining this value for 30 min. A graph of the pH effect is shown in Fig. 3.
The uptake of Hg(II) as a function of hydrogen ion concentration was determined in the pH range of 2-6. At pH values below 2.4, hydrogen ions are likely to compete with mercuric ions and to note that at pH > 6, mercury precipitates.32 The maximum adsorption was observed at pH
2.4, in general the results indicated that the adsorption is highly pH dependent. Similar results have been reported in previous studies.23,33,34
Figure 3. Effect of pH on the removal of Hg(II) by ZnO:S. Conditions: C010 mg L-1, dose of ZnO:S 0.05 g, contact time 30
Adsorption isotherms
Adsorption data usually discussed and explained by adsorption isotherms, such as the linear, Langmuir and Freundlich isotherms. These isotherms relate metal uptake per unit weight of the adsorbent qe to the equilibrium
adsorbate concentration in the bulk fluid phase Ce.
Eqns. (3), (5) and (7) are usually used for the analysis of equilibrium batch experiment data assuming linear, Langmuir and Freundlich isotherms, respectively.
Figures 4, 5 and 6 present the linear, Langmuir and Freundlich isotherm plots of mercury adsorption on the ZnO:S. The equilibrium data were fitted very well to all three sorption isotherms. These plots were used to calculate the isotherm parameters given in Table 1 for mercury. The data obtained represent a favorable adsorption in the case of adsorption of Hg(II) ions (RL = 0.999). The shape of
isotherm is given by the value of RL as given in Table 1. The
ongoing adsorption process is favourable.
Figure 4. Linear isotherm plot for the adsorption of mercury on ZnO:S.
Figure 5. Langmuir isotherm plot for the adsorption of mercury on ZnO:S.
Figure 6. Freundlich isotherm plot for the adsorption of mercury on ZnO:S.
Table 1. Summary of isotherm parameters for the adsorption of mercury on ZnO:S.
Linear KD, L g-1
Frendlich's Langmuir KF n R2 Q0,
,mg g-1
b, L g-1
R2
0.470 0.535 1.045 0.9994 101.01 5.043 0.9992
Removal of Hg(II) from wastewater
In order to survey the capability of the prepared adsorbents for removal of Hg(II) from actual wastewater, some batch experiments were conducted on chloralkali wastewater. Mercury concentration in the chloralkali wastewater is in the range of 2-30 mg L-1. The ZnO:S is a
good adsorbent with high capability for adsorption of mercury ions (94%) from wastewater.
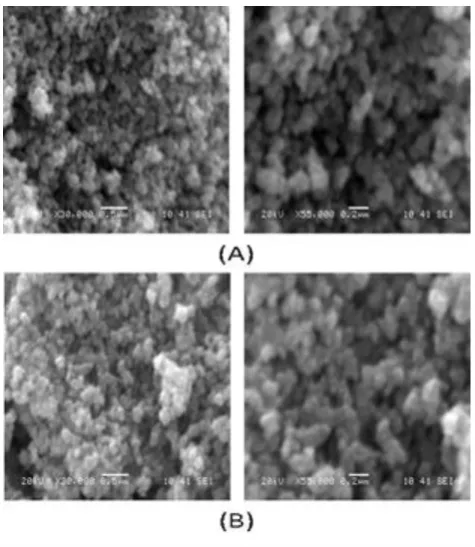
Verification of adsorption
A scanning electron microscopic (SEM) investigation expose changes in the morphology of ZnO:S before and after impregnation in Hg(II) solutions (Fig.7a,b). The uptake of Hg(II) is demonstrated by the change of the morphology of adsorbent’s surface.
Energy dispersive X-ray analysis (EDX analysis) was carried out for ZnO:S before and after impregnation in Hg(II) solutions and results obtained are depicted in Figure 8. Figure 8b shows an EDX analysis which confirms the presence of mercury in the ZnO:S adsorbent.
Figure 8. EDX analysis of ZnO:S (A) before, and (B) after contact with mercury.
Figure 9. IR spectra of ZnO:S (A) before and (B) after contact with mercury.
The FTIR spectrum of ZnO:S after exposure to Hg(II) nitrate shows a new characteristic band at 1380 cm-1 due to
nitrate group beside peaks at 1630 cm-1 is due to the bending
of water molecule. The peak in the range of 400-500 cm-1 is
due to the presence of ZnO bond. The FTIR spectrum of ZnO:S indicates significant changes after exposure to Hg(II) which indicate that binding processes have taken place on the surface of adsorbent (Figure 9).
A comparison of the adsorption capacity (Q0) of ZnO:S
with different adsorbents previously used for Hg(II) removal from wastewater effluents indicates remarkable capacity of the proposed sorbent (Table 2).
Table 2. Adsorption capacities for different adsorbents used for Hg removal from wastewater.
Adsorbent Adsorption
capacity, Q0
(mg g-1)
Ref.
Bone charcoal 28.33 23
Activated carbon
derived from waste coconut buttons 78.89
35
Sago waste carbon 55.60 36
Dates nut carbon 1.16 37
Chemically modified banana stem 132.25 38
Palm shell 83.33 39
Bamboo leaf powder 27.11 40
Peel biomass of Pachiraaquatica Aubl. 0.71 41
exfoliated graphene oxide-L-cystine 79.36 42
Graphene Oxide-Carbon Composite 68.80 43
Carbon Aerogel 45.62 44
Graphene oxide foam 35.00 45
Thiol-functionalized graphene oxide 107.52 46
Poly(glycidyl methacrylate) 56.18 47
ZnO:S
101.01 This work
CONCLUSIONS
Zinc oxide doped with sulphur has been used for removal of Hg(II) from wastewater effluents. The present work showed that ZnO:S follows the adsorption isotherm models tested, Freundlich and Langmuir. However, the Freundlich isotherm is the best-fit isotherm. The Langmuir adsorption capacity is 101.01 mg of Hg(II) per gram of the adsorbent. Removal of 10 mg L-1 of Hg(II) was achieved by 0.08 g of
ZnO:S at pH 2.4.
REFERENCES
1MadhavaRao, M., Kumar R., PadalaVenkateswarlu, D. H. K.,
Seshaiah, K., J. Environ. Manage, 2009, 90, 634. DOI:
10.1016/j.jenvman.2007.12.019.
2Berglund, F., Bertin, M., Chemical Fallout, Thomas Publishers,
Springfield, 1969.
3Krishnamoorthi, C. R., Vishwanthan, P., Toxic metal in the Indian
Environment, Tata McGraw-Hill Publishing Co. Ltd, New Delhi 1991.
5Peters, R. W., Ku, Y., AIChE Symp., 1985, 81, 9.
6Chiarle, S., Ratto, M., Rovatti, M., Water Res., 2000, 34, 2971.
DOI: https://doi.org/10.1016/S0043-1354(00)00044-0.
7Patterson, J. W., Passono, R., Metals Speciation-Separation and
Recovery, Lewis Publisher, New York, 1990.
8Larson, K. A., Ind. Eng. Chem. Res., 1992, 31, 2714. DOI: 10.1021/ie00012a013
9Skubal, L. R., Meshkov, N. K., J. Photoch. Photobiol A: Chem., 2002, 148, 211. DOI: 10.1016/S1010-6030(02)00079-5 10Atwood, D. A., Zaman, M. K., Struct. Bonding, 2006, 120,
163-182.
11Sen, A. K., De, A. K., Water Res., 1987, 21, 885. DOI: https://doi.org/10.1016/S0043-1354(87)80003-9
12Pandey, M. P., Chaudhuri, M., Water Res., 1982, 16 1113. DOI: https://doi.org/10.1016/0043-1354(82)90127-0
13Karthikeyan, J., Chaudhuri, M., 1986, 20, 449. DOI: https://doi.org/10.1016/0043-1354(86)90192-2
14Cullen, G. V., Siviour, N. G., Water Res., 1982, 16, 1357. DOI: https://doi.org/10.1016/0043-1354(82)90214-7
15Deshkar, A. M., Bokade, S. S., Dara, S. S., Water Res., 1990, 24,
1011–1016. DOI: 10.1016/0043-1354(90)90123-N
16Tan, T. C., Chia, C. K., Teo, C. K., Water Res., 1985, 19, 157.
DOI: https://doi.org/10.1016/0043-1354(85)90193-9
17Srivastava, S. K., R. Tyagi, N. Pant, Water Res., 1985, 23, 1161.
DOI: https://doi.org/10.1016/0043-1354(89)90160-7
18Singh, D. K., Tiwari, D. P., Saksena, D. N., Indian J. Environ.
Health, 1993, 35, 169.
19Rowley, A. G., Husband, F. M., Cunningham, A. B., Water Res., 1981, 18, 981. DOI: https://doi.org/10.1016/0043-1354(84)90248-3
20Tiwari, D. P., Singh, D. K., Saksena, D. N., J. Environ. Eng., 1995, 479. DOI: https://doi.org/10.1061
21Cox, M., El-Shafey, E., Pichugin, A. A., Appleton, Q., J. Chem.
Technol. Biotechnol., 2000, 75, 427. DOI:
10.1002/(SICI)1097-4660(199911)74:11<1019::AID-JCTB152>3.0.CO;2-N
22Daifullah, A. A. M., Awwad, N. S., Al-Azhar Bull. Sci., - Proc.
5th Int. Sci. Conf., 2003, 57.
23Hassan, S. S. M., Awwad, N. S., Aboterika, A. J. Hazard. Mater., 2008, 154, 992–997.DOI: 10.1016/j.jhazmat.2007.11.003 24Sarkar, S., Sarkar, S., Biswas, P., J. Environ. Chem. Eng., 2017, 5,
38. DOI: https://doi.org/10.1016/j.jece.2016.11.015
25Langmuir, I., J. Am. Chem. Soc., 1918, 40, 1361. DOI: 10.1021/ja02242a004.
26Zare, F., Ghaedi, M., Daneshfar, Chem. Eng. J., 2015, 273, 296.
DOI: https://doi.org/10.1016/j.cej.2015.03.002
27Alzaydien, A. S., Am. J. Environ. Sci., 2009, 5, 197. DOI: 10.3844/ajessp.2009.197.208
28Akar, T., Kaynak, Z., Ulusoy, S., Yuvaci, D., Ozsari, G., Akar, S.
T., J. Hazard. Mater., 2009, 163, 1134. DOI:
https://doi.org/10.1016/j.cej.2008.07.027
29Shao, W., Chen, L., Lu, L., Luo, F., Desalination, 2011, 265,
177–183. DOI: https://doi.org/10.1016/j.desal.2010.07.049 30Mishra, S. L., Tiwari, D., Prasad, S. K., Dubey, R. S., Mishra, M.,
J. Radioanal. Nucl. Chem., 2007, 24, 257. DOI:
10.1007/s10967-007-1108-y
31Wu, X. W., Ma, H. W., Li, J. H., Zhang, J., Li, Z. H., J. Colloid
Interface Sci., 2007, 315, 555. DOI:
https://doi.org/10.1016/j.jcis.2007.06.074
32Deshicar, A. M., Bokade, S. S., Dara, S. S., Water Res., 1990, 24,
1011. DOI: https://doi.org/10.1016/0043-1354(90)90123-N 33Srivastava, S. K., Tyagi, R., Pant, N., Water Res., 1989, 23, 1161.
DOI: https://doi.org/10.1016/0043-1354(89)90160-7
34Dawlet, A., Talip, D., Yu Mi, H., MaLiKeZhaTi, Procedia Environ. Sci, 2013, 18, 800-808. DOI:
10.1016/j.proenv.2013.04.108
35Anirudhan, T. S., Screkumari, S. S., J. Environ. Sci., 2011,
23(12), 1989. DOI : https://doi.org/10.1016/S1001-0742(10)60515-3
36Kadirvelu, K., Kavipriya, M., Karthika, C., Vennilamani, N.,
Pattabhi, S., Carbon, 2004, 42(4), 745. DOI :
https://doi.org/10.1016/j.carbon.2003.12.089.
37Kannan, N., Malar, S. J. S., Indian J. Chem. Technol., 2005, 12,
522.
38Manohar, D. M., Noeline, B. F., Thayyath, S. A., Sep. Sci.
Technol., 2014, 49, 1259. DOI:
http://dx.doi.org/10.1080/01496395.2013.876046
39Ismaiel, A.A., Aroua, M.K., Yusoff, R., Chem. Eng. J., 2013, 225,
306. DOI : http://dx.doi.org/10.1080/01496395.2013.876046 40Mondal, D. K., Nandi, B. K., Purkait, M. K., J. Environ. Chem.
Eng., 2013, 1, 891. DOI :
https://doi.org/10.1016/j.jece.2013.07.034
41Santana, A.J., dos Santos, W.N.L., Silva, L.O. B., das Virgens,
C.F., Environ. Monit. Assess., 2016, 188. DOI:
10.1007/s10661-016-5266-7
42Kumar, S.K., Jiang, A.S.J., RSC Adv., 2015, 5, 6294. DOI: 10.1039/C4RA12564A
43Esfandiyari, T., Nasirizadeh, N., Dehghani, M.,
Ehrampoosh, M.H., Chin. J. Chem. Eng., Available online 20 March 2017, In Press, Corrected Proof.
44Meena, A.K., Mishra, G. K., Rai, P. K., Rajagopal, C., Nagar, P.
N., J. Hazard. Mat., 2005, 122, 161. DOI:
https://doi.org/10.1016/j.jhazmat.2005.03.024
45Henriques, B., Gonçalves, G., Emami, N., Pereira, E., Vila, M.,
Marques, P.A.A.P., J. Hazard. Mater., 2016, 301, 453. DOI:
https://doi.org/10.1016/j.jhazmat.2015.09.028
46Kumar, A.S. K., Jiang, S. J., Tseng, W. L., J. Environ. Chem.
Eng., 2016, 4, 2052. DOI:
https://doi.org/10.1016/j.jece.2016.03.034
47Kim, H. H., Lee, T. G., J. Ind. Eng. Chem., 2017, 47, 446. DOI: https://doi.org/10.1016/j.jiec.2016.12.019