ISSN-L: 2501 - 1235 Available on-line at: www.oapub.org/edu
doi: 10.5281/zenodo.3668375 Volume 6 │ Issue 5 │ 2020
THE EFFECT OF 8 WEEKS FOLK DANCES TRAINING
ON BALANCE REACTION TIME AND RHYTHM
SESSION OF UNIVERSITY STUDENTS
Veysi Sevi, Mürsel Biçer, Mehmet Vural Gaziantep University, Faculty of Sport Sciences, Gaziantep, Turkey
Abstract:
The aim of this study was to investigate the effects of 8-week folk dance education on balance, reaction time and rhythm session of university students. A total of 40 students aged 19-23 years were included in the study. Participants were divided into two groups. 20 students of them were determined as control group. The other groups performed basic folk dance training was given to the students as ninety minutes three days a week. Age, height, weight, balance, visual and auditory reaction time and rhythm session were measured in groups one day before and one day after the study. Isokinetic balance test was performed for balance measurement. The normal distribution test of the data obtained from the study was carried out with Kolmogorov-Smirnov and Shapiro Wilk tests. The data showed normal distribution according to the groups (p> 0.05). Paired t test was used to compare the pre-test and post-test values of auditory reaction time, visual reaction time, api, body weight, osi and mlı. McNemar test was used to analyze the pre -test and post--test of correlation between rhythm perception and performing skill scale. Statistical results were evaluated at 95% confidence interval and p <0.05 significance level. It could be concluded that eight weeks folk dance education can improve the balance, reaction time and rhythm session and have positive effects of university students.
Keywords: rhythm, balance, reaction time, folk dance
1. Introduction
sacred and worshiping dance over time (İnal, 2008). Folk dances are conveyed as a spectacular dance by staging them on a unique basis and at the same time, reaching from generation to generation as a cultural heritage. During the time, it has been included in the performing arts that professional studies have been done in our country and in the world, leaving its natural stage (Bozkuş, 2003).
Anatolia, which is a place where many different cultures lived and where the state was established and reigned in many different structures throughout the history, served as a strong connection within the cultures of the east and the west. Therefore, folk dances, which are an important element of folk culture, are said to be enriched by the contributions of the cultures in which they have many types. The reason why the structure of Anatolian folklore is diverse is that it occurs as a mutual synthesis of the eastern and western cultures. This interaction has always paved the way for the addition of a new content and the emergence of mixed dances (Koçkar, 1998).
With this purpose, it is curious how folk dances affect and develop young people today. It is aimed to investigate the effect of folk dance training applied to university students for eight weeks on students' balance status, change of reaction times and rhythm feelings.
2. Material and Method
2.1. Experimental Design
Power analysis was performed to determine the number of groups to participate in the study (G Power 3.1). After power analysis, 40 subjects were planned to be recruited. 40 subjects who participated in the study were divided into two groups (20 = control group, 20 = training group). Folk dance training was done at the university's gym. The basic folk dance exercises, which included dynamic movements to improve the sense of rhythm, applied to the training group participating in the study, three days a week, ninety minutes. The control group was not subjected to any application. All participants were informed about the work plan and its purpose. Necessary permissions were obtained from Gaziantep University Clinical Research Ethics Committee for this study. As the physical and physiological parameters of the participants; age, height, body weight, balance, reaction time and rhythm perception and application skill scale were applied.
2.2. Body Height Measurement
Participants' height measurements were made using a wall chart with a sensitivity of 0.1cm. While measuring the length of the subjects, the shoes were removed, and the measurement was carried out with socks whose feet were bare or whose thickness could be ignored. The obtained value was recorded with a sensitivity of 0.1 cm (Erhan, 2018).
2.3. Body Weight Measurement
subjects stood staring upright on the scale and the reading was recorded in kg (Erhan, 2018).
2.4. Balance Measurement
Biodex Balance SD isokinetic balance device, whose validity has been demonstrated previously, was used for balance measurement. It consisted of one test for each athlete and three measurements per test. Between the tests, a 10-second rest period was set. During the dynamic test, the fixed point on the screen from the athlete; He was asked to stop by trying to balance forward, backward, right and left. Each measurement results were scored with the Biodex balance system (Zorba et al., 2000).
2.5. Reaction Time Measurement
Visual (vrt) and auditory reaction times (art) of athletes were measured using special software programs (www.humanbenchmark.com, www.cognitivefun.net) after providing appropriate environment and environmental conditions in which stimuli from the environment were minimized. At the first stage, the participants were accustomed to the test, and 10 consecutive measurements were taken after they felt ready. The arithmetic averages of the last five of these measurements were taken and evaluated (Pancar et al., 2016; Eren et al., 2017; Özaslan et al., 2017).
2.6. Rhythm Perception and Performed Skills
This test, the researcher and the subject are asked to sit on the table side and follow the instructions by giving the pen a pencil. The researcher gives practical information about how to perform the test by making strokes on the table with the back of the pen in her or his hand. After giving information about how to do the test, the rhythms in the test form are asked by the researcher practically and asked to repeat the sounds she/he heard from the subject by hitting the table. Rhythmic pattern is applied once by the researcher. If the subject answers correctly, the other question is passed. According to the rhythm perception and application test results, the rhythm sense evaluation table is as follows (Elias et al., 2003).
Table 1: The rhythm sense evaluation
0-7 8-15 16-22 23-30
Weak Medium Good Very Good
2.7. Statistically Analysis
3. Results
The average values of the individuals participating in the study, the average values and the statistical analysis of the scores they received from the auditory and visual reaction test, the scores, averages and statistical analysis from the balance test and rhythm detection test are specified in this section.
Table 2: Comparison of pre-test-post-test of weight (kg) values of groups
When Table 2 is examined, it has been determined that the mean values of pretest-posttest weight (kg) values do not show statistical difference (p> 0.05). In addition, it was determined that the weight (kg) values did not differ statistically (p> 0.05). In addition, group*time interaction was statistically significant (F = 43.999; p = 0.001). Accordingly, it was determined that the weight (kg) values of the training group decreased while the weight (kg) values of the control group increased.
Table 3: Comparison of art (ms) values of groups in pre-test and post-test
When Table 3 is examined, it has been determined that the mean values of pretest-posttest auditory reaction time (art) values do not differ statistically (p> 0.05). In addition, it was determined that art values were statistically significant compared to the groups (p <0.05). In addition, group*time interaction was statistically significant (F = 9.674; p = 0.004). Accordingly, it was determined that the training group's values decreased while the control group's values increased.
Table 4: Comparing the vrt (ms) values of the groups, pretest-posttest
Variables N Pre-test Post-test F p
SD SD Training 20 66.308.67 64.508.19
3.440 0.071 Control 20 70.8511.45 71.9011.98
Total 40 68.5810.29 68.2010.80 F=3.047; p=0.089
Variables N Pre-test Post-test F p
SD SD Training 20 185.5238.83 170.7727.66
3.198 0.082 Control 20 196.7636.62 198.5637.03
Total 40 191.2937.67 184.6635.20 F=5.974; p=0.019
Variables N Pre-test Post-test F p
SD SD Training 20 306.8530.70 284.6021.96
0.762 0.388 Control 20 300.4521.01 303.7021.50
When Table 4 is examined, it was found that the mean values of pretest-posttest visual reaction time (vrt) values did not show statistical difference (p> 0.05). In addition, vrt values were found statistically significant according to the groups (p <0.05). In addition, group*time interaction was statistically significant (F = 30.674; p = 0.000). Accordingly, it was determined that the vrt values of the training group decreased while the vrt values of the control group decreased.
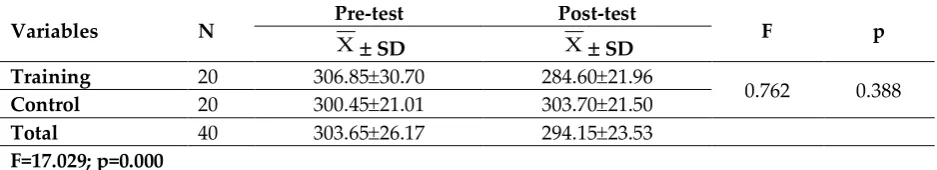
Table 5: Comparison of the osi (overall stability index) values of the groups, pretest-posttest
When Table 5 was examined, it was found that the mean of the pretest-posttest osi (overall stability index) values did not differ statistically (p> 0.05). In addition, it was determined that the osi values did not differ statistically (p> 0.05). In addition, group*time interaction was not statistically significant (F = 5.218; p = 0.28). Accordingly, it was determined that the osi values of the training group decreased while the osi values of the control group increased.
Table 6: Comparison of the api (anterior posterior index) values of the groups
When Table 6 was examined, it was found that the mean values of the pretest-posttest api (anterior posterior index) values did not differ statistically (p> 0.05). In addition, it was determined that api values did not differ statistically according to the groups (p> 0.05). In addition, group*time interaction was statistically significant (F = 9.352; p = 0.004). Accordingly, while the api values of the training group decreased, the api values of the control group increased.
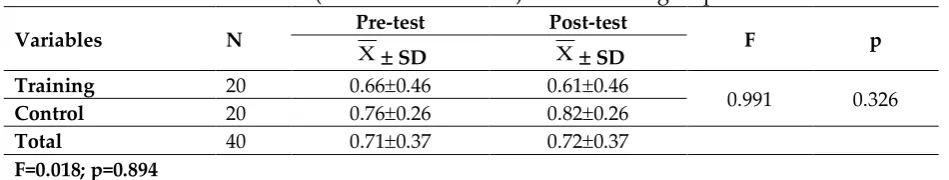
Table 7: Comparison of the pretest-posttest of the mli (medial lateral index) values of the groups
Variables N Pre-test Post-test F p
SD SD Training 20 1.390.67 1.240.53
2.447 0.126 Control 20 1.530.53 1.640.59
Total 40 1.460.60 1.440.59 F=0.118; p=0.733
Variables N Pre-test Post-test F p
SD SD Training 20 1.170.52 0.980.53
1.807 0.187 Control 20 1.230.45 1.310.48
Total 40 1.200.48 1.150.53 F=1.536; p=0.223
Variables N Pre-test Post-test F p
SD SD Training 20 0.660.46 0.610.46
0.991 0.326 Control 20 0.760.26 0.820.26
When Table 7 is examined, it was found that the mean values of pretest-posttest mli (medial lateral index) values did not show statistical difference (p> 0.05). In addition, it was determined that mli values did not differ statistically according to the groups (p> 0.05). In addition, group*time interaction was not statistically significant (F = 0.991; p = 0.326). Accordingly, while the mli values of the training group decreased, the mli values of the control group increased.
Table 8: Comparison of the pre-test and post-test values of the rhythm perceptions of the Training and Control group
Groups
Post-test
Total p Weak Medium
Training Groups Pre-test
Weak 7 9 16
0.004**
Medium 0 4 4
Total 7 13 20
Control Groups Post-test
Weak 14 2 16
1.000
Medium 1 3 4
Total 15 5 20
While 16 people were weak in the pre-test rhythm group in the training group, 9 of the 16 people changed from the post-test weak rhythm group to the middle rhythm group. This change is statistically significant (p <0.05).
4. Discussion and Conclusion
This research was conducted to examine the effects of 8-week folk dance training on the balance, reaction time and rhythm sense of university students. For this purpose, a total of 40 university students, 20 of whom were between the ages of 19-23 year, were training groups and 20 were control groups. The students included in the study were given basic folk dance training for 8 weeks and 3 days a week. The height, weight, balance, visual and auditory reaction time and rhythm sense measurements of the participants were made one day before and one day after the studies. At the end of the 8-week period, final measurements were made for the isokinetic balance, visual and auditory reaction test and rhythm perception skill to determine whether there was an effect of the folk dance program.
posttest. In addition, statistically significant results were obtained at the level of group * time interaction (p <0.05). When looking at the average of the weight values of the groups, it was found that the statistical difference was not significant in favor of the post-test. In addition, statistically significant results were obtained at the level of group*time interaction (p <0.05). In the rhythm perception test, while 16 of the 20 people in the rhythm pretest of the training group were in the weak group, 9 of the 16 weak people were included in the middle level group (p <0.05) and significant results were obtained. When the literature is analyzed, studies examining the effects of dance and physical activity activities are found. Zorba et al. Practiced step-by-step studies with music for 15 women between the ages of 33-40 year, for 8 weeks, 3 days a week and 45 minutes a day, and they found improvements in the simple visual and auditory reaction times after 8 weeks (Zorba et al., 2000). In our study, although the effects of folk dance training between the pre-test and post-test weight values of the participants were not significant among the groups, significant results were obtained in favor of the positive post-test in the training group (p <0.05). In the literature, it has been suggested that there are negative connections between obesity and some neural performance processes and mental performance level and accordingly a number of neural diseases (Gustafson et al., 2004; Gunstad et al., 2007; Gardner et al., 1985).
In the present study, the participants were given folk dance training as a physical activity lasting 8 weeks. The study was carried out 3 days a week. At the end of this process, since both individuals exerted enough effort, a decrease in their weight was challenged, and positive results emerged in favor of the training group in the posttest at the reaction times. In a study, it was revealed that individuals with better physical and better performance capacities have better reaction times. It has been determined by other studies that athletes show a better reaction time than others (Ünveren, 2005).
In conclusion it could be concluded that 8-week folk dance training provides important changes in individuals' reaction time, balance and rhythm perceptions. In addition, during this study, which was physically exerted, positive changes were observed in the physical characteristics of individuals, especially in weight values.
References
Bozkuş T. Kars Yöresi Halk Oyunları ve Giysileri Üzerine Bir Araştırma (2003). Kırıkkale Üniversitesi Sağlık Bilimleri Enstitüsü Yüksek Lisans Tezi, Kırıkkale.
Elias M., Elias P., Sullivan L., Wolf P. ve D’Agostino R. (2003). Lower cognitive function in the presence of obesity and hypertension: the Framingham ear study, International Journal of Obesity; 27, 260- 268
Erhan S. M., Gerek Z., Bedir D. (2018). The Role of hand, eye, and ear lateralization in the sense of rhythm of the athletes, Journal of Education and Training Studies; 6(4), 63-71.
Gardner R. M., Maes J. L., Sandoval Y. ve Dalsing S. (1985). Effects of distraction and task complexity on reaction time in obese persons, Perceptual& Motor Skills, 1985; 61(3 Pt 1), 855-61.
Gunstad J., Paul R. H., Cohen R. A., Tate D. F., Spitznagel M. B. ve Gordon E. (2007). Elevated body mass index is associated with executive dysfunction in otherwise healthy adults, Comprehensive Psychiatry; 48, 57– 61.
Gustafson D., Lissner L., Bengtsson C., Bjorkelund C. ve Skoog I. (2004). A 24- year follow-up of body mass index and cerebral atrophy, Neurologyi;63:1876- 1881. İnal K. Eğitim ve ideoloji (2008). İstanbul: Kalkedon Yayınları, 77.
Koçkar M. T. (1998). Çağlar boyunca beden dilinde sanat ve kültür iletişimi dans ve halk dansları.Ankara: Bağırgan Yayınevi; 46-72.
Özaslan, B. R., Biçer, M., Özdal, M., Vural, M., & Şan, G. (2017). Investigation of visual and auditory simple reaction time of individuals with mental retardation. European Journal of Special Education Research.
Pancar Z., Özdal M., Pancar S., Biçer M. (2016). Investigation of visual and auditory simple reaction time of 11-18 aged youth. European Journal of Physical Education and Sport Science, 2016;2(4):145-52.
Ünveren A. (2005). Türk halk oyunlarının fiziksel aktivite düzeylerinin belirlenmesi. Gazi Üniversitesi Sağlık Bilimleri Enstitüsü, Beden Eğitimi ve Spor Anabilim Dalı Doktora Tezi, Ankara.
Creative Commons licensing terms