Volume 18 (2009)
Proceedings of the
Eighth International Workshop on
Graph Transformation and Visual Modeling Techniques
(GT-VMT 2009)
Contraction of Unconnected Diagrams using Least Cost Parsing
Steffen Mazanek, Mark Minas
13 pages
Guest Editors: Artur Boronat, Reiko Heckel
Managing Editors: Tiziana Margaria, Julia Padberg, Gabriele Taentzer
Contraction of Unconnected Diagrams using Least Cost Parsing
Steffen Mazanek1, Mark Minas2
Institut f¨ur Softwaretechnologie
Universit¨at der Bundeswehr M¨unchen, Germany
Abstract: A free-hand diagram editor allows the user to place diagram components on the pane without any restrictions. This increase in flexibility often comes at the cost of editing performance, though. In particular it is tedious to manually establish the spatial relations between diagram components that are required by the visual language. Even worse are certain graph-like languages where it is a quite annoying task to explicitly link the node components.
In this paperdiagram contractionis proposed for solving these issues. The editor user can just roughly arrange a set of diagram components. On request the editor au-tomatically creates a correct diagram from these components while preserving their layout as far as possible. Moreover, for several languages diagram contraction cor-responds to linking node components appropriately. Suchauto-linkingis considered useful. It even has been integrated into first commercial modeling tools.
The proposed approach can be applied to visual languages that are specified by means of hypergraph grammars. For syntax analysis an error-tolerant hypergraph parser is used, which computes a cost function by attribute evaluation. That way, unfavorable derivation (sub-)trees can be excluded at an early stage, and combina-torial explosion is mostly prevented.
Keywords:diagram contraction, auto-link, least cost parsing, hypergraph grammars
1
Introduction
This paper is motivated by the observation that many free-hand editors suffer from a poor editing performance. Since diagram components are to be placed on the pane without any restrictions or guidance, the editor user often needs to perform tedious precision work in order to establish the spatial relations required by the particular language.
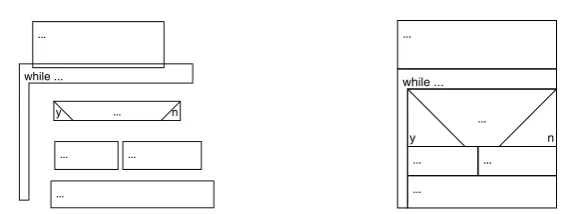
Consider the language of Nassi-Shneiderman diagrams (NSDs) [NS73] as a first example. It is quite difficult to move and size the statements of an NSD such that their corners touch properly (at least without snap to grid). Experiments rather confirm the claim that users are much faster in just roughly arranging their diagram components as shown in Fig.1a. So, couldn’t the annoying precision work be done by the editor instead of the user?
while ...
...
y n
... ...
... ...
while ...
...
y n
... ...
... ...
Figure 1: a) Roughly arranged NSD and b) the NSD actually intended
diagram incomplete?
n y
need assistance?
go ahead syntax assist start
end
keep editing
n y
diagram incomplete?
n y
need assistance?
go ahead syntax assist start
end
keep editing
n y
Figure 2: a) Unconnected flowchart and b) the flowchart actually intended
the node components are drawn, i.e. start and end symbols, statements, and conditions. From their arrangement it is already quite clear which flowchart the user intends to create. However, still 8 arrows (two mouse clicks each) have to be drawn in order to actually create it. If the missing arrows were derived automatically, the overall editing time would significantly decrease. Such an “auto-link” feature has already been realized for business process models [Obj09] and incorporated into the WebSphere Business Modeler [WGK+08,GKW08]. It is described as “some magic where you simply place the activities of your business process in some approximate arrangement and your modeling tool connects them for you”. However, this solution seems to be based on a manual programming effort and cannot be reused for other languages easily. In contrast, this paper describes a generic mechanism that supports auto-link as a special case.
In the following the process of finding the correct diagram closest to a rough arrangement of diagram components is calleddiagram contraction. This paper shows that diagram contraction is both useful and feasible for a particular class of languages. The proposed approach exploits both syntactic and layout information to this end. It is based on an error-tolerant hypergraph parser that estimates repair costs for possible derivations. Therewith, unfavorable (sub-)derivations can be excluded at an early stage. At the same time, a flexible control of the parsing process is possible via the cost function. The language of NSDs is used as a running example.
2
Previous Work
The proposed approach is based on hypergraphs as a model for diagrams [Min02], which have proven to be well-suited for that purpose. The syntax of the particular visual language then can be defined by a hyperedge replacement grammar (HRG) [DHK97]. Fig.3shows the HRG of NSDs. Nonterminal symbols are shaded. The first two rules (i.e., the upper row) basically state that an NSD is a non-empty chain of successive statements. A statement in turn either is a primitive statement, a condition, or a while-loop. The body of a loop and the branches below a condition have to be NSDs again, i.e. the language is recursively defined.
n1
NSD
n1 n2
::=
n3 n4
Stmt
n1 n2
n3 n4
Stmt
n1 n2
NSD
n3 n4
Stmt
n1 n2
::=
n3 n4
stmt
n1 n2
n3 n4 NSD
cond
NSD NSD
n2
n3 n4
n1 n2
n4 n3
while
Figure 3: Hypergraph grammar of NSDs
In [MMM08a] an algorithm forhypergraph completionwith respect to HRGs has been
pro-posed. Given a hypergraphHand an HRGG, this algorithm embeds additional hyperedges into
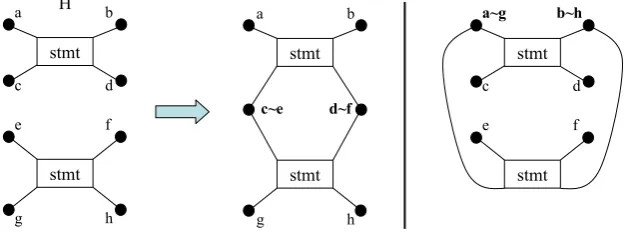
Hin a way, such that the resulting hypergraphH0is a member of the language defined byG. This algorithm has been extended, so that it (optionally) can also glue existing nodes where required. Technically, it constructs quotient hypergraphs whose nodes actually are equivalence classes of the original nodes ofH. This is shown in Fig.4. The two isolated statements of the given hy-pergraphH can be combined in two different ways. An equivalence relation on the nodes ofH
together with a set of additional hyperedges is called apatchofH. The parser, hence, computes hypergraph patches that, when applied toH, yield correct hypergraphs.
stmt
stmt
a b
c d
e f
g h
H a~g b~h
c d
e f
stmt
stmt
stmt
stmt
a b
c~e d~f
g h
3
DiaGen/DiaMeta-Einführung, 5.2.2007, Mark Minas
Diagram
Diagram Modeler SRGSRG ASGASG
Derivation structure
Derivation structure
Drawing tool
Editor user
selects operation
Layout information
Layout information
Layouter Attribute
evaluation
asks for assistance chooses
Hypergraph patches
Hypergraph patches Update
translator
conventional DiaGen editing process
assistance
Parser Reducer
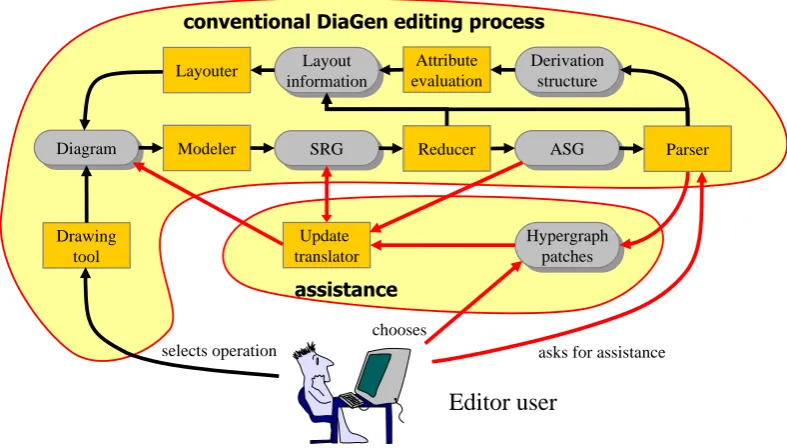
Figure 5: Extended DIAGENediting process
Hypergraph patches can be naturally used in diagram editors [MMM08b]. That way, the DIAGEN toolkit has been extended by diagram correction and completion. The conventional DIAGEN editing process (as marked in Fig.5) consists of several steps [Min02]: The modeler first creates a so-called Spatial Relationship (Hyper-)Graph (SRG) corresponding to the diagram. Thereafter, the reducer simplifies the SRG (similar to lexical analysis in the string setting). This results in the Abstract Syntax (Hyper-)Graph (ASG), an abstract representation of the diagram. The parser analyzes the ASG and constructs the derivation structure (if existent). Finally, the layouter uses this derivation information in order to compute a layout for the diagram.
In [MMM08b] this process has been extended as follows (cf. also Fig.5): If a user explicitly
asks for assistance, the parser is triggered again. It computes hypergraph patches of some user-defined size (determining the number of additional components). From those, the user has to choose. The selected patch is applied and embedded into the SRG using a language-specific up-date translator. The editor then calls the reducer and parser again, so that the layouter can arrange the new components within the actual diagram and adapt existing components if necessary.
In [MMM08c] a method has been suggested that supports diagram contraction as a special
a:NSD
n1 n2
::= b:Stmt
n1 n2 b:Stmt
n1 n2
P1 P2
a:NSD ::=
n3 n4
b:Stmt
n3 n4 c:NSD
n3 n4
a.cost:=b.cost a.x1:=b.x1 a.y1:=b.y1 a.x2:=b.x2 a y2:=b y2
a.cost:=b.cost+c.cost+d((b.x1,b.y2),(c.x1,c.y1))+ d((b.x2,b.y2),(c.x2,c.y1))
a.x1:=min(b.x1,c.x1) a.y1:=b.y1
a x2:=max(b x2 c x2)
n1
n1 n2 n1 n2
n2 a.y2:=b.y2 a.x2:=max(b.x2,c.x2)
a.y2:=c.y2
b:while b:cond
n1 n2
P3 P4 P5
a:Stmt ::=
n3 n4
b:stmt
n3 n4 c:NSD
b:while b:cond c:NSD d:NSD n3 n4 a.cost:=c.cost+d.cost+ d((b.x1,b.y2),(c.x1,c.y1))+ d((b.x2,b.y2),(d.x2,d.y1))+ d(( 2 2) (d 1 d 2)) a.cost:=c.cost+
d((b.xm,b.ym),(c.x1,c.y1))+ d((b.x2,b.ym),(c.x2,c.y1))+ d((b b 2) ( 1 2)) a.cost:=0
a.x1:=b.x1 a.y1:=b.y1 2 b 2
n4 n3 d((c.x2,c.y2),(d.x1,d.y2)) a.x1:=min(b.x1,c.x1) a.y1:=b.y1 a.x2:=max(b.x2,d.x2) a.y2:=max(c.y2,d.y2) d((b.xm,b.y2),(c.x1,c.y2)) a.x1:=b.x1 a.y1:=b.y1 a.x2:=max(b.x2,c.x2) a.y2:=max(b.y2,c.y2) a.x2:=b.x2 a.y2:=b.y2
y ( y y )
y ( y y )
Figure 6: Cost grammar of NSDs
3
Realization of Diagram Contraction
This combinatorial explosion can be avoided if undesirable corrections are excluded as early as possible in the parsing process. For instance, the user is unlikely to be interested in corrections where the vertical order of his NSD statements is not preserved. So, positional information of the diagram components has to be considered while parsing the abstract representation. That way, derivations that preserve the order of statements cross out derivations that don’t.
The approach proposed next exploits attribute evaluation – normally used to construct a se-mantic representation [Knu68] – in order to compute a costfor each possible derivation. This cost is an estimation of the changes that have to be performed by the layouter when this correc-tion should be applied. For this purpose a cost attribute is assigned to each nonterminal hyper-edge. Its value gets computed bottom-up by evaluation rules that are assigned to the grammar’s productions (just synthesized attributes are required).
inner bend of awhile component. Note that edges in the assignment part are addressed using identifiers such asbinb:Stmt.
The goal of a cost model is to punish undesirable contractions with high costs. In Fig.6 dis-tances between points (that ideally should coincide) are used (d(p1,p2)denotes the Euclidean distance betweenp1andp2). Therefore, no costs are associated with the terminal production P3. However, there is some freedom in choosing a cost function. In general, it is not possible to define a cost function that precisely reflects the changes to existing diagram components that would have to be performed by the layouter afterwards. Indeed, this would lead to the combina-torial problem of [MMM08c] again. A reasonable estimation already yields acceptable results in practical time instead.1
Let us recall the details of error-tolerant parsing as described in [MMM08a]. First, as in the string setting, the HRG has to be transformed to Chomsky normal form. Thereby, chain productions with a single nonterminal edge on the right-hand side are eliminated. For NSDs an additional terminal productionNSD::=stmtis introduced to this end. Then possible derivation trees are constructed bottom-up by reverse application of productions, i.e. reductions. Thereby, nodes can be glued where required, i.e. an equivalence relation on nodes is computed succes-sively. Derivations are computed layer by layer where derivations of layeriresult in hypergraphs ofiterminal hyperedges. The layers are constructed as follows:
• Layer 1 is created by reverse-application of terminal productions, i.e., productions with a single terminal hyperedge as right-hand side.
• Layeri(i>1)is created by selecting every pair of layersj(j<i)andi−j, and combining “compatible” derivations thereof by reverse-application of nonterminal productions, i.e., productions with just two nonterminal edges as right-hand side.
3.1 Extension of the Parser
This parser has been extended by attribute evaluation in a straightforward way in order to support the computation of the cost attribute. Moreover, and this is the major improvement, a clean-up phase has been incorporated that follows each time after a layer has been computed.
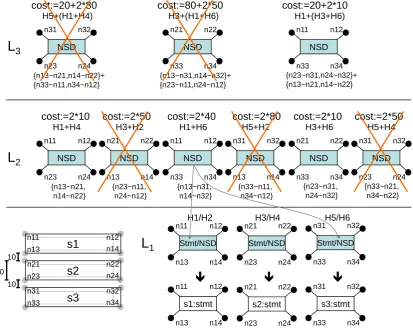
Fig.7shows an example run of this extended parser. In the lower left corner an unconnected NSD is given. It consists of just three statements (whose intended order can easily be recognized by a human observer). Sizes and distances relevant for the computation of the cost function are marked. In the lower right corner the first derivation layerL1is shown. The terminal productions
Stmt::=stmt (P3) and NSD::=stmt are applied three times each (for conciseness their “derivation nodes”2are combined indicated by the labelStmt/NSD). No costs are caused yet.
In layerL2there are six ways of combining aStmtand anNSDat a time using the nonterminal
production P2. Thereby, nodes have to be glued appropriately as indicated by∼. The labels on top of the derivation nodes indicate which derivation nodes from layerL1 have been combined.
The costs following from the cost function and the actual distances in the input diagram are also
1 Here, costs areadded upthroughout the derivation. It would also be possible to define a kind of goodness, where
the value 1.0 means perfect, andmultiplygoodnesses of sub-diagrams.
2 The term “derivation node” refers to a node of the derivation tree in the following whereas the term “node” refers
n31 n32 n21 n22 n11 n12
H5+(H1+H4) H3+(H1+H6) H1+(H3+H6)
cost:=20+2*80 cost:=80+2*50 cost:=20+2*10
NSD n23 n24 NSD n33 n34 NSD n33 n34
{n13~n21,n14~n22}+ {n13~n31,n14~n32}+ {n23~n31,n24~n32}+
L
3cost:=2*10 cost:=2*50 cost:=2*40 cost:=2*80 cost:=2*10 cost:=2*50
{ , } {n33~n11,n34~n12} { , } {n23~n11,n24~n12} { } {n13~n21,n14~n22} NSD n11 n12 NSD n21 n22 NSD n11 n12 NSD n31 n32 NSD n21 n22 NSD n31 n32
H1+H4 H3+H2 H1+H6 H5+H2 H3+H6 H5+H4
L
2n23 n24 n13 n14 n33 n34 n13 n14 n33 n34 n23 n24
{n13~n21, n14~n22} {n23~n11, n24~n12} {n13~n31, n14~n32} {n33~n11, n34~n12} {n23~n31, n24~n32} {n33~n21, n34~n22} 2 Stmt/NSD n11 n12 Stmt/NSD n21 n22 Stmt/NSD n31 n32
H1/H2 H3/H4 H5/H6
L
1s1
n11 n12
n13 n14
10
10 n11 n12 n21 n22 n31 n32
n13 Î n14 n23 Î n24 n33 Î n34
20 s2 3 n13 n14 n23 n24 n21 n22 n31 n32 s1:stmt n13 n14 s2:stmt n23 n24 s3:stmt n33 n34 s3 n33 n34
Figure 7: Example parser run
shown. After layerL2 has been computed, those derivation nodes are filtered out that cover a
subset of edges of another derivation node and have the same root label, but cause higher costs.3 That way,H3+H2,H5+H2andH5+H4can be directly removed fromL2, but notH1+H6, because
the cheaper derivations cover different edge sets.
In the top layer L3 then there are only three valid combinations possible. The best one is
H1+(H3+H6). This derivation is even better than justH1+H6. Consequently, for higher layers, H1+H6and all derivation nodes that haveH1+H6as a sub-tree would also be removed after the computation of layerL3is completed. In this simple exampleL3is the top layer though.
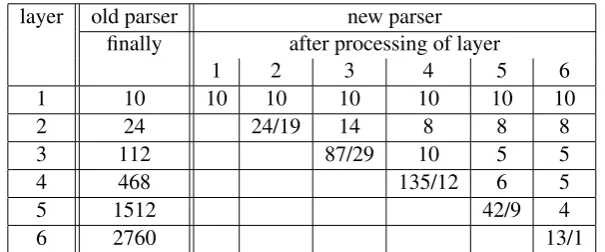
So, in the clean-up phase undesirable derivation nodes are removed across lower (and equal) layers, i.e., after layer iis processed, layers 1 to iare cleaned up. The savings thanks to this improvement are significant. Tab.1opposes the old and the extended parser regarding the filling level of layers when parsing the NSD shown in Fig.1a. It can clearly be seen that after pro-cessing a higher layer elements from lower layers are removed. The notation x/y is used for the currently processed layer to also provide the number x of elements in this layer before clean-up
3 However, in rare cases derivation nodes could be removed that would contribute to a global optimum. In the
layer old parser new parser
finally after processing of layer
1 2 3 4 5 6
1 10 10 10 10 10 10 10
2 24 24/19 14 8 8 8
3 112 87/29 10 5 5
4 468 135/12 6 5
5 1512 42/9 4
6 2760 13/1
Table 1: Savings due to clean-up, number of elements in layers when parsing the NSD of Fig.1a
(accordingly, y is the number of elements after clean-up). Removing derivation nodes in lower layers in turn further increases the performance for filling higher layers. In the example this boils down to just a single derivation in layer 6.
3.2 Discussion
The proposed approach significantly reduces the effort for contracting diagrams compared to
[MMM08c]. However, for the contraction of large diagrams the performance is still not
suf-ficient. The reason is that lots of undesirable derivations are kept quite long, because a better derivation at a higher layer is found too late. There are two effective ways to deal with this issue:
• Introduce a special cost∞ that directly triggers the removal of the respective derivation
node. For instance, in case of NSDs it could be stated that way, that the order of primitive statements must not be changed or that a condition always has to be above its branches. As a positive effect of this approach unexpected contractions like the one shown below are directly excluded. However, it has to be accepted that the number of cases increases where contraction does not yield a solution although it exists.
x even x:=x/2 x:=3x+1
y n
x even x:=x/2 x:=3x+1
y n Contraction?
• Introduce a cost boundper component. This cost bound is multiplied with the number of components processed by a derivation and has to be adhered to in order to actually perform a reduction. This is very effective. However, it might be a balancing act to set a reasonable cost bound that improves performance but does not lose valuable solutions.
Finally, it is important to stress out that the diagram does not have to be completely uncon-nected. Actually, if a production can be reverse-applied without requiring any nodes to be glued, no cost is added. So the proposed approach fully respects already correct sub-diagrams. Nothing gets scrambled. Rather, fragments can be integrated into the main diagram successively.
4
Auto-Link
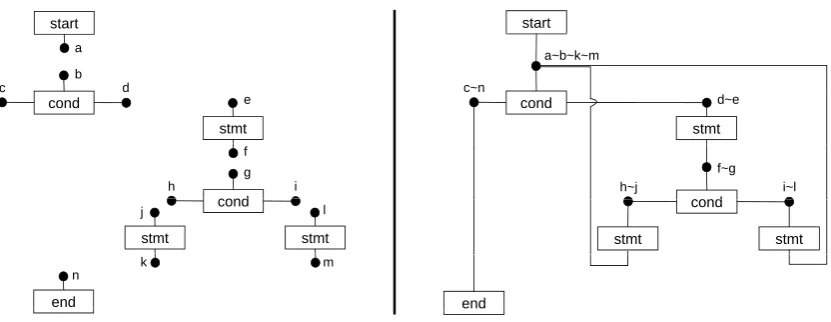
As already mentioned, the proposed approach has quite a wide scope. To understand this, one has to consider how (certain, context-free) graph-like diagrams can be modeled with hypergraphs. In this context, connecting lines and arrows often can be reduced (in DIAGEN by the reducer component, cf. Fig.5) and, thus, are not part of the abstract syntax anymore.
As an example consider the correct flowchart shown in Fig.2b. Its ASG is shown in Fig.8b.4 The reduction of the arrows has caused certain nodes to be glued. That way the control flow is just represented implicitly by component hyperedges visiting the same node. The same diagram without the connecting arrows had been given in Fig. 2a. Again, the corresponding ASG is shown in Fig.8a. A least cost correcting patch for this ASG would glue the nodes such that its application just results in Fig.8b.
start
a
b
c d
cond
stmt
c d
e
cond
f g
h i
cond
stmt stmt
j l
end
k m
n
start
a~b~k~m
c~n
cond
stmt
c n
d~e
cond
f~g
h~j i~l
cond
stmt stmt
end
Figure 8: a) Hypergraph model of Fig.2a and b) hypergraph model of Fig.2b
Following the extended editing process as shown in Fig. 5, the update translator then intro-duces new arrows between the respective components where nodes have to be glued. So, diagram contraction here absolutely coincides with the described auto-link feature. To improve the read-ability of the resulting diagram an edge router can be added to the layouter, so that appropriate bend points for the connectors are inserted automatically.
A cost grammar for flowcharts also can be created in a quite straightforward way. In the developed flowchart editor, costs estimate the length of the arrows to be introduced by the update translator. In the context of flowcharts there is one further issue though, which does not occur so often in the context of NSDs: It can easily happen that several derivations are cheapest at
4 For further information regarding this example consult [Min02], where flowcharts are used as a running example
the same time. The editor chooses from those in a non-deterministic way. The user might be surprised though. For instance, the editor might not create a loop in Fig. 2a but rather just a simple branching. General preferences of course can be reflected by the cost function.
Auto-link significantly improves the editing performance. Whereas in case of NSDs just the precision work is saved, this time several new diagram components, i.e. the missing arrows, are inserted automatically. Usually two (quite precise) mouse clicks are necessary for drawing a single arrow manually (bend points not even included). It is worthwhile to save those – at least where possible.
Unfortunately, the proposed approach cannot be applied to non-context-free languages like class diagrams: First of all, such languages do not exhibit a recursive structure as required. Furthermore, edges like associations are first-class citizens of the abstract syntax. And finally, it is hard to derive meaningful connections just from thelayoutof a set of classes.
However, several useful DIAGEN editors with auto-link have been realized already: logic gates, trees, structured flowcharts and structured business process models (even supporting em-bedded messages). The latter particularly shows that the proposed approach is also applicable to (at least some) real-world languages.
5
User Study
In this section the results of a first (limited) user study are provided. It has been conducted in order to verify the assumption that it is much faster to draw a roughly arranged diagram than a concise one. Test users had to proceed as follows:
• learning stage: getting used to the NSD resp. flowchart editor
• creation of a given concise NSD resp. complete flowchart consisting of 11 resp. 13 com-ponents (without counting arrows)
• creation of a roughly arranged version of the same NSD resp. an unconnected version of the same flowchart, and contraction thereof; Fig.1a actually shows an extract of the solution of one of the users
The empirical results shown in Tab.2indeed support the claim of this paper. The task perfor-mance is increased by a factor of more than 1.5 (at least in these scenarios). All drawn NSDs had been contracted by the editor as intended. In case of flowcharts, in total three arrows had been not drawn as intended (but still in a reasonable way). Remarkably, it can be observed that users even get better in drawing roughly arranged diagrams. For instance, in a second run several users had not created the diagram from top to bottom anymore, but rather by kind of component (i.e., many statements had been added at once). That way, the time for switching the component kind had been saved.
6
Related Work
User time for concise NSD time for rough NSD improvement factor
1 55s 33s 1.67
2 80s 45s 1.78
3 63s 33s 1.91
4 58s 32s 1.81
average 64s 36s 1.8
User time for complete fc time for just nodes improvement factor
1 55s 20s 2.75
2 70s 30s 2.33
3 68s 30s 2.67
4 63s 28s 2.25
average 64s 27s 2.4
Table 2: Empirical results for NSDs and flowcharts
user from drawing an incorrect diagram, i.e. an unconnected flowchart could not even be created. With a structure editor diagrams can only be manipulated by a predefined set of operations that transform correct diagrams into (other) correct diagrams. An example for such an operation in a flowchart editor would be to insert a new statement (with corresponding arrows) after a selected one. However, users still like to draw their diagrams freely just following the flow of their uninhibited associations. The operations of a structure editor impose significant restrictions to the users and, thus, hinder the editing process. In the context of sketch tools structure editors cannot be used at all, because it is inconvenient to perform the required selections with a pen.
Actually, a different kind of cost grammars has already been used successfully in the context of sketch tools. They appear to be well-suited for reasoning about the quality and interpretation of sketches, cf. [BM08]. In this approach, the resolution of ambiguities, which frequently occur in hand-drawn diagrams, is effectively supported by syntax analysis. That way, a more reliable recognition has been achieved. Since the authors achieved practical performance straight away, no clean-up phase as described in this paper had to be introduced.
Slight correction of geometric errors is also provided in CIDER [CM03] and (conventional) DIAGEN[Min02]. Both systems exploit layout constraints to this end. However, there is only a kind of tolerance threshold, which cannot be increased too much. Otherwise surprising results would be the consequence. Auto-link is also not supported there.
Finally, it has to be admitted that the practical importance of some kind of diagram contrac-tion, namely auto-link, has been recognized already in [WGK+08, GKW08].5 However, the
corresponding plugin is closed source and not officially released yet. The authors also do not describe their realization. Since the WebSphere Business Modeler is a special-purpose tool (and not ameta-tool) their solution (probably) cannot be used beyond business process models easily.
5 There, only activities need to be arranged. From their layout the missing gateways and sequence arrows are
7
Conclusion
The proposed approach to diagram contraction is promising for several reasons: First of all, it can be used to improve the editing performance and accessibility of free-hand diagram editors. It also has a positive impact on an editor’s “joy of use”. Furthermore, the attribution of the grammar with a cost function has appeared to be very handy. By this means the editor developer has a much finer control of the parsing process.
An editor with support for diagram contraction allows even freer editing. The distraction caused by the tedious precision work can be significantly reduced. First measurements have been conducted and the results confirm our original guess: The editing performance for drawing a given diagram is improved by a factor of more than 1.5. The recognition rate is acceptable (there is the typical trade-off with performance). No additional specification effort is required except for the cost function. As an important special case of diagram contraction the auto-link feature has been discussed. Therewith, the diagram components of certain graph-like languages can be connected automatically, which increases the editing performance even more.
In the future we would like to improve the support for the non-context-free parts of languages. At the moment those are not actively supported but rather just ignored (like messages in a struc-tured business process model). Furthermore, we would like to reduce the additional specification effort of providing a cost grammar. It might be possible to derive a reasonable cost grammar from a constraint hypergraph grammar [MV93], which often is defined already for the sake of layout.
Screencasts of the NSD and flowchart example editors (including demonstrations of diagram contraction and auto-link) can be found at http://www.unibw.de/inf2/DiaGen/assistance/. The editors can be downloaded from there, too.
Bibliography
[BM08] F. Brieler, M. Minas. Ambiguity Resolution for Sketched Diagrams by Syntax Anal-ysis Based on Graph Grammars. In Ermel et al. (eds.),Proc. 7th International Work-shop on Graph Transformation and Visual Modeling Techniques (GT-VMT ’08). Electronic Communications of the EASST 10. European Association of Software Science and Technology, 2008.
[CM03] S. S. Chok, K. Marriott. Automatic generation of intelligent diagram editors.ACM Trans. Comput.-Hum. Interact.10(3):244–276, 2003.
[DHK97] F. Drewes, A. Habel, H.-J. Kreowski. Hyperedge Replacement Graph Grammars. In Rozenberg (ed.),Handbook of Graph Grammars and Computing by Graph Trans-formation. Vol. I: Foundations. Chapter 2, pp. 95–162. World Scientific, 1997.
[Knu68] D. E. Knuth. Semantics of context-free languages. Theory of Computing Systems
2(2):127–145, 1968.
[Min02] M. Minas. Concepts and Realization of a Diagram Editor Generator Based on Hy-pergraph Transformation.Science of Computer Programming44(2):157–180, 2002.
[MMM08a] S. Mazanek, S. Maier, M. Minas. An Algorithm for Hypergraph Completion Ac-cording to Hyperedge Replacement Grammars. In Ehrig et al. (eds.), Proc. of the 4th International Conference on Graph Transformations. LNCS 5214, pp. 39–53. Springer, 2008.
[MMM08b] S. Mazanek, S. Maier, M. Minas. Auto-completion for Diagram Editors based on Graph Grammars. In Bottoni et al. (eds.), 2008 IEEE Symposium on Visual Lan-guages and Human-Centric Computing. Pp. 242–245. IEEE, 2008.
[MMM08c] S. Mazanek, S. Maier, M. Minas. Exploiting the Layout Engine to Assess Diagram Completions. In St¨orrle and Fish (eds.),Proc. 2nd International Workshop on Lay-out of (Software) Engineering Diagrams (LED 2008). Electronic Communications of the EASST 13. European Association of Software Science and Technology, 2008.
[MV93] M. Minas, G. Viehstaedt. Specification of diagram editors providing layout adjust-ment with minimal change. Proceedings of the 1993 IEEE Symposium on Visual Languages, pp. 324–329, Aug 1993.
[NS73] I. Nassi, B. Shneiderman. Flowchart techniques for structured programming. SIG-PLAN Not.8(8):12–26, 1973.
[Obj09] Object Management Group. Business Process Modeling Notation (BPMN). 2009.
http://www.omg.org/docs/formal/09-01-03.pdf.