International Journal Advances in Social Science and Humanities
Available online at: www.ijassh.com
RESEARCH ARTICLE
Changes in Perceptions of Service Quality Corresponding to
Population Growth
Adrian C. Mitchell
McNeese State University
Abstract
Basic service sector employment is often viewed as incorporating a large percentage of low skilled labor or labor that is new to the job market. In times of economic growth and population growth, demand for labor, at all levels, increases. This increase in labor demand also increases labor mobility, as employees are encouraged to find better employment when they gain a more competitive level of skills and experience. This is a concern for employers in the service industries. It is feared that rapid turnover in their workforce will affect the ability of service providers to assure quality in the service delivery. This report is the first step in a proposed longitudinal study that will attempt to measure changes in perceptions of service quality after a period of strong economic growth and population increase.
Keywords: Service quality, Population growth, Labor mobility, Entry level employment.
Introduction
In many of the world’s industrialized nations, the service industry has become a critical contributor to economic development. For several decades, this sector of the economy of many western nations has grown at rates greater than that of the production sector [1, 2]. It may even be argued that as an economy matures and as the standard of living of that economy increases, there is a general shift from production to service as a key driver of economic activity. Because of the importance of the service sector, many studies have been conducted regarding service quality and perceptions of quality in service delivery [1, 3-9].
One area of study regarding the service sector yet to be examined is that of potential changes to service quality during times of economic growth and population growth. Anecdotal expectations by community and business leaders tend to assume that economic growth and population increases will increase the level of labor mobility. As jobs become more readily available, experienced employees will take advantage of the growing market
and move toward better career opportunities. In addition, economic activity leading to lower unemployment is expected to increase the level of “churn” or speed at which entry level employees can be considered eligible for better employment.
Those employers who depend on entry level employees are often concerned that their ability to provide a quality service experience to customers will decline as their experienced employees are replaced by lesser skilled workers. This study is the first part of a longitudinal survey to determine if these expectations are correct, and to examine consumer perceptions of service quality during a period of population growth and economic expansion.
Labor and Economic Sectors
production of raw materials and basic foods. Activities associated with the primary sector include agriculture, mining, forestry, fishing and quarrying. The packaging and processing of the raw material associated with this sector is also considered to be part of this sector. Work in the secondary sector manufactures finished goods. All of manufacturing, processing, and construction lies within the secondary sector. This includes automobile production, chemical and engineering industries, energy utilities and construction. The tertiary sector of the economy is the service industry. This sector provides to-business and business-to-consumer services [10]. Activities associated with this sector include retail and wholesale trades, transportation and distribution, entertainment, restaurants, clerical services, media, tourism, insurance, banking, healthcare, and law. The quaternary sector consists of intellectual activities. Activities associated with this sector include government, culture, libraries, scientific research, education, and information technology. The quinary sector is often considered a branch of the quaternary sector. The quinary sector includes top executives or officials in such fields as government, science, universities, nonprofits, healthcare, and the media [10]. For the purpose of this report, the Tertiary sector of the market is examined as the primary sector for service based industry.
Defining Service and Service Quality
Services are unique in that they are typically produced and consumed
simultaneously [7,8]. We usually consider services as intangible products which require a high level of supplier-consumer interaction and involvement [7,8]. Concepts of service quality are rooted in the expectancy disconfirmation theory [11, 12]. Managers and workers producing products in a factory can create a subjective measure of quality based upon the output product’s conformance to production standards. However, because of the high degree of customer interaction, the quality of a service becomes a more subjective measure, depending on both the service delivery ability to meet specifications and the customer’s expectations prior to the service delivery [1, 3, 5, 7, 8]. Service quality has been described as an attitude, similar but not equal to satisfaction, that results from the comparison of expectations with performance [6, 9, 13].
Disconfirmation Theory
The Expectancy Disconfirmation Theory (EDT) is considered by many as the primary foundation for satisfaction models [8,12,14]. According to this theory, satisfaction is determined by the discrepancy between perceived performance and expectation or desires [12, 15]. Customer dissonance between expectations and experienced outcomes leads to unpleasant feelings which the customer will psychologically attempt to resolve either through seeking recourse for satisfaction or changing expectations service quality [16]. The basic model of the Expectancy Disconfirmation Theory is provided in Figure 1.
Figure 1: The basic model of the expectancy disconfirmation theory
Expectations - Customer expectations of the service encounter can be formed by many factors, including previous experience with a service provider, advertising, business reputation, customer background, and even
Perceived Performance- The customers’ interpretation of the experience after the encounter. This experience can be perceived as better than expected, worse than expected, or as expected [16, 19].
Satisfaction - Customer satisfaction with products and services is an evaluation comparing pre-purchase expectations to subjective post-purchase experiences [12]. Kotler defined satisfaction as a person’s feelings of pleasure or disappointment resulting from comparing a product’s perceived performance (or outcome) in relation to his or her expectation [20].
Economic Growth and Service Quality
Labor mobility is often considered a “natural characteristic” of an industrial society. It is not unusual for individuals to first gain skills in the tertiary and sometimes secondary sectors of the economy. These sectors often have positions available for lower skilled or non-skilled workers. While some find long-term careers in the tertiary sector, many move to more gainful employment in the secondary, primary, quaternary or quinary sectors as they gain skills, experience, and sometimes training and education [21]. For the purpose of this research project, it is hypothesized that increased labor mobility, caused by a growing economy and growing population base, will cause a decline in overall perceptions of service quality, as experience by consumers.
Economic Growth: The Test Region
To determine if economic growth affects service quality, a region of the United State that is anticipating strong economic growth was selected. As a test case, the five-parish region of Southwest Louisiana consists of Allen, Beauregard, Calcasieu, Cameron, and Jeff Davis parishes and is a recognized metropolitan area commonly referred to as Southwest Louisiana (SWLA). Though severely damaged by Hurricane Rita in 2005, SWLA later prospered as local reconstruction efforts helped offset national economic declines and a collapse of the national housing market. Recent technological breakthroughs in oil and
natural gas extraction and refinement as well as lower prices for natural gas are now driving economic activity for the region with considerable growth predicted in the short to mid-term future [10].
Planned industry growth in Southwest Louisiana (SWLA) includes the following project investments[22, 23]:
Belle Savanne - $230 million capital investment
Big Lake Fuels - $1.3 billion capital investment
Boise Inc. - $113 million capital
investment
BP Biofuels - $400 million capital
investment
CB&I/Shaw Modula Solutions - $100 million capital investment
Cheniere Energy - $20 billion capital investment
Coushatta Casino Resort - $60 million capital investment
Golden Nugget/Pinnacle/Ameristar - $580 million capital investment
IFG Port Holding/New Grain Terminal - $59.5 million capital investment
Juniper GTL - $100 million capital
investment
Lake Charles Clean Energy (Leucadia) - $2.6 billion capital investment
Lake Charles LNG (Trunkline LNG
Export) - $9 billion capital investment
Lakes at Morganfield - $350 million capital investment
Leucadia National Corporation/LC
Cogeneration - $2.6 billion capital investment
Magnolia LNG - $3.5 billion capital
investment
National Hurricane Museum - $66 million
capital investment
SASOL Ethylene Tetramerization - $175 million capital investment
SASOL GTL & Derivatives - $16 billion capital investment
Sempra/Cameron LNG - $9 billion capital investment
Virtual Engineering Operations VEOPS - $100 million capital investment
31,000 construction workers will be employed during peak construction years, expected to end between 2018 and 2021 [22, 23]. A more specific projection of workforce needs includes the following [22, 23]:
New Construction Jobs 31000+ New Permanent/Direct Jobs 6300+
New Permanent/Indirect Jobs 6300+
New Permanent/Induced Jobs 6200+
After construction is completed, as many as 18,000+ new permanent jobs will be added to the primary and secondary employment sectors to accommodate new production. New employment opportunities typically equate to population growth, as workers and their families move into the area to take advantage of the growing economy. It is predicted that the five-parish area classified as “Southwest Louisiana” may have as many as 50,000 new residents by the year 2020 [24]. This region had a 2010 population of approximately 300,000 [25], for an expected population growth of approximately 17% over a five to eight year period.
The Research Study: SERVQUAL and Critical Incident Technique
To determine initial consumer opinions of service quality in the SWLA region, this study utilizes the Critical Incident Technique (CIT) to apply the SERVQUAL scale. SERQUAL is a scale that assesses client satisfaction based upon the difference between client expectations and service performance [18, 26]. Developed by Parasuraman, Zeithaml and Berry [9], the SERVQUAL model is widely used in studying the customers’ perception of services received from the various service providers [27]. The model has been used in the study of many types of services, including hospital outpatient services [28,29] public services [30] private healthcare [31] library services [32] business to business sales and services [33] information technology [34-36] education services [37] and logistics services [38].
The SERVQUAL model consists of five main dimensions, tangibility, reliability, responsiveness, assurance and empathy [9].
Tangibles: physical facilities, equipment, external appearance of store and appearance of personnel.
Reliability: company’s potential of
performing the promised service dependably and accurately.
Responsiveness: company’s willingness to help customers and provide prompt service.
Assurance: employees’ knowledge and
courtesy levels and their ability to inspire trust and confidence. This dimension also includes competence, courtesy, credibility, and security.
Empathy: caring and personalized
attention that the firm provides to its customers. This dimension also includes access, communication and understanding the customer.
To apply the scale, this study utilizes the Critical Incident Technique (CIT). Developed by John Flanagan [39], CIT is “a set of procedures for collecting direct observations of human behavior in such a way as to facilitate their potential usefulness in solving practical problems and developing broad psychological principles. The critical incident technique outlines procedures for collecting observed incidents having special significance and meeting systematically defined criteria” [39]. CIT has shown useful in qualitative research and provides a step-by-step approach to collecting and analyzing information about human activities and their significance to the people involved [40].
According to Flanagan [39] “an incident is critical if it makes a ‘significant’ contribution, either positively or negatively to the general aim of the activity and it should be capable of being critiqued or analyzed.”
5=Yes. “Not applicable” was a sixth choice, in which case the specific item was left blank on the study.
Survey Findings
Demographics
Table 1: Gender and age
Seventy five responses were collected. Table 1 indicates the gender and age ranges of the respondents. The majority of respondents were female as is expected in a typical US shopping environment.
Gender N Age n %
Male 32 18-30 44 58.6%
Female 43 31-45 10 13.3%
46-55 7 9.3%
55+ 9 12.0%
Unreported 5 .06%
Table 2 reports the nature of the service encounter that each respondent was recalling as a critical incident. The majority were listed as restaurant encounters. The second largest reporting was a rather generic term of “retail”, but it
is interpreted to represent an in-store retail purchase encounter. The final category of “other” is made up of single item encounters that included a carwash, gas station, museum, phone company, and plumbing service.
Table 2: Service Encounters
Service Area %
Restaurant 46.6%
Retail 24.0%
Banking 14.7%
Mechanic Shop 2.6%
Medical Office 2.6%
Hair/Nail Salon 2.6%
Other 6.9%
Reliability
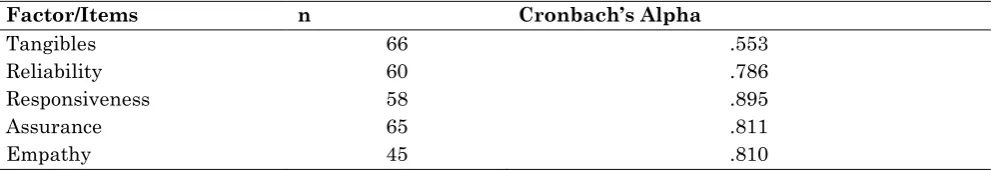
Cronbach’s Alpha is used as a lower bound estimate of the reliability of a psychometric test. As a typical rule of thumb, values of
0.70 or higher are desired. In this survey, all factors accept.
Table 3: Reliability Measures
Factor/Items n Cronbach’s Alpha
Tangibles 66 .553
Reliability 60 .786
Responsiveness 58 .895
Assurance 65 .811
Empathy 45 .810
Tangibles achieved the benchmark measure
(Table 3). It is assumed at this point that the low reliability of the factor Tangibles may be art of the nature of this particular study and may arise from two basic issues. First,
given that respondents could choose any service activity they had experienced, it is possible that a significant number of respondents were reflecting upon a service encounter that did not require written ortangible materials. Second, it is also possible that employee dress and/or faculty
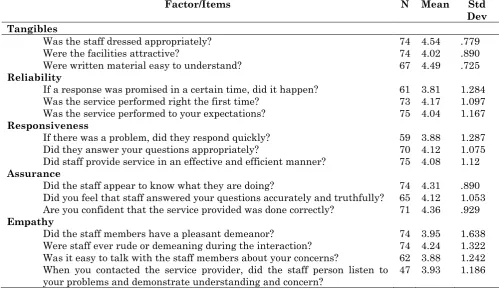
Table 4:Survey Results
Factor/Items N Mean Std
Dev Tangibles
Was the staff dressed appropriately? 74 4.54 .779 Were the facilities attractive? 74 4.02 .890 Were written material easy to understand? 67 4.49 .725
Reliability
If a response was promised in a certain time, did it happen? 61 3.81 1.284 Was the service performed right the first time? 73 4.17 1.097 Was the service performed to your expectations? 75 4.04 1.167
Responsiveness
If there was a problem, did they respond quickly? 59 3.88 1.287 Did they answer your questions appropriately? 70 4.12 1.075 Did staff provide service in an effective and efficient manner? 75 4.08 1.12
Assurance
Did the staff appear to know what they are doing? 74 4.31 .890 Did you feel that staff answered your questions accurately and truthfully? 65 4.12 1.053 Are you confident that the service provided was done correctly? 71 4.36 .929
Empathy
Did the staff members have a pleasant demeanor? 74 3.95 1.638 Were staff ever rude or demeaning during the interaction? 74 4.24 1.322 Was it easy to talk with the staff members about your concerns? 62 3.88 1.242 When you contacted the service provider, did the staff person listen to
your problems and demonstrate understanding and concern? 47 3.93 1.186
In general, the factor of “Tangibles” shows the greatest overall satisfaction with lower variation in customer opinions. However, the lower reliability score for the factor “Tangibles” suggests that consumers are likely satisfied with the business facilities, staff dress, and written materials, but they also may consider this of less importance regarding their overall satisfaction of the service experience. The remaining factors, while overall scoring above average in consumer satisfaction, also show considerable variation in customer opinions, indicating a wide range of customer experiences from very satisfied to very unsatisfied.
Limitations and Recommendations
This is the first part of a two-part longitudinal study to determine if economic growth and population growth will have a negative effect on consumer perceptions of service quality. It is anticipated that this study will be repeated five years after the original survey to determine if there has been a significant change in consumer attitudes regarding service quality. The methodology will be repeated but with a
different list of randomly selected volunteers.
In general, it appears that consumers in the Southwest Louisiana region are generally satisfied with their current service encounter experiences. Most service quality measurement criteria were ranked as average or above average.
There are several limitations regarding the methodology and measurement instrument used. While SERVQUAL is a well known instrument for determining consumer perceptions of the service quality experience, other measurement instruments have claimed to provide more accurate assessments of service quality opinions. Likewise, the critical incident technique is well respected as a methodology for qualitative study. However, each respondent’s recollection of a service experience can differ as can each respondent’s expectations for quality in the service delivery process.
inspired by economic growth, namely population growth, increased labor mobility, and an increase in hiring for non-skilled workers into the tertiary markets will have
an overall affect on service quality. In general, consumer opinions of service quality in the SWLA region appear to be above average. A second test will determine if these opinions have changed over time.
References
1. Calabrese A, Spadoni A (2013) Quality versus productivity in service production systems: An organizational analysis. International Journal of Production Research. 51(22): 6594-6606.
2. Ostrom AL, Bitner MJ, Brown SW, Burkhard KA, Goul M, Smith-Daniels V, Demirkan H, Rabinovich E (2010) Moving forward and making a difference: research priorities for the science of service. Journal of Service Research 13(1):4-36.
3. Bitner MJ, Hubbert AR (1994) Encounter Satisfaction versus Overall Satisfaction versus Quality. In Service Quality: New Directions in Theory and Practice, edited by R. T. Rust and R. L. Oliver, 72–94. Thousand Oaks, CA: Sage.
4. Bolton RN, Drew JH (Í99lb) A Multistage model of customers' assessments of service quality and value. Journal of Consumer Research. 17(March): 375-84.
5. Choi KS, Cho WH, Lee S, Lee H, Kim C (2004) The relationships among quality, value, satisfaction and behavioral intention in health care provider choice: A South Korean study. Journal of Business Research. 57(8): 913-21.
6. Cronin J, Taylor S (1992) Measuring service quality: A Reexamination and Extension. Journal of Marketing. 56(July): 55-68.
7. Gronroos C (1984) A Service quality model and its marketing implications. European Journal of Marketing. 18(4): 36-44.
8. McKinney V, Yoon K and Zahedi FM (2002) the measurement of web-customer satisfaction: an expectation and disconfirmation approach. Information System Research. 13(3): 296-315.
9. Parasuraman A, Zeithaml VA, Berry LL (1985) A conceptual model of service quality and its implications for future research. Journal of Marketing. 49: 41-50.
10. Adrian CM (2014) Developing a simple model for job growth in the tertiary and quaternary sectors: predicting employment based upon anticipated population growth. Journal of
Economics and Development Studies. 2(3):49-59.
11. Collier JE, Bienstock CC (2006) Measuring service quality in e-retailing. Journal of Service Research. 8(3): 260-75.
12. Rao P, Sahu P (2013) Impact of service quality on customer satisfaction in hotel industry. Journal of Humanities and Social Science. 18(5): 39-44.
13. Bolton RN, Drew JH (1991a) A Longitudinal analysis of the impact of service changes on customer attitudes. Journal of Marketing. 55(January): 1-9.
14. Churchill GA, Suprenant C (1992) An investigation into the determinant of customer satisfaction. Journal of Marketing Research. 19: 491-504.
15. Khalifa M, Liu, V (2003) Determinants of satisfaction at different adoption stages of internet-based services. Journal of the Association for Information Systems, 4(5): 206-232.
16. Elkhani N, Bakri A (2012) Review on “expectancy disconfirmation theory” (EDT) Model in B2C E-Commerce. Journal of Information Systems Research and Innovation. 2(Dec): 95-102.
17. Davidow WH, Uttal B (1989) Service companies: Focus or falter. Harvard Business Review. July-August: 77-85.
18. Zeithaml V, Parasuraman A, Berry L (1990) Delivering Quality Service. Free Press, New York, NY.
19. Spreng RA, MacKenzie SB, Olshavsky RW (1996) A reexamination of the determinants of consumer satisfaction. Journal of Marketing 60: 15-32.
20. Kotler P (2000) Marketing Management. 10th
ed. New Jersey, Prentice-Hall.
21. Payne G, Payne J (1983) Occupational and industrial transition in social mobility. British Journal of Sociology. 34(1): 72-93 22. SWLA Chamber Report (2013) compiled by
23. SWLA Chamber Projects Report (2013) 2012-2019 SWLA Estimated Workforce Needs Report, Updated 4.4.14.
24. Schmidt T (2013) Go Group Plans for Economic Boom. KPLC TV, Posted Sept. 27,
2013. Available:
http://www.kplctv.com/story/23553234/go-group-plans-for-lc-economic-boom
25. U.S. Department of Commerce Census
Bureau Available:
http://www.census.gov/easystats/
26. Nair R, Ranjigh PV, Bose S, Shri C (2010) A Study of service quality on banks with servqual model. SIES Journal of Management. 7(1): 35-45.
27. Carrillat F, Jaramillo F, Mulki JP (2007) The validity of SERVQUAL and SERVPERF scales: A meta-analytic view of 17 years of research across five continents, International Journal of Service Industry Management. 18(5): 472-490.
28. Hu HY, Lee YC, Yen TM (2010) Service quality gaps analysis based on fuzzy linguistic SERVQUAL with a case study in hospital out-patient services. The TQM Journal. 22(5): 499-515.
29. Juwaheer TD (2004) Exploring international tourists’ perceptions of hotel operations by using a modified SERVQUAL approach-A case study of Mauritius. Managing Service Quality. 14(5): 350-364.
30. Brysland A, Curry A (2001) Service improvements in public services using SERVQUAL. Managing Service Quality. 11(6): 389-401.
31. Butt MH, Cyril de Run E (2010) Private healthcare quality: Applying a SERVQUAL model. International Journal of Health Care Quality Assurance. 23(7): 658-673.
32. Ahmed SMZ, Shoeb MZH (2009) Measuring service quality of a public university library in Bangladesh using SERVQUAL. Performance Measurement and Metrics. 10(1):17-32.
33. Gounaris S (2005) Measuring service quality in b2b services: An evaluation of the SERVQUAL scale vis-a-vis the INDSERV scale. Journal of Services Marketing. 19(6): 421-435.
34. Badri MA, Abdulla M, Al-madani A (2005) Information technology center service quality: assessment and application of SERVQUAL. International Journal of Quality and Reliability Management. 22(8): 819-848.
35. Hsiao KL, Lin JCC, Wang XY, Lu HP, Yu H (2010) Antecedents and consequences of trust in online product recommendations: An empirical study in social shopping. Online Information Review. 34(6): 935-953.
36. Iwaarden JV, Wiele TVD, Ball L, Millen R (2003) Applying SERVQUAL to web sites: An exploratory study. International Journal of Quality and Reliability Management. 20(8): 919-935.
37. Sahney S, Banwet DK, Karunes S (2004) A SERVQUAL and QFD approach to total quality education: A student perspective. International Journal of Productivity and Performance Management. 53(2): 143-166. 38. Baki B, Basfirinci CS, Cilingir Z, Murat I
(2009) An application of integrating SERVQUAL and Kano’s model into QFD for logistics services: A case study from Turkey. Asia Pacific Journal of Marketing and Logistics. 21(1): 106-126.
39. Flanagan JC (1954) The critical incident technique. The Psychological Bulletin. 51(4): 327-358.