MODIFIED STEPWISE REGRESSION MODELS ON
SIMPLIFYING THE ARWU’S INDICATORS
Farrah Pei-Chen Chang & Liang-Yuh Ouyang
Department of Management Sciences, Tamkang University, 25137,
Taiwan
[email protected] & [email protected]
ABSTRACT
The Academic Ranking of World Universities (ARWU) uses six indicators and their relative percentage weights to measure the
academic performance of universities. The sixth indicator, the universities’ per capita performance is a weighted average of the scores
obtained in the previous five categories, divided by the number of current full-time equivalent academic staff members. However, the
data sources of the number of current full-time equivalent academic staff members are not consistent for all participating universities,
which might lead to an inconsistent comparison of the global competition. In attempt to simplify the indicators, this paper uses a
stepwise regression analysis for each ranking year, and constructs stepwise regression models from 2004 to 2016. Of the constructed
five models throughout the ranking years, we find three models that have the better model fitting. Furthermore, the new scoring
formulas generated from the three modified stepwise regression models are all adequate to replace the original scoring formula. As it is
shown in our empirical study, the three modified scoring formulas all produce very similar results when compared with the original
outcomes.
Keywords
:
Academic Ranking of World Universities, stepwise regression model, correlation coefficient, partial correlationcoefficient, coefficient of determination.
1.
INTRODUCTION
The Academic Ranking of World Universities (ARWU) is one of the earliest and major world rankings of universities. It was first
compiled and published in 2003 by the Center for World-Class Universities (CWCU) at the Graduate School of Education of Shanghai
Jiao Tong University in China. Since 2009, ARWU has been published by Shanghai Ranking Consultancy, an independent organization
Times Higher Education (THE), ARWU also focuses on the research citations and productivity of higher education institutions as its core
criteria. Differ from the other major rankings, however, ARWU does not evaluate an institution’s academic and research reputations,
which are indicators with higher percentage of weights in the methodology of the other rankings. Dehon, McCathie and Verardi[3] noted
that the ARWU is now one of the best-known international ranking of universities. While its initial purpose was to ascertain the
relative position of Chinese universities internationally, the ranking now receives considerable attention from higher education
stakeholders around the world.
ARWU uses six indicators and their relative percentage weights to measure the academic performance of universities. Each
participating university receives an overall score, which is a weighted average of individual indicator scores, and is ranked by the overall
score. The best performing university of a particular ranking year is given a score of 100, and the scores of other universities are
measured accordingly. Since 2004, universities are ranked by linear combinations of ARWU’s six indicators, namely:(i) alumni winning
Nobel Prizes and Fields Medals (10% weight, and coded by Alumni), (ii)staff winning Nobel Prizes and Fields Medals(20% weight, and
coded by Award), (iii) highly cited researchers in 21 broad subject categories (20% weight, and coded by HiCi), (iv) papers published in
Nature and Science (20% weight, and coded by N&S), (v) papers indexed in major citation indices (Science Citation Index-Expanded
and Social Science Citation Index)(20% weight, and coded by PUB), and (vi) the per capita academic performance of an institution (10%
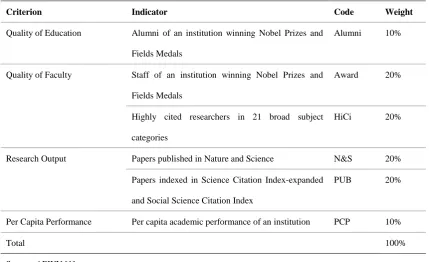
weight, and coded by PCP). ARWU measures four criteria with the above six indicators, namely:(a) the quality of education (measured
by Alumni), (b) the quality of faculty (measured by Award and HiCi), (c) research output (reflected in N&S and PUB), and (d)
universities’ per capita performance (measured by PCP). Table 1 presents ARWU’s criteria, indicators, codes and weights.
Table 1. Criteria, indicators and weights for ARWU(2004–2016)
Criterion Indicator Code Weight
Quality of Education Alumni of an institution winning Nobel Prizes and
Fields Medals
Alumni 10%
Quality of Faculty Staff of an institution winning Nobel Prizes and
Fields Medals
Award 20%
Highly cited researchers in 21 broad subject
categories
HiCi 20%
Research Output Papers published in Nature and Science N&S 20%
Papers indexed in Science Citation Index-expanded
and Social Science Citation Index
PUB 20%
Per Capita Performance Per capita academic performance of an institution PCP 10%
Total 100%
Source: ARWU [1]
data (Liu [4]), and has attracted a great deal of attention from the scientific community worldwide, in part due to the simplicity and
transparency of its criteria (Liu and Cheng [5]). However, it is stated in the ARWU [1] methodology that “If the number of academic
staff for institutions of a country cannot be obtained, the weighted scores of the above five indicators is used.” In other words, the data
needed for the sixth indicator are not consistent for all participating universities. In fact, ARWU[1] also mentions that “the numbers of
full-time equivalent academic staff are obtained for institutions in USA, UK, France, Canada, Japan, Italy, China, Australia, Netherlands,
Sweden, Switzerland, Belgium, South Korea, Czech, Slovenia, New Zealand etc.” Since not all universities in all countries that are
included in the ranking have the data for their full-time equivalent staff, this is likely to lead to an inconsistent comparison in this
global competition. In fact, PCP is only favorable for institutions with fewer full-time equivalent academic staff. For example, California
Institute of Technology has earned a PCP score of 100 each year throughout all the ranking years; on the other hand, Harvard University,
earning almost full scores (Score 100) for five of the indicators (except for PCP) in all the ranking years, its PCP scores range only from
60.6 to 79.2 from 2004 to 2016, due to owning a large number of full-time equivalent academic staff.
In reviewing the ARWU indicators, Dehon, McCathie and Verardi[3] used robust principal component analysis to uncover the
underlying factors measured by the ranking, which turned out to be the overall research output and top-notch researchers. Billaut,
Bouyssou and Vincke[2] used tools and concepts from Multiple Criteria Decision Making (MCDM) to discuss the relevance of the
criteria and then analyzed a proposed aggregation method as an alternative for the ARWU methodology. In the work of
Luque-Martínez and del Barrio-García[6], they constructed a synthetic procedure, or a synthetic indicator, for the measurement of
university research and innovation activities. Marginson[7] mentioned that research performance is the whole content of the ARWU,
and that if the multi-indicator rankings were disaggregated, the individual indicators could effectively drive performance improvement,
and that ranking competition would be directed towards better outcomes. In response to opinions regarding ARWU methodology, Liu
[4] points out that any ranking is controversial, and no ranking is absolutely objective. World university rankings have become
important references in decision-making processes for stakeholders of higher education in recent years. Since the initial launch of
ARWU in 2003, university rankings have expanded in dimension and diversity, and they are likely to have an even greater impact on
the global higher education. It is crucial that these rankings continue to produce results based on consistent and unbiased
methodologies. As previously mentioned, the data sources for the sixth ARWU indicator have a tendency to be inconsistent. In this
paper, we will use stepwise regression analysis in attempt to simplify the ARWU ranking indicators.
2.
Stepwise regression analysis for world’s top 500 universities
The ARWU publishes its league table on its website, with the complete score information for each of the six indicators and the
overall scores for institutions ranked top 1 to 100. Thereafter, the ranks feature in groups of 50 from top 101 to 200, and groups of 100
from top 201 to 500; for universities ranked in groups, their score information for each indicator remains public, while the overall scores
are omitted. The data used for this paper were collected directly from the website (ARWU [1]), including the overall scores, ranks, and
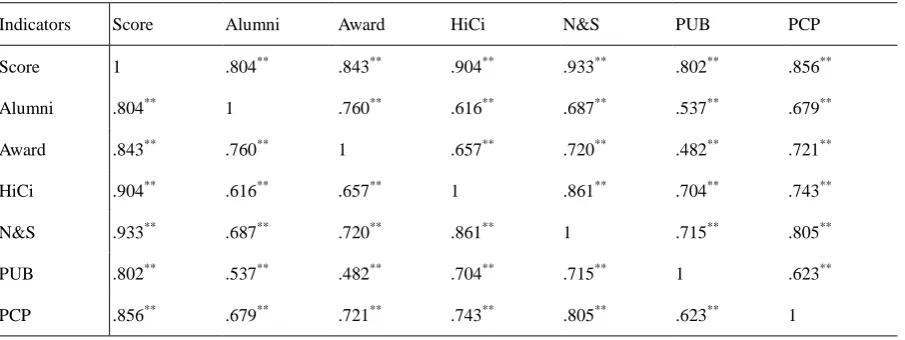
scores of each indicators. Since the website only presents the overall scores and ranks for the top 100 institutions, and only the rank
ranking from 101 to 500 from 2004 to 2016 were recomputed using ARWU’s scoring method. After the recomputation, we found that
all of the indicators’ scores were correlated with each other, and they were highly correlated with the overall scores (coded Score) of
each year from 2004 to 2016, as shown in Table 2 to Table14.
Table 2. Correlation coefficients matrix of the overall scores and the six indicator scores for world’s top 500
universities in the 2004 ARWU
Indicators Score Alumni Award HiCi N&S PUB PCP
Score 1 .797** .842** .897** .931** .805** .830**
Alumni .797** 1 .762** .597** .665** .544** .679**
Award .842** .762** 1 .654** .703** .495** .730**
HiCi .897** .597** .654** 1 .854** .679** .698**
N&S .931** .665** .703** .854** 1 .736** .767**
PUB .805** .544** .495** .679** .736** 1 .561**
PCP .830** .679** .730** .698** .767** .561** 1
** p< 0.001
Table 3. Correlation coefficients matrix of the overall scores and the six indicator scores for world’s top 500
universities in the 2005 ARWU
Indicators Score Alumni Award HiCi N&S PUB PCP
Score 1 .802** .835** .900** .930** .814** .885**
Alumni .802** 1 .749** .607** .675** .557** .694**
Award .835** .749** 1 .646** .703** .482** .747**
HiCi .900** .607** .646** 1 .858** .703** .763**
N&S .930** .675** .703** .858** 1 .733** .827**
PUB .814** .557** .482** .703** .733** 1 .681**
PCP .885** .694** .747** .763** .827** .681** 1
** p< 0.001
Table 4. Correlation coefficients matrix of the overall scores and the six indicator scores for world’s top 500
universities in the 2006 ARWU
Indicators Score Alumni Award HiCi N&S PUB PCP
Score 1 .801** .839** .902** .931** .801** .848**
Award .839** .755** 1 .655** .713** .476** .718**
HiCi .902** .610** .655** 1 .861** .690** .726**
N&S .931** .682** .713** .861** 1 .707** .805**
PUB .801** .538** .476** .690** .707** 1 .616**
PCP .848** .669** .718** .726** .805** .616** 1
** p< 0.001
Table 5. Correlation coefficients matrix of the overall scores and the six indicator scores for world’s top 500
universities in the 2007 ARWU
Indicators Score Alumni Award HiCi N&S PUB PCP
Score 1 .804** .843** .904** .933** .802** .856**
Alumni .804** 1 .760** .616** .687** .537** .679**
Award .843** .760** 1 .657** .720** .482** .721**
HiCi .904** .616** .657** 1 .861** .704** .743**
N&S .933** .687** .720** .861** 1 .715** .805**
PUB .802** .537** .482** .704** .715** 1 .623**
PCP .856** .679** .721** .743** .805** .623** 1
** p< 0.001
Table 6. Correlation coefficients matrix of the overall scores and the six indicator scores for world’s top 500
universities in the 2008 ARWU
Indicators Score Alumni Award HiCi N&S PUB PCP
Score 1 .799** .848** .902** .933** .794** .848**
Alumni .799** 1 .759** .615** .683** .524** .675**
Award .848** .759** 1 .664** .726** .484** .716**
HiCi .902** .615** .664** 1 .864** .678** .729**
N&S .933** .683** .726** .864** 1 .704** .785**
PUB .794** .524** .484** .678** .704** 1 .620**
PCP .848** .675** .716** .729** .785** .620** 1
Table 7. Correlation coefficients matrix of the overall scores and the six indicator scores for world’s top 500
universities in the 2009 ARWU
Indicators Score Alumni Award HiCi N&S PUB PCP
Score 1 .798** .852** .901** .933** .786** .838**
Alumni .798** 1 .758** .608** .682** .521** .672**
Award .852** .758** 1 .665** .728** .483** .723**
HiCi .901** .608** .665** 1 .861** .669** .728**
N&S .933** .682** .728** .861** 1 .700** .783**
PUB .786** .521** .483** .669** .700** 1 .567**
PCP .838** .672** .723** .728** .783** .567** 1
** p< 0.001
Table 8. Correlation coefficients matrix of the overall scores and the six indicator scores for world’s top 500
universities in the 2010 ARWU
Indicators Score Alumni Award HiCi N&S PUB PCP
Score 1 .805** .854** .895** .932** .764** .794**
Alumni .805** 1 .762** .618** .691** .502** .668**
Award .854** .762** 1 .665** .732** .458** .734**
HiCi .895** .618** .665** 1 .856** .630** .664**
N&S .932** .691** .732** .856** 1 .679** .735**
PUB .764** .502** .458** .630** .679** 1 .474**
PCP .794** .668** .734** .664** .735** .474** 1
** p < 0.001
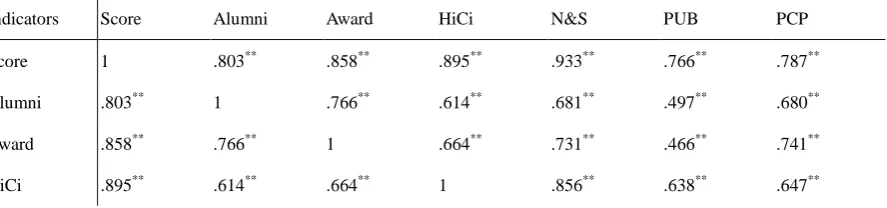
Table 9. Correlation coefficients matrix of the overall scores and the six indicator scores for world’s top 500
universities in the 2011 ARWU
Indicators Score Alumni Award HiCi N&S PUB PCP
Score 1 .803** .858** .895** .933** .766** .787**
Alumni .803** 1 .766** .614** .681** .497** .680**
Award .858** .766** 1 .664** .731** .466** .741**
N&S .933** .681** .731** .856** 1 .695** .717**
PUB .766** .497** .466** .638** .695** 1 .461**
PCP .787** .680** .741** .647** .717** .461** 1
** p< 0.001
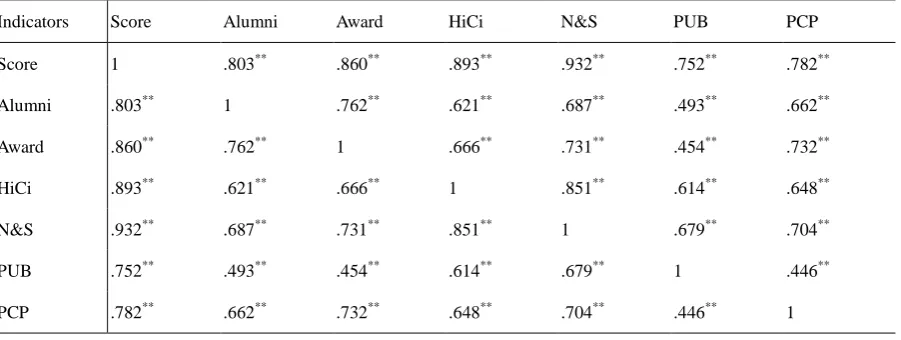
Table 10. Correlation coefficients matrix of the overall scores and the six indicator scores for world’s top 500
universities in the 2012 ARWU
Indicators Score Alumni Award HiCi N&S PUB PCP
Score 1 .803** .860** .893** .932** .752** .782**
Alumni .803** 1 .762** .621** .687** .493** .662**
Award .860** .762** 1 .666** .731** .454** .732**
HiCi .893** .621** .666** 1 .851** .614** .648**
N&S .932** .687** .731** .851** 1 .679** .704**
PUB .752** .493** .454** .614** .679** 1 .446**
PCP .782** .662** .732** .648** .704** .446** 1
** p< 0.001
Table 11. Correlation coefficients matrix of the overall scores and the six indicator scores for world’s top 500
universities in the 2013 ARWU
Indicators Score Alumni Award HiCi N&S PUB PCP
Score 1 .802** .862** .889** .934** .742** .770**
Alumni .802** 1 .763** .617** .687** .480** .657**
Award .862** .763** 1 .669** .742** .447** .726**
HiCi .889** .617** .669** 1 .847** .592** .624**
N&S .934** .687** .742** .847** 1 .668** .705**
PUB .742** .480** .447** .592** .668** 1 .428**
PCP .770** .657** .726** .624** .705** .428** 1
Table 12. Correlation coefficients matrix of the overall scores and the six indicator scores for world’s top 500
universities in the 2014 ARWU
Indicators Score Alumni Award HiCi N&S PUB PCP
Score 1 .796** .861** .899** .934** .750** .774**
Alumni .796** 1 .769** .610** .688** .464** .649**
Award .861** .769** 1 .669** .743** .441** .718**
HiCi .899** .610** .669** 1 .867** .648** .643**
N&S .934** .688** .743** .867** 1 .658** .698**
PUB .750** .464** .441** .648** .658** 1 .441**
PCP .774** .649** .718** .643** .698** .441** 1
** p< 0.001
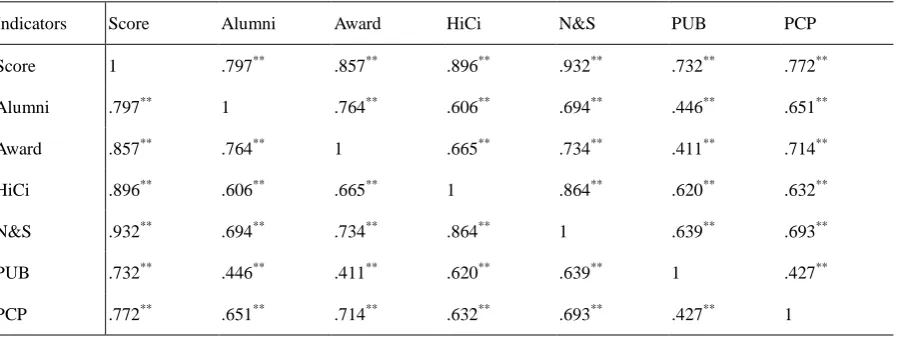
Table 13. Correlation coefficients matrix of the overall scores and the six indicator scores for world’s top 500
universities in the 2015 ARWU
Indicators Score Alumni Award HiCi N&S PUB PCP
Score 1 .797** .857** .896** .932** .732** .772**
Alumni .797** 1 .764** .606** .694** .446** .651**
Award .857** .764** 1 .665** .734** .411** .714**
HiCi .896** .606** .665** 1 .864** .620** .632**
N&S .932** .694** .734** .864** 1 .639** .693**
PUB .732** .446** .411** .620** .639** 1 .427**
PCP .772** .651** .714** .632** .693** .427** 1
** p< 0.001
Table 14. Correlation coefficients matrix of the overall scores and the six indicator scores for world’s top 500
universities in the 2016 ARWU
Indicators Score Alumni Award HiCi N&S PUB PCP
Score 1 .782** .846** .825** .925** .735** .762**
Alumni .782** 1 .765** .479** .708** .438** .617**
Award .846** .765** 1 .546** .751** .408** .686**
N&S .925** .708** .751** .738** 1 .628** .686**
PUB .735** .438** .408** .579** .628** 1 .405**
PCP .762** .617** .686** .595** .686** .405** 1
** p< 0.001
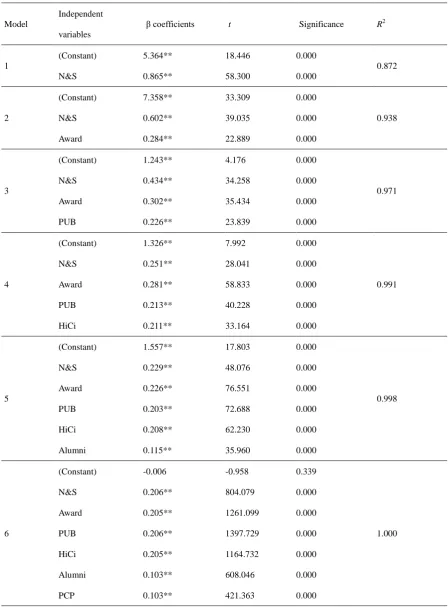
We first presented six stepwise regression models for the world’s Top 500 universities using the 2013 ARWU data as an example.
The results are shown in Table 15.In statistics, the coefficient of determination R2 (0≦R2≦
1) indicates how well the data fit a statistical
model. It provides a measure of how well observed outcomes are replicated by the model, as the proportion of total variation of
outcomes explained by the model. The coefficient of determination R2of a stepwise regression model, where in our case with Scores the
dependent variable and the indicators as independent variables, is composed of the correlation coefficients and the partial correlation
coefficients, which can be explained in a stepwise regression analysis. For example, Table 11 illustrates the correlation coefficients
matrix between Score and the six indicators of the 2013 ARWU. Among the independent variables (thesix indicators), N&S owns the
largest correlation coefficient 0.934 with Score. This indicates that N&S is the first choice of factor to predict Score, if we were to
select an indicator to do so. Model 1 in Table 15shows the linear regression with R2 = (0.934)2 = 0.872, which means that 87.2% of the
total variation of Score can be explained by Model 1; which also means that the Scorecan be predicted by Model 1. When the R2value is
closer to 1, it indicates that the data fit a statistical model well. Base on this notion, we explore how much better the data would fit a
model (with a larger R2value), by adding the next influential indicator(s) into the model.
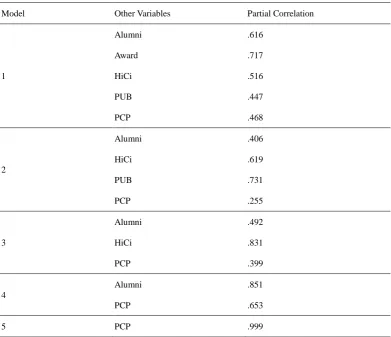
The next influential indicator(s) are determined by the data’s partial correlations. In statistics, a partial correlation is to measure
the degree of association between two random variables after removing a set of controlling random variables. Table 16 shows the
partial correlation for world’s top 500 universities in the 2013 ARWU.
As shown in Model 2 in Table 15, Award enters into the model after N&S, as the second independent variable, and increases the
R2 value from 0.872 to 0.938. This is due to the fact that, among the five other variables for Model 1 (in Table 16), Award owns the
largest partial correlation (= 0.717) without the statistical effect of N&S on Score. The calculation for the R2 value for Model 2 (in Table
15) is as follows.
R2of Model 2 = (R2 of Model 1) + (1- R2 of Model 1) x (0.717)2
=0.872 + (1-0.872) x (0.717)2
=0.872 + (0.128) x (0.514)
=0.872 + 0.066
=0.938.
By adding Award to Model 1 (in Table 15), it then becomes Model 2 where the total variation of Score is explained with a 6.6%
increase, such that Model 2 can explain 93.8% of the total variation of Score. If thisR2value is large enough to be accepted for the model,
then we could use N&S and Award to predict Score by Model 2. In this situation, N&S and Award would be the only two influential
indicators, such that the new R2value would be an even larger one.
Table 15. Stepwise regression models for world’s Top 500 universities in the 2013 ARWU
Model
Independent
variables
β coefficients t Significance R2
1
(Constant) 5.364** 18.446 0.000
0.872
N&S 0.865** 58.300 0.000
2
(Constant) 7.358** 33.309 0.000
0.938
N&S 0.602** 39.035 0.000
Award 0.284** 22.889 0.000
3
(Constant) 1.243** 4.176 0.000
0.971
N&S 0.434** 34.258 0.000
Award 0.302** 35.434 0.000
PUB 0.226** 23.839 0.000
4
(Constant) 1.326** 7.992 0.000
0.991
N&S 0.251** 28.041 0.000
Award 0.281** 58.833 0.000
PUB 0.213** 40.228 0.000
HiCi 0.211** 33.164 0.000
5
(Constant) 1.557** 17.803 0.000
0.998
N&S 0.229** 48.076 0.000
Award 0.226** 76.551 0.000
PUB 0.203** 72.688 0.000
HiCi 0.208** 62.230 0.000
Alumni 0.115** 35.960 0.000
6
(Constant) -0.006 -0.958 0.339
1.000
N&S 0.206** 804.079 0.000
Award 0.205** 1261.099 0.000
PUB 0.206** 1397.729 0.000
HiCi 0.205** 1164.732 0.000
Alumni 0.103** 608.046 0.000
PCP 0.103** 421.363 0.000
(1) Dependent variable: institutional total score (coded Score)
Table 16. Partial correlations of the stepwise regression models for world’s top 500 universities
in the 2013 ARWU
Model Other Variables Partial Correlation
1
Alumni .616
Award .717
HiCi .516
PUB .447
PCP .468
2
Alumni .406
HiCi .619
PUB .731
PCP .255
3
Alumni .492
HiCi .831
PCP .399
4
Alumni .851
PCP .653
5 PCP .999
Looking at the partial correlations in Table 16, among the four other variables in Model 2, PUB owns the largest partial correlation
(= 0.731), without the statistical effect of N&S and Award on Score. Thus, PUB enters into Model 3 (in Table 15) after N&S and Award,
as the third independent variable, and increases the R2value by 0.033 (calculated by (1-0.938)x(0.731)2), such that theR2value for Model
3 in Table 15attains to 0.971 (calculated by 0.938+0.033). Thus, by adding PUB into Model 2, it then becomes Model 3 where the total
variation of Score is explained with a 3.3% increase, such that Model 3 can explain 97.1% of the total variation of Score. If thisR2value is
accepted as large enough, then using N&S, Award and PUB could predict Score by Model 3. In this situation, N&S, Award and PUB
would be the only three influential indicators. Again, if a larger R2 value is preferred, we would then select one additional indicator from
the other three indicators, such that the new R2value would be a larger one.
To explore a larger value of R2, by the same method, adding the indicator HiCi to Model 3, which increases theR2 value by 0.020
(calculated by (1-0.971)x(0.831)2 ), such that the R2 value of Model 4 attains to 0.991 (calculated by 0.971+0.020). In this case,
theR2value of 0.991 is very close to 1, and it is to predict the dependent variable Score by independent variables N&S, Award, PUB and
HiCi, as HiCibeingthe fourth influential indicator.
Since the closer the R2 value is to 1, the better fitting the model is, adding Alumni into Model 4 after N&S, Award, PUB and HiCi
almost 1. Thus, it is to say that Model 5 is very well fitted to predict the dependent variable Score by independent variables N&S, Award,
PUB, HiCi and Alumni, as Alumni being the fifth influential indicator.
In Model 6, the R2 value attains to 1, which is consistent in theory, as all of the coefficients of the six variables in Model 6 are very
close to the assigned weights of the ARWU indicators. However, the sixth indicator (i.e., PCP) might not be as “influential” as the other
indicators, as it has raised some concerns. Furthermore, without obtaining the numbers of full-time equivalent academic staff for all
comparative institutions due to difficulty or unavailability, this would lead to an inconsistent comparison of the global competition. Thus,
for that reason, wehave excluded Model 6from our analysis.
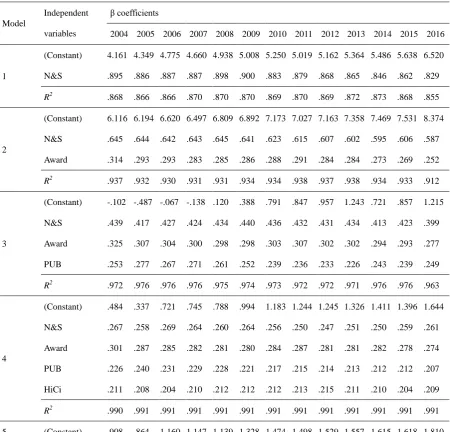
After conducting similar stepwise regression analyses for each ranking year from 2004 to 2016, we constructed stepwise
regression models from 2004 to 2016, as shown in Table 17.Table 17 reveals that the R2values of each ranking year from 2004 to 2016 for
each model are all very close.
Table 17. Stepwise regression models and their corresponding R2 values from 2004 to 2016 for world’s top 500
Model
Independent
variables
β coefficients
2004 2005 2006 2007 2008 2009 2010 2011 2012 2013 2014 2015 2016
1
(Constant) 4.161 4.349 4.775 4.660 4.938 5.008 5.250 5.019 5.162 5.364 5.486 5.638 6.520
N&S .895 .886 .887 .887 .898 .900 .883 .879 .868 .865 .846 .862 .829
R2 .868 .866 .866 .870 .870 .870 .869 .870 .869 .872 .873 .868 .855
2
(Constant) 6.116 6.194 6.620 6.497 6.809 6.892 7.173 7.027 7.163 7.358 7.469 7.531 8.374
N&S .645 .644 .642 .643 .645 .641 .623 .615 .607 .602 .595 .606 .587
Award .314 .293 .293 .283 .285 .286 .288 .291 .284 .284 .273 .269 .252
R2 .937 .932 .930 .931 .931 .934 .934 .938 .937 .938 .934 .933 .912
3
(Constant) -.102 -.487 -.067 -.138 .120 .388 .791 .847 .957 1.243 .721 .857 1.215
N&S .439 .417 .427 .424 .434 .440 .436 .432 .431 .434 .413 .423 .399
Award .325 .307 .304 .300 .298 .298 .303 .307 .302 .302 .294 .293 .277
PUB .253 .277 .267 .271 .261 .252 .239 .236 .233 .226 .243 .239 .249
R2 .972 .976 .976 .976 .975 .974 .973 .972 .972 .971 .976 .976 .963
4
(Constant) .484 .337 .721 .745 .788 .994 1.183 1.244 1.245 1.326 1.411 1.396 1.644
N&S .267 .258 .269 .264 .260 .264 .256 .250 .247 .251 .250 .259 .261
Award .301 .287 .285 .282 .281 .280 .284 .287 .281 .281 .282 .278 .274
PUB .226 .240 .231 .229 .228 .221 .217 .215 .214 .213 .212 .212 .207
HiCi .211 .208 .204 .210 .212 .212 .212 .213 .215 .211 .210 .204 .209
R2 .990 .991 .991 .991 .991 .991 .991 .991 .991 .991 .991 .991 .991
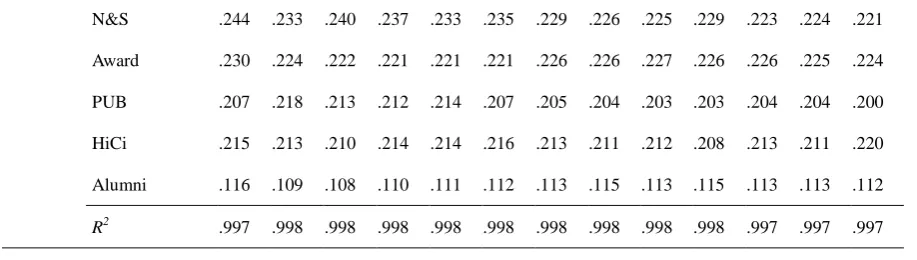
N&S .244 .233 .240 .237 .233 .235 .229 .226 .225 .229 .223 .224 .221
Award .230 .224 .222 .221 .221 .221 .226 .226 .227 .226 .226 .225 .224
PUB .207 .218 .213 .212 .214 .207 .205 .204 .203 .203 .204 .204 .200
HiCi .215 .213 .210 .214 .214 .216 .213 .211 .212 .208 .213 .211 .220
Alumni .116 .109 .108 .110 .111 .112 .113 .115 .113 .115 .113 .113 .112
R2 .997 .998 .998 .998 .998 .998 .998 .998 .998 .998 .997 .997 .997
Dependent Variable: Score
3.
Modified stepwise regression models
With our findings in the stepwise regression analyses, we constructed stepwise regression models as presented in the previous
section in attempt to simplify the ARWU scoring methodology. Of the five models throughout the ranking years from 2004 to 2016 in
Table 17, Models 3, 4 and 5 have the higher R2 values, which are all very close to 1; Model 5 has the highest R2 values, followed by
Model 4 and then Model 3.
Model 5 shows very high R2 values from 2004 to 2016, which are all very close to 1 (0.997 or 0.998). This indicates that Model 5,
with the statistical effects of five of the six indicators as independent variables, is adequate to replace the ARWU scoring formula, which
is composed of six indicators and can be written as follows (before normalizing the highest value to 100):
Score = 0.1 Alumni + 0.2 Award + 0.2 HiCi + 0.2 N&S + 0.2 PUB + 0.1 PCP.
Since the score obtained from the above convex combination would need to be normalized for the top scoring university to have a
score of 100 (based on the ARWU methodology), the constant items in Model 5 (in Table 17) from 2004 to 2016 would then be deducted
in the recalculation and reformulation of Score; thus, the constant items are dropped from Table 17. Because the total weight in a convex
combination is 1, we divided all β coefficients from the ranking year 2004 to 2016by the total weight of the same column in Table 18,
which resulted in the modified Model 5 in Table 19,where each individual indicator has almost the same weight throughout all the
ranking years;e.g., N&S has weights of 0.23 and 0.24 with a mode of 0.23;Award has weights of 0.22 and 0.23 with a mode of 0.23; PUB
has weights of 0.20, 0.21 and 0.22 with a mode of 0.21;HiCi has weights 0.21, 0.22 and 0.23 with a mode of 0.22, and Alumni has
weights 0.11 and 0.12 with a mode of 0.11. Based on maximum likelihood estimations, modes of the weights are assigned as the modified
weights. Hence, we can replace the original ranking methodology with the modified stepwise regression Model 5 as follows:
Score = 0.23 N&S +0.23 Award +0.21 PUB + 0.22HiCi + 0.11 Alumni.
Furthermore, with only five indicators in Model 5, as PCP is excluded from the set of indicators, the bias of an inconsistent comparison
Table 18. Stepwise regression model 5 without Constant from 2004 to 2016 for world’s top 500 universities
Model5
Independent
variables
β coefficients
2004 2005 2006 2007 2008 2009 2010 2011 2012 2013 2014 2015 2016
N&S .244 .233 .240 .237 .233 .235 .229 .226 .225 .229 .223 .224 .221
Award .230 .224 .222 .221 .221 .221 .226 .226 .227 .226 .226 .225 .224
PUB .207 .218 .213 .212 .214 .207 .205 .204 .203 .203 .204 .204 .200
HiCi .215 .213 .210 .214 .214 .216 .213 .211 .212 .208 .213 .211 .220
Alumni .116 .109 .108 .110 .111 .112 .113 .115 .113 .115 .113 .113 .112
Total weight 1.012 .997 .993 .994 .993 .991 .986 .982 .980 .981 .979 .977 .977
Dependent Variable: Score
Table 19. Modified Stepwise regression model 5 from 2004 to 2016 for world’s top 500 universities
Model 5
Independent
variables
β coefficients
2004 2005 2006 2007 2008 2009 2010 2011 2012 2013 2014 2015 2016
N&S 0.24 0.24 0.24 0.24 0.23 0.24 0.23 0.23 0.23 0.23 0.23 0.23 0.23
Award 0.23 0.22 0.22 0.22 0.22 0.22 0.23 0.23 0.23 0.23 0.23 0.23 0.23
PUB 0.21 0.22 0.22 0.21 0.22 0.21 0.21 0.21 0.21 0.21 0.21 0.21 0.20
HiCi 0.21 0.21 0.21 0.22 0.22 0.22 0.22 0.21 0.22 0.21 0.22 0.22 0.23
Alumni 0.11 0.11 0.11 0.11 0.11 0.11 0.11 0.12 0.11 0.12 0.11 0.11 0.11
Total weight 1 1 1 1 1 1 1 1 1 1 1 1 1
Dependent Variable: Score
Model 4 has the next highestR2 values from 2004 to 2016, which are all very close to 1 (0.990 in 2004, 0.991 in others). This
indicates that Model 4 (with oneindicator lessthan Model 5; Alumni) can also be used to replace the original scoring formula. Model 4
also does not include the indicator PCP, indicating that the modified methodology would be less biased, as discussed earlier. Since the
scores are to be normalized to the highest score of 100 after being obtained by the convex combination, by the same notion, the constant
items in Model 4 (in Table 17) from 2004 to 2016 are also dropped, and the results are shown in Table 20. Again, because the total weight
in a convex combination is 1, all β coefficients were divided by the total weight of the same column in Table 20. The modified Model 4
is presented as Table 21, where each individual indicator has almost the same weight throughout the ranking years 2004 to 2016, e.g.,
N&S has weights of 0.26 and 0.27 with a mode of 0.27;Award has weights of 0.29 and 0.30 with a mode of 0.29; PUB has weights of 0.22,
0.23 and 0.24 with a mode of 0.22;HiCi has weights of 0.21 and 0.22 with a mode of 0.22.Thus, we can replace the original ranking
methodology with the modified stepwise regression Model 4 as follows:
Table 20. Stepwise regression model 4 without Constants from 2004 to 2016 for world’s top 500 universities
Model 4
Independent
variables
β coefficients
2004 2005 2006 2007 2008 2009 2010 2011 2012 2013 2014 2015 2016
N&S .267 .258 .269 .264 .260 .264 .256 .250 .247 .251 .250 .259 .261
Award .301 .287 .285 .282 .281 .280 .284 .287 .281 .281 .282 .278 .274
PUB .226 .240 .231 .229 .228 .221 .217 .215 .214 .213 .212 .212 .207
HiCi .211 .208 .204 .210 .212 .212 .212 .213 .215 .211 .210 .204 .209
Total weight 1.005 .993 .989 .985 .981 .977 .969 .965 .957 .956 .954 .953 .951
Dependent Variable: Score
Table 21. Modified Stepwise regression model 4 from 2004 to 2016 for world’s top 500 universities
Model 4
Independent
variables
β coefficients
2004 2005 2006 2007 2008 2009 2010 2011 2012 2013 2014 2015 2016
N&S 0.27 0.26 0.27 0.27 0.27 0.27 0.27 0.26 0.26 0.26 0.26 0.27 0.27
Award 0.3 0.29 0.29 0.29 0.29 0.29 0.29 0.3 0.3 0.3 0.3 0.29 0.29
PUB 0.22 0.24 0.23 0.23 0.23 0.22 0.22 0.22 0.22 0.22 0.22 0.22 0.22
HiCi 0.21 0.21 0.21 0.21 0.21 0.22 0.22 0.22 0.22 0.22 0.22 0.22 0.22
Total weight 1 1 1 1 1 1 1 1 1 1 1 1 1
Dependent Variable: Score
Model 3 also owns high R2 values, between 0.963 and 0.976 (all very close to 1) from 2004 to 2016, which means that Model 3
(with two indicators fewer than Model 4; HiCi and Alumni) can also be used to replace the original scoring formula. Model 3 is also less
biased without the indicator PCP. For the same reason as discussed in Model 4 and 5, we can also dropped the constant items in Model 3
from 2004 to 2016, and the results are shown in Table 22. By applying the same rules, all β coefficients from 2004 to 2016were divided
by the total weight of the same column in Table 22,resulting in the modified Model 3 as seen in Table 23, where each individual indicator
has similar weights throughout the ranking years, e.g., N&S has weights of 0.42, 0.43,0.44 and 0.45 with a mode of 0.43;Award has
weights of 0.30, 0.31 and 0.32 with a mode of 0.31; PUB has weights of 0.24, 0.25, 0.26 and 0.27, with modes of 0.24 and 0.27, and an
Table 22. Stepwise regression model 3 without Constants from 2004 to 2016 for world’s top 500 universities
Model 3
Independent
variables
β coefficients
2004 2005 2006 2007 2008 2009 2010 2011 2012 2013 2014 2015 2016
N&S .439 .417 .427 .424 .434 .440 .436 .432 .431 .434 .413 .423 .399
Award .325 .307 .304 .300 .298 .298 .303 .307 .302 .302 .294 .293 .277
PUB .253 .277 .267 .271 .261 .252 .239 .236 .233 .226 .243 .239 .249
Total weight 1.017 1.001 .998 .995 .993 .99 .978 .975 .966 .962 .95 .955 .925
Dependent Variable: Score
Table 23. Modified Stepwise regression model 3 from 2004 to 2016 for world’s top 500 universities
Model 3
Independent
variables
β coefficients
2004 2005 2006 2007 2008 2009 2010 2011 2012 2013 2014 2015 2016
N&S 0.43 0.42 0.43 0.43 0.44 0.44 0.45 0.44 0.45 0.45 0.43 0.44 0.43
Award 0.32 0.31 0.3 0.3 0.3 0.3 0.31 0.32 0.31 0.31 0.31 0.31 0.3
PUB 0.25 0.27 0.27 0.27 0.26 0.26 0.24 0.24 0.24 0.24 0.26 0.25 0.27
Total weight 1 1 1 1 1 1 1 1 1 1 1 1 1
Dependent Variable: Score
Thus, we can replace the original ranking methodology with the modified stepwise regression Model 3 as follows:
Score = 0.43 N&S +0.31Award +0.26 PUB
Although the R2 values in Model 2 (from 0.912 to 0.938) and Model 1 (from 0.855 to 0.873) are high, they are considered not high
enough to build good evaluation models.
4.
Empirical study
We conducted an empirical study where we tested the three modified stepwise regression models that had the highest R2 values,
namely Model 3, Model 4 and Model 5, and compared the results with the actual outcomes from ranking years 2004 to 2016. The results
of 2004 to 2006 are shown in Figures 1; Figure 2 shows the 2007 to 2009 results; Figure 3 has the 2010 to 2012 results; Figure 4 presents
the 2013 to 2015 results; and Figure 5 is the results of 2016. Each graph in Figures 1 to 5 shows the placements of the actual scores
(coded total score; the blue curve) and the scores produced by the three modified models of ranks 1 to 500 in each year from 2004 to
Figure 1. Scores of modified Models 3, 4 and 5 with the actual scores of ranks 1 to 500 from 2004 to 2006
Each column in Figures 1 to 5 indicates the outcomes of one of the three models with the actual scores throughout the ranking
years. The first column of each figure shows the scores of Model 3 in green; the second column shows the scores of Model 4 in orange;
generated curves that fall closely to the curves of the actual scores throughout the ranking years.
Figure 2. Scores of modified Models 3, 4 and 5 with the actual scores of ranks 1 to 500 from 2007 to 2009
Moreover, each row in Figures 1 to 5 presents the actual scores and the outcomes of the three models in each of the ranking year.
shows all of the outcomes of 2005; the third row shows the outcomes of 2006.Examining the curves generated by the three models in
each row of each figure, it reveals that the curves of Model 5 have better uniformity with the curves of the actual scores than the curves
of Model 4 and Model 3. Thus, we can conclude that our stepwise regression models produce very similar score outcomes when
Figure 3. Scores of modified Models 3, 4 and 5 with the actual scores of ranks 1 to 500 from 2010 to 2012
Figure 5. Scores of modified Models 3, 4 and 5 with the actual scores of ranks 1 to 500 in 2016
5.
Discussion and Conclusion
Research performance is the core factor that drives the global competition of universities in the current major world rankings of
universities. The research indicators in the QS World University Rankings (academic reputation and citation per faculty) make up 60% of
its total weights; it is also a total of 60% weight for the World University Rankings (research and citation). Although there are only two
indicators (N&S and PUB, a total of 40% weight) that measure ARWU’s “research output,” the Alumni, Staff and HiCi indicators all
relate closely to and are heavily influenced by the quality and the quantity of research. Thus, it is fair to say that five of the six indicators
are all research-based and account for 90% of the weights in ARWU. As Zitt and Filliatreau [8] have pointed out, the ARWU focuses
mostly on the research dimension of universities, and therefore, relies heavily on bibliometric indicators. The data used in the ARWU for
its bibliometric indicators are collected from six sources, as shown in Table 24.
Table 24. ARWU indicators and data sources
Indicator Data Source
Nobel laureates http://nobelprize.org/
Fields Medals http://www.mathunion.org/index.php?id=prizewinners
Highly cited researchers http://www.highlycited.com/
Papers published in Nature and
Science
http://www.webofknowledge.com/
Articles indexed in Science
Citation Index-Expanded
and Social Science Citation
Index
http://www.webofknowledge.com/
Others (i.e., PCP) Number of academic staff. Data is obtained from national agencies such as
National Ministry of Education, National Bureau of Statistics, National
Source:ARWU [1]
The integrity and the continuity of these bibliometric data depend on whether the ranking is reasonable in its methodology and
outcomes, and consequently, determine if the rankings could sustain. In the ARWU, the data sources for its indicator PCP might be
problematic, as the numbers of academic staff of an institution cannot be obtained in some circumstances or countries, thus it is difficult
to find the numbers of full-time equivalent academic staff for all comparative institutions. The ARWU methodology only lists countries
of institutions that have the numbers of full-time equivalent academic staff; countries of institutions without the data are thus not listed.
The differences of data source for the sixth indicator PCP would likely lead to an inconsistent comparison. To overcome the
inconsistency that PCP might cause in the global competition, the proposed modified stepwise regression Models 3,4 and 5 can replace
the ARWU scoring methodology, where PCP is dropped. For simplicity of the modified methodology, the order is Model 3 (with three
indicators), Model 4 (with four indicators) and Model 5 (with five indicators). Based on our findings, for goodness of fit, we conclude
that Model 5 (with R2 values of 0.997~0.998) is better than Model 4 (with R2 values of 0.990~0.991), which is better than Model 3 (with
R2 values of0.963~0.976). Furthermore, the new scoring formulas generated from modified stepwise regression Models 3, 4 and 5 are all
adequate to replace the original scoring formula; as it is shown in our empirical study that the modified scoring formulas all produce very
similar results when compared with the original outcomes. Our findings indicate that the original formula, composed of the six indicators
and their respective weights in the ARWU methodology, can be simplified and still produce similar outcomes and significance.
REFERENCES
[1] ARWU. (2004 – 2016). Academic Ranking of World Universities 2004 – Academic Ranking of World Universities 2016.
Retrieved from http://www.shanghairanking.com/ARWU2004.html – http://www.shanghairanking.com/ARWU2016.html
[2] Billaut, J.-C., Bouyssou, D. &Vincke, P.(2010). Should you believe in the Shanghai ranking? Scientometrics, 84(1), 237–263.
[3] Dehon,C., McCathie, A.&Verardi, V. (2010). Uncovering excellence in academic rankings: a closer look at the Shanghai ranking.
Scientometrics, 83(2), 515–524.
[4] Liu, N. C. (2009). The Story of Academic Ranking of World Universities. International Higher Education, 54(Winter), 2–3.
[5] Liu, N. C.& Cheng, Y. (2005). Academic ranking of world universities - methodologies and problems.Higher Education in
Europe,30(2), 127–136.
[6] Luque-Martínez, T. &del Barrio-García, S.(2016). Constructing a synthetic indicator of research activity. Scientometrics, 108(3),
1049–1064.
[7] Marginson, S. (2017). Do Rankings Drive Better Performance? International Higher Education, 89(Spring), 6–8.
[8] Zitt, M. &Filliatreau, G. (2007). Big is (made) Beautiful: Some comments about the Shanghai ranking of world-class universities.
In J. Sadlack, & N. C. Liu (Eds.), The World Class University and Ranking: Aiming beyond Status (141–160). Romania: