ISSN-L: 2501 - 1235 Available on-line at: www.oapub.org/edu
doi: 10.5281/zenodo.3237254 Volume 5 │ Issue 9 │ 2019
THE SOLUTION TO IMPROVE THE EFFECTIVENESS OF
PHYSICAL EXAMINATION AND EVALUATION FOR STUDENTS OF
HCMC UNIVERSITY OF TECHNOLOGY AND EDUCATION
Nguyen Duc Thanh1i, Trinh Phuoc Thanh2
1PhD, Vice Manager of Physical and
Defense Education Center, University of Technical Education, Ho Chi Minh City, Vietnam
2MA, Lecturer,
The Training Center for General Knowledge, Thu Dau Mot University, Vietnam
Abstract:
On the basis of studying the status of physical examination and evaluation of students of the HCMC University of Technology and Education, the topic investigated the level of satisfaction of students and lecturers and investigated the causes. From there, the research propose some feasible solutions to improve this activity.
Keywords: evaluation, physical education, examination, students, HCMUTE
1. Introduction
Physical education is one of the important subjects in the general training program with the role of creating a class of people who not only have new knowledge, are capable, have political qualities but also have abundant health to meet professional requirements. Therefore, in order to contribute to improving the quality of training in universities, along with the renovation, improvement of training programs, contents and methods, it is necessary to reform the physical examination and evaluation forms of student.
Resolution 29 has been approved by the 8th Central Conference on November 4, 2013, indicating: "fundamentally innovating the form and method of examination, examining and evaluating the results of education, training and protection to be honest and objective”. In addition, "Education development strategy 2011 - 2020" also stated that one of the shortcomings and weaknesses of Vietnamese education in the past period is "content of
the program and teaching and learning methods, work Exams, tests and evaluations are slowly being renewed”.
HCMC University of Technology and Education is a multidisciplinary, multi-disciplinary university in the direction of career - application, in which a number of training areas are oriented to research and development. The school is managed and managed according to ISO 9001: 2000. With a scale of more than 20,000 people studying in the system, but the work of physical examination and evaluation of the students is still not regulated; There is no standard to specifically evaluate students' physical capacity on a yearly basis; There are also no surveys and serious studies on the organization of physical examination and evaluation of learners of this subject. From the above reasons, we would like to implement the topic: "Research on solutions to improve the effectiveness of student physical examination and evaluation at the HCMC University of Technology and Education". Research results will be the basis for evaluating the physical work of the annual students and the premise to adjust and improve the testing and evaluation methods for the benefit of the learners, contributing to improving public efficiency. school physical education.
2.Methods
2.1. Research objects
The research objects consist of 19 staffs, lecturers of the Physical Education Center - National Security and 300 male and female students, of non-specialized majors with normal physical health in HCMC University of Technology and Education, participating in physical education.
2.2. Proccess
The study was carried out from March, 2018 to March, 2019 at the HCMC University of Technology and Education.
2.3. Measuring tools
Common methods used in the process of researching include synthesizing and analyzing relevant document methods; observation method; sociological investigation method; statistical and calculation method.
Evaluation tools include: A. Likert scale - 5 levels
Interviewing two objects (students and lecturers) with 2 questionnaires based on Likert scale - 5 levels: Totally agree (5 points); Agree (4 points); Neutral (3 points); Disagree (2 points); Strongly disagree (1 point). In particular, the average value = (maximun - minimun) / n = (5 - 1) / 5 = 0.8.
Average Meaning
1,00 – 1,80 Strongly disagree
1,81 – 2,60 Disagree
2,61 – 3,4 Neutral
3,41 – 4,2 Agree
4,21 – 5,00 Totally agree
B. Reliability measurement using Cronbach’s Alpha coefficient
Cronbach’s Alpha coefficients (Cronbach, 1951) are the reliability coefficients used to test the correlation scale between observed pairs. This method is intended to help eliminate unreliable observed variables (with the coefficient of variation and total variables less than 0.3). In other words, if a measurement variable has a correlation coefficient of total variable (Corrected Item - Total Correlation) ≥ 0.3 then that variable is satisfactory (Source: Nunnally, J. (1978), Psychometric Theory, New York, McGraw-Hill). Cronbach’s Alpha coefficient has a variable value in range [0,1]. In theory, the higher the coefficient, the better (the higher the reliability scale). However, this is not entirely accurate. The Cronbach’s Alpha coefficient is too large (range from 0.95 or more) to show that there are many variables in the scale that do not differ at all, this phenomenon is called duplication in the scale.
Value of Cronbach’s Alpha coefficient:
From 0.8 to nearly 1: very good measurement scale. From 0.7 to nearly 0.8: good measurement scale. From 0.6 or more: qualified measurement scale.
For this research topic, the author accepted Cronbach’s Alpha coefficient ≥ 0.6. Note that the value of “If Item Deleted” column in Cronbach's Alpha, this column represents Cronbach's Alpha coefficient if the variable type is under consideration. Normally, it will be evaluated with the correlation coefficient of the total Corrected Item - Total Correlation, if the value of “If Item Deleted” is greater than the Cronbach’s Alpha coefficient and Corrected Item - Total Correlation < 0.3 then the type of observed variable is considered to increase the reliability of the scale.
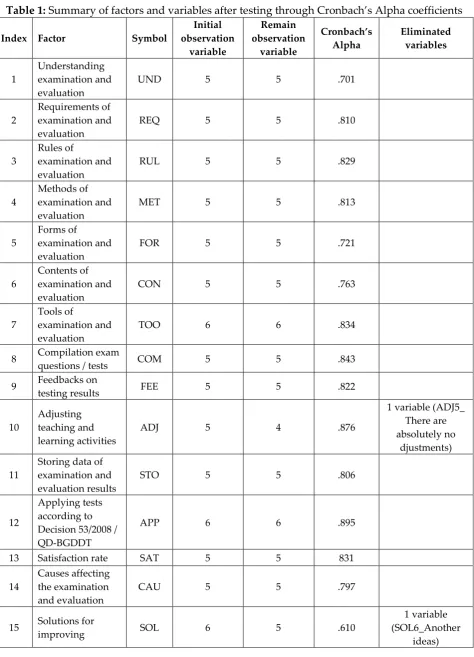
After examining the reliability of observed variables according to the criteria for evaluating physical education subjects in school by Cronbach’s Alpha coefficient, the results are shown in Table 1.
Table 1: Summary of factors and variables after testing through Cronbach’s Alpha coefficients
Index Factor Symbol
Initial observation variable Remain observation variable Cronbach’s Alpha Eliminated variables 1 Understanding examination and evaluation
UND 5 5 .701
2
Requirements of examination and evaluation
REQ 5 5 .810
3
Rules of
examination and evaluation
RUL 5 5 .829
4
Methods of examination and evaluation
MET 5 5 .813
5
Forms of
examination and evaluation
FOR 5 5 .721
6
Contents of examination and evaluation
CON 5 5 .763
7
Tools of
examination and evaluation
TOO 6 6 .834
8 Compilation exam
questions / tests COM 5 5 .843
9 Feedbacks on
testing results FEE 5 5 .822
10
Adjusting teaching and learning activities
ADJ 5 4 .876
1 variable (ADJ5_ There are absolutely no
djustments)
11
Storing data of examination and evaluation results
STO 5 5 .806
12
Applying tests according to Decision 53/2008 / QD-BGDDT
APP 6 6 .895
13 Satisfaction rate SAT 5 5 831
14
Causes affecting the examination and evaluation
CAU 5 5 .797
15 Solutions for
improving SOL 6 5 .610
1 variable (SOL6_Another
C. Chi square Indicator -2
The indicator is used to evaluate qualitative characteristics (identifiers, hierarchies, properties, categories ...) on frequencies that do not require standard probability distribution. In the research, we used this test to compare ideas of observing variables between students and faculty.
The most common form of inspection statistics is:
n
i E
E O
1
2
2 ( )
Where :
O is the observation frequency (measurement data) ; E is the theoretical frequency (exact predictive value) .
D. Accrediting hypothesis of the average value of two independent samples (independent samples t-test)
After surveying the observed variables tested by Cronbach's Alpha coefficient, the thesis in turn analyzes and evaluates the similarities between students and lectures by conducting hypotheses about the average value of 2 independent samples (Independent Samples T-Test).
In Independent-samples T-test, we need to rely on the test of the equality of the two general variances (Levene’s test). The variance describes the uniformity or unevenness (dispersion) of observed data.
If value Sig. in Levene’s test (F-test) <0.05, the variance of the 2 different integers uses t-test results in Equal variances not assumed.
If Sig. ≥ 0.05, the variance of the 2 different integers is the same, then use the test results in Equal variances assumed.
If Sig. of t-test ≤ α (significance level), there is a significant difference in the average of the two integers and vice versa.
3. Results
3.1. Status of physical examination and evaluation at HCMC University of Technology and Education
After completing the evaluation tool, the topic proceeds to collect and process data according to each specific standard:
Understanding of lectures and students about the meaning and role of physical examination and evaluation
Table 2: Lectures' understanding (n = 19) and students (n = 300) on the meaning and role of physical education testing and evaluation
Criteria Object
Level (totally) agree
The level of hesitation and disagreement Comparing the same object Comparing 2 between teachers and students i
n % ni % 2 P (Value) (Sig)
UND1_ Needed to classify learners' qualifications
S 225 75 75 25 187.5 <0.001
2.11 .714
L 14 73.7 5 26.3 11.6 <0.001
UND2_ Accurately evaluate the health status of students
S 255 85.0 45 15.0 223.5 <0.001
12.29 .015
L 12 63.2 7 36.8 10.1 <0.01
UND3_ Basis for fair evaluation of the mobilization capacity of students
S 238 79.3 62 20.7 201.6 <0.001
4.24 .374
L 13 68.4 6 31.6 10.7 <0.01
UND4_ Determining professional
achievements and encouraging students to rise in learning and training
S 229 76.3 71 23.7 191.6 <0.001
2.21 .697
L 13 68.4 6 31.6 10.7 <0.01
UND5_ Created competitive environment in students
S 190 63.3 11 36.7 160.6 <0.001
3.69 .448
L 14 73.7 5 26.3 11.6 <0.001
The interview results are presented in Table 2: 75% of students understand that physical examination and evaluation is necessary to classify learners' qualifications; 85% of students are aware that this work helps to accurately evaluate the health status of students; 79.3% of students said that it is the basis of fair evaluation of the mobilization capacity of students; 76.3% of students said that it will determine professional achievements and encourage students to rise in learning and training; 63.3% of students understand that they will create competition in students.
Comparing the observation of the observed variables in the same student object, the level (totally) agreed to prevail over the level of hesitation and disagreement. This is
clearly shown through the
2
indicator always >2
Chart 1: Comparison of lectures' s average knowledge values (n = 19) and students (n = 300) on the meaning and role of physical education examination and evaluation
Comparative identification of observed variables between students and lectures found that, in addition to the Ud2 variable, it helps to accurately evaluate the health status of students (there are statistical differences with P <0.05), the remaining 4 variables are all There is a similarity in the level of understanding the meaning and role
of physical education examination and evaluation. This is clearly shown through the
2
indicator always <
2
tables (the difference is not statistically significant with Sig> .05).
This is even more apparent when comparing
x
observed variables between students and lectures through the t student indicator. Research results in table 3 and Chart 1 also show that observed variables are highly appreciated by students and lectures. The average value (x
) of the observed variables ranged from 3.76 - 4.21, in which the criteria that were most appreciated by students were "UND2_Help accurately evaluate student health" withx
= 4.21 ... lowest is the criteria "UND5. Create competition in students" withx
= 3.76. It can be seen that there is nox
difference of observed variables between lectures and students (Sig = .015 ~ .714> .05).Table 3: Comparative understanding of lecturers (L) and students (S) on the meaning and role of physical examination and evaluation
Criteria Object
Levene's Test for Equality of
Variances (Mean)
+ SD (Std. Deviation) (Std Error Mean)
t Sig. (2- tailed)
N F Sig.
UND 1_ Needed to classify learners' qualifications
S 300
.038 .846 3.99 .968 .056 -.493 .622
L 19 4.11 .809 .186
UND 2_ Help accurately evaluate student health
S 300
.149 .700
4.21 .878 .051
1.80 .073
L 19 3.84 .765 .175
UND 3_ Basis for fair evaluation of the mobilization capacity of students
S 300
.026 .871
4.05 .927 .054
.245 .807
L 19 4.00 .816 .187
UND 4_ Determining professional achievements and encouraging students to rise in learning and training
S 300
.000 .987
4.09 .914 .053
.158 .875
L 19 4.05 .848 .195
AH5_ Created competitive environment in students
S 300
.836 .361
3.76 1.03 .060
-1.645 .101
L 19 4.16 .834 .191
Thus, both lectuurers and students have a good understanding and a high consensus on the meaning and role of physical education and evaluation in all 5 variables observed with
x
= 3.76 ~ 4.21 (in the range of scales from Agree to Totally agree).Similar analysis recorded:
A.Current situation of ensuring the requirements of physical education examination and evaluation
Both lectures and students have a high consensus on the requirements of physical education examination and evaluation. Those are the requirements for: Recreating physical education knowledge; Train skills and movement skills; Developing cognitive and creative thinking capabilities; Creating the attitude and behavior of students for the subject; Train students to detect and solve problems with
x
= 3.53 ~ 4.22 (in the range of scales from Agree to Totally agree).B. Current situation of ensuring the principles of physical education examination and evaluation
Lectures and students have a high consensus on the requirements of physical education examination and evaluation. Those are the requirements for: Recreating physical education knowledge; Train skills and movement skills; Developing cognitive and creative thinking capabilities; Creating the attitude and behavior of students for the subject; Train students to detect and solve problems with
x
= 3.53 ~ 4.22 (in the range of scales from Agree to Totally agree).Chart 3: Comparison of average value ensures the principles of physical education examination and evaluation between lectures (n = 19) and students (n = 300)
C. Current situation of using physical examination and evaluation methods for students
Chart 4: Comparison of the average value of actual situation using the methods of physical examination and assessment of students
D. Current situation of using physical examination and evaluation forms for students Up to 35.7% of students evaluate that some lectures still use unified evaluation forms. However, both lectures and students have a high consensus on two forms of conducting physical education examination and evaluation, which are: periodic evaluation and summation evaluation. Other forms are rarely used.
x
= 2.16 ~ 4.42 (in the range of scales extending from Disagree to Totally agree).Chart 5: Comparison of the average value of actual use of physical examinationand evaluation forms of students
E. Current situation of students' physical examination and evaluation contents
Comparing the observed variables in the same student object, the level (totally) agrees to be more dominant than the level of hesitation and disagree in 4 contents: General
>
2
tables (the difference is statistically significant with P <0.001). Particularly, psychological level of hesitation and disagreement prevails more than the (totally) agreed level. This result is quite close to the reality of teaching physical education at the University (not specialized in sports) so it does not pay much attention to psychological and tactical issues in training and sports competitions.
Chart 6: Comparison of average value of actual use of physical examination and evaluation contents of students
E. The tools used to examine and evaluate physical education
In general, students and lectures evaluated quite differently on the 6 observed variables,
x
= 2.79 ~ 4.58 (in the range of scales stretching from Neutral to Totally agree).However, there is a high consensus about the popular tools are used to examine and evaluate physical education are physical education tests.
F. Compilating and publishing exam questions for physical education examination and evaluation
Both lectures and students have a high consensus on the compilation and preparation of physical education tests and assessments towards: Keeping abreast of professional knowledge; Associated with skills to be trained and taught; Pay attention to learning attitudes; Check and evaluate for the progress of learners.
x
= 3.74 ~ 4.37 (in the range of scales extending from Agree to Totally agree).Chart 8: Comparison of the average value of the situation of compilating, publishing of tests for physical education examination and evaluation
G. Analyzing and processing examination and evaluation results, giving a feedback to students
Evaluation of students and lectures is quite different in terms of 5 observed variables,
x
= 1.74 ~ 4.16 (in the range of scales extending from Strongly disagree to TotallyChart 9: Comparison of the average status of the analysis and processing of test results and giving a feedback to students
H. Using the results of students' physical examination and assessment to adjust teaching and learning activities
Evaluation of students and lectures has some differences in 5 observed variables,
x
= 3.37 ~ 4.16 (in the range of scales extended in the Agreed level). However, there is a high consensus among them that the use of students' physical examination and evaluation results to adjust the course content and teaching methods as well as adjust the content and form of examination.I. Store data of physical education examination and evaluation
Students and lectures evaluated quite differently on 5 observed variables,
x
= 2.58 ~ 4.32 (in the range of scales extending in Neutral to Totally agree level). However, through analysis and comparison, both lectures and students have a high consensus when they think that the archiving of test data and evaluation of physical education is mainly through record books.Chart 11: Comparison of the average value of storing data of physical education examination and evaluation
J. Applying tests to examine and evaluate student fitness according to Decision 53/2008/QD-BGDDT
Through analysis and comparison, both lectures and students have consensus on the application of 6 tests to examine and evaluate students' fitness according to Decision 53/2008/QD-BGDDT. Both students and lectures highly appreciate all 6 observed variables,
x
= 3.21 ~ 4.68 (in the scale of Agree and Totally agree).3.2. Satisfaction and causes affecting the inspection and assessment of physical education
3.2.1. Satisfaction of students and lectures for physical education examination and evaluation
Survey of students' satisfaction with physical education examination and evaluation is conducted through 5 factors, corresponding to 5 comments in the questionnaire.
Comparing
x
observed variables on the satisfaction level of lectures and students on the examination, assessing physical education through t student index, found that: There is no significant difference between the opinions of students and lectures (Sig = .081 - .893> .05). Overall, both students and lectures highly appreciated all 5 observed variables,x
= 3.84 ~ 4.25 (in the range of scales from Agree to Totally agree).Therefore, through analysis and comparison, both lectures and students have a high consensus on the level of satisfaction with the inspection and assessment of physical education, namely: Ensuring objectivity, comprehensive, systematic, publicity, development (highest); Next is the qualifications of lectures; Conditions of facilities and equipment for examination and evaluation; Serious, friendly and proper attitude of lectures; Obtain physical and mental benefits after participating in the subject.
Table 4: Comparison of satisfaction level on physical examination and evaluation of students
Criteria Object N
Levene's Test for Equality of
Variances (Mean)
x
+ SD (Std. Deviation) (Std Error Mean)
t Sig. (2- tailed)
F Sig.
SAT1_ Ensuring objectivity, comprehensive, systematic, publicity, development
S 300
.046 .831
4.25 .767 .044
.777 .438
L 19 4.11 .809 .186
SAT2_ Professional qualifications of lectures
S 300
5.231 .023 4.17 .749 .043 1.247 .228
L 19 3.84 1.119 .257
SAT3_ Conditions of facilities and equipment for examination and evaluation
S 300
1.510 .220
3.94 .978 .056
1.753 .081
L 19 3.53 1.172 .269
SAT4_ Serious, friendly and proper attitude of lectures
S 300
1.222 .270 4.09 .753 .043 1.098 .273
L 19 3.89 .937 .215
SAT5_ Obtain physical and mental benefits after participating in the subject
S 300
.044 .834
3.97 .941 .054
-.135 .893
L 19 4.00 .882 .202
3.2.2. Causes affecting the examination and evaluation of physical education
components that constitute this work quality scale, there are also factors that are evaluated by students at a low level. Therefore, the next step is to understand the causes to improve the quality of physical education examination and evaluation.
Surveying the causes affecting the physical education examination and evaluation is conducted through 6 factors, corresponding to 5 comments in the questionnaire.
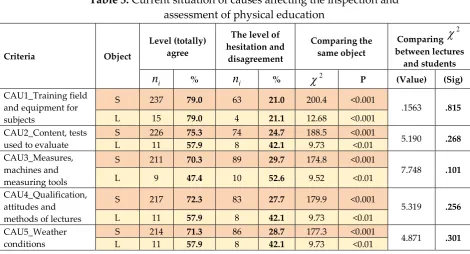
Interview results (appendices 1 and 2), presented in Table 5 are recorded, the percentage of students evaluating the causes of physical education examination and evaluation is as follows: CAU1_Training and equipment for subjects (79%); CAU2_Content, test used for evaluation (75.3%); CAU3_Measures, machines and measuring tools (70.3%); CAU4_Qualifications, attitudes and methods of lectures (72.3%); CAU5_Weather conditions (71.3%).
Comparing the observed variables in the same student object, the level (completely) agrees to be more dominant than the level of hesitation and disagreement in all 5 variables of the cause that affects the examination, evaluation physical
education. This is evident in the equilibrium
2
indicator > 2
tables (the difference is statistically significant with P <0.001). Meanwhile, except for variable CAU4, the remaining variables of lectures are similar to students (P <0.01 - 0.001).
Table 5: Current situation of causes affecting the inspection and assessment of physical education
Criteria Object
Level (totally) agree
The level of hesitation and disagreement Comparing the same object Comparing 2 between lectures and students i
n % ni % 2 P (Value) (Sig)
CAU1_Training field and equipment for subjects
S 237 79.0 63 21.0 200.4 <0.001
.1563 .815
L 15 79.0 4 21.1 12.68 <0.001
CAU2_Content, tests used to evaluate
S 226 75.3 74 24.7 188.5 <0.001
5.190 .268
L 11 57.9 8 42.1 9.73 <0.01
CAU3_Measures, machines and measuring tools
S 211 70.3 89 29.7 174.8 <0.001
7.748 .101
L 9 47.4 10 52.6 9.52 <0.01
CAU4_Qualification, attitudes and methods of lectures
S 217 72.3 83 27.7 179.9 <0.001
5.319 .256
L 11 57.9 8 42.1 9.73 <0.01
CAU5_Weather conditions
S 214 71.3 86 28.7 177.3 <0.001
4.871 .301
Chart 13: Comparison of average value of reasons affecting physical Education examination and evaluation
The comparison of observing the corresponding observed variables between the two students and lectures found that all 5 variables that are affected by the physical education examination and evaluation have similarities in the assessment. This is
evident in the 2 -indicator always < 2 tables (insignificant difference, not statistically significant with Sig = .101 - .815> .05).
Comparing
x
observed variables on the causes of testing, assessing physical education between students and lectures through t student indicator (Chart 13); There is a statistically significant difference (Sig = .000 - .020 <.05) in only variable CAU3_ Measures, machines and measuring tools, between opinions of students and lectures (Sig = .014 <.05 ); The remaining 4 variables have high similarity (Sig = .495 - .585> .05). However, overall, both students and lectures highly appreciated all 5 observed variables,x
= 3.32 ~ 4.26 (in the range of scales from Neutral to Totally agree).Thus, through analysis and comparison, both lectures and students have a high consensus when identifying the causes affecting the examination and evaluation of physical education are: training field and equipment for subjects (highest); Next is the Content, the test used to evaluate; Means, machinery and measuring tools; Qualifications, attitudes and methods of lectures; Weather conditions.
3.3. Solutions to improve the effectiveness of physical education examination and evaluation at HCMC University of Technology and Education
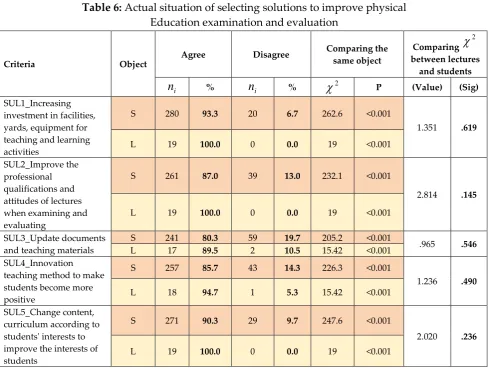
equipment for teaching - study (93.3%); SUL2_Improve the professional qualifications and attitudes of lectures when examining and evaluating (87%); SUL3_Update documents and teaching materials (80.3%); SUL4_Innovation teaching method to make students become more positive (85.7%); SUL5_Change content, curriculum according to students' interests to improve the interests of students (90.3%).
Table 6: Actual situation of selecting solutions to improve physical Education examination and evaluation
Comparing the observed variables in the same student object, the level (totally) agrees to be more dominant than the level of hesitation and disagreement in all 5 variables of the criteria to improve the effectiveness of the control work. physical education
examination and evaluation. This is evident in the
2
indicator always > 2
tables (the difference is statistically significant with P <0.001). Meanwhile, lectures' opinions are similar to students (P <0.001).
The comparison of the corresponding observed variables between the two students and lectures found that all 5 variables of the solution have similarities in the
evaluation opinions. This is evident in the 2 indicator always < 2 tables (insignificant difference, not statistically significant with Sig = .145 - .619> .05).
Criteria Object
Agree Disagree Comparing the
same object Comparing 2 between lectures and students i
n % ni % 2 P (Value) (Sig)
SUL1_Increasing investment in facilities, yards, equipment for teaching and learning activities
S 280 93.3 20 6.7 262.6 <0.001
1.351 .619
L 19 100.0 0 0.0 19 <0.001
SUL2_Improve the professional qualifications and attitudes of lectures when examining and evaluating
S 261 87.0 39 13.0 232.1 <0.001
2.814 .145
L 19 100.0 0 0.0 19 <0.001
SUL3_Update documents and teaching materials
S 241 80.3 59 19.7 205.2 <0.001
.965 .546
L 17 89.5 2 10.5 15.42 <0.001
SUL4_Innovation teaching method to make students become more positive
S 257 85.7 43 14.3 226.3 <0.001
1.236 .490
L 18 94.7 1 5.3 15.42 <0.001
SUL5_Change content, curriculum according to students' interests to improve the interests of students
S 271 90.3 29 9.7 247.6 <0.001
2.020 .236
Comparing
x
observed variables on satisfaction level of lectures and students on solutions to improve physical education assessment by t student indicator number 7 proved that: There is a differencex
means meaning Statistics between students' and lectures' opinions in SOL2_Improve the professional qualifications and attitudes of lectures when examining and evaluating (Sig = .000 <.05) and SOL5_Change content, curriculum according to students' interests to improve the interests of students (Sig = .000 <.05). However, with the remaining 3 solutions, there is no significant difference between the opinions of students and lectures (Sig = .121 - .246> .05). In general, both students and lectures highly appreciate all 5 observed variables,x
= .86 ~ 1.00 (in the scale close to the Agreed level).Thus, through analysis and comparison, both lectures and students have a high consensus on 5 options to choose solutions to improve the physical education examination and evaluation, in detail:
Increasing investment in facilities, yards, equipment for teaching and learning activities.
Improve the professional qualifications and attitudes of lectures when examining and evaluating.
Update documents and teaching materials.
Innovation teaching method to make students become more positive.
Change content, curriculum according to students' interests to improve the interests of students.
4. Conclusion
The research has an overview of the status of physical education at the HCMC University of Technology and Education; Designing measuring tools for physical education examination and evaluation for students of HCMC University of Technology and Education; with a Likert scale - 5 levels; Measuring reliability of observed variables with Cronbach’s Alpha coefficient; and finally using Hypothesis test of the average values of two independent models (independent samples t-test), finally synthesized 15 factors with 76 survey variables with high consensus of lectures and students.
The study has identified the causes affecting the inspection and evaluation due to:
Training field and equipment for subjects. Content, tests used to evaluate.
Measures, machines and measuring tools.
Qualifications, attitudes and methods of lectures. Weather conditions.
Increasing investment in facilities, yards, equipment for teaching and learning activities.
Improve the professional qualifications and attitudes of lectures when examining and evaluating.
Update documents and teaching materials.
Innovation teaching method to make students become more positive.
Change content, curriculum according to students' interests to improve the interests of students.
References
Ahmet Sadan Okmen (2017). Evaluation of the physical education and sports curriculum in Turkish schools, Academic Journals Vol. 12(16), pp. 811-816, 23 August, 2017.
A. I. Vroeijenstijn [Nguyen Hoi Nghia translated the original word: Improvement and Accountability: Navigating between Scyla and Charybdis, 1995] (2002), Improved higher education policy and social responsibility, National University Publishing House Ho Chi Minh City.
Alexander W. Astin [Nguyen Hoi Nghia et al. Translated from original: Assessment for excellence, American Council on Education, Series on Higher Education, Oryx Press, 1993] (2004). Quality assessment to achieve perfection, Publisher HCM City National University.
Ali Dursun Aydin (2015). Assessment of Communication Skills of Physical Education and Sport Students in Turkish Universities, Universal Journal of Educational Research 3(11): 943-948, 2015.
edTPA (2015). edTPA Physical Education Assessment Handbook, edTPA_PhysEd_05. George Kuh and Stanley Ikenberry (2009), More Than You Think, Less Than We Need:
Learning Outcomes Assessment in American Higher Education, National Institute for Learning Outcomes Assessment.
Grolund, N. E. (1982). Constructing achievement test, the University of Illinois.
Kathleen deMarrais (University of Georgia) - Stephen D. Lapan (Northern Arizona University) (2004), Foundations for Research Methods of Inquiry in Education and the Social Sciences, Lawrence Erlbaum Associates, Publishers, Mahwah, New Jersey London.
Metzler (2005). Assessing Student Learning in Model-Based Instruction. Instructional models for physical education. Scotsdale, Holcomb Hathaway.
Ministry of Education and Training (2008). Decision No. 53/2008 / QD-BGDDT dated September 18, 2008 Promulgating the Regulation on assessment and classification of physical strength of students
Ministry of Education and Training (2008). Decision No. 72/2008 / QD-BGDDT dated December 23, 2008 promulgating the Regulation on organizing extracurricular sports activities for students.
Nguyen Duc Chinh (2016). "Real assessment of academic results in higher education and human resource training", Hanoi National University.
Rebecca Cartwright, Ken Weiner, and Samantha Streamer-Veneruso (2009). Student Learning Outcomes (SLO) Assessment Handbook, Montgomery College.
SHAPE America – Society of Health and Physical Educators (2015), The Essential Components of Physical Education.
Prince Edward Island (2014). Department of Education and Early Childhood Development: Ped401a Samples Of Specific Assessment Tools.
The Central Committee of the Communist Party (2013), Resolution No. 29-NQ / TW dated November 1, 2013 on fundamental and comprehensive innovation of education and training ...
The Curriculum Development Council and The Hong Kong Examinations and Assessment Authority (2014). Physical Education Curriculum and Assessment Guide (Secondary 4 - 6).
Timothy Baghurst (2013). “How Physical Education Teachers Undermine the Profession by Grading Effort and Participation”, Oklahoma AHPERD Vol 50, Issue 3 2013. Victor C. X. Wang (2009). Assessing and Evaluating Adult Learning in Career and Technical
Education, California State University at Long Beach, USA.
Creative Commons licensing terms