FUNDAMENTALS OF TRAIN
DATA COMMUNICATIONS
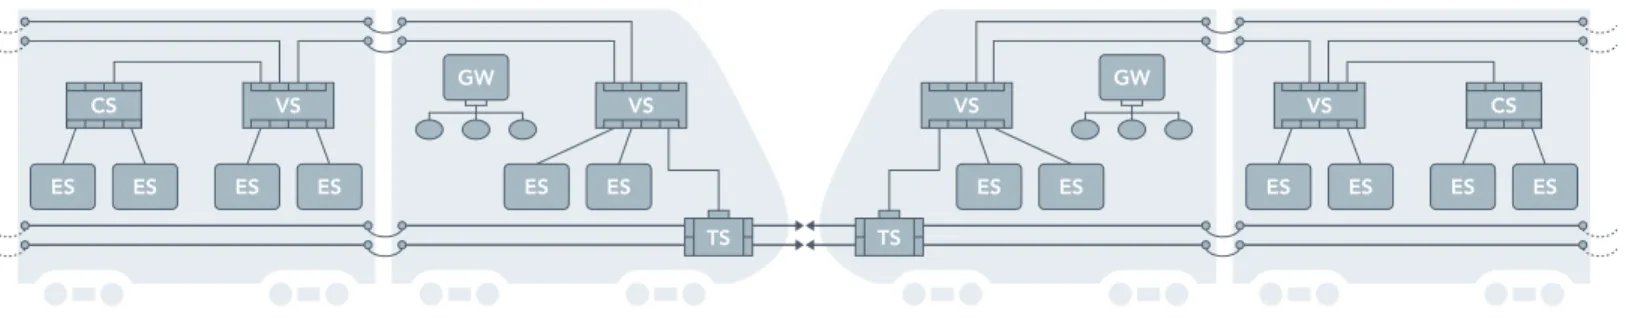
The Internet is built upon the back of Ethernet networks. The word topology is often used to describe the connectivity landscape in the same way that the word topography can be used to describe a geographic landscape. It is helpful to describe train topology, not in terms of the systems being monitored, but in the switches used to control the data flow. In North America, there are about 5,000 new switches placed on rail vehicles every year. On the average train, there are usually two or three types of switches.
The Cabling Switch (CS), the simplest of the group, is used as a hub into which subsystems, connected devices, or End Stations (ES), such as doors feed. Multiple ESs connect into one of these switches. These switches are unmanaged so are the least complex, and they are generally used as a convenience to consolidate groups of ESs so they can communicate with a reduced set of network cabling.
The Vehicle Switch (VS) is a managed switch that connects to multiple ESs and is the primary manager of communications within the Basic Operating Unit (BOU). The BOU can be defined
The Internet of Trains
| A Layman’s Guide
PART 1
Where does the data come from?
ABSTRACT
The Internet of Things touches everyone at some level. For example, most automobiles carry
electronics using millions of lines of code and are ready for mobile connectivity. The same is true
of passenger rail vehicles, where the average new car can generate twenty-five million records
per day. Public safety, passenger experience, and operational efficiency are the drivers that
determine excellence in rail transportation. Train data has the potential to change the game, and
it is crucial to have a solid understanding of how the data will be used. This knowledge will guide
how data will be managed, stored, analyzed, and presented to decision makers. Software tools
have evolved and are now available to help fleet operators achieve the excellence they desire
through smarter data management.
CS ES ES ES ES ES ES VS VS GW TS CS ES ES ES ES ES ES VS VS GW TS
INTRODUCTION
The Mercedes-Benz S-Class luxury car contains more than 100 electronic control units. These networked devices are used to monitor and control vehicle subsystems ranging from the airbags to the powertrain. It has been reported that the average car contains many million lines of code. In addition to making each subsystem work, the instruction set is dedicated to communications to ensure that all subsystems work in harmony. The information collected is then sent to the driver and to a storage device in the event that it might be needed to support vehicle maintenance or troubleshooting.
A passenger rail vehicle is no different. The added complexity of a train set is that many vehicles are connected together. Trains require car-to-car communication so the entire data stream is consolidated. While it is easy to visualize a train as a set of vehicles moving along in a straight line, the complex interconnections of all the subsystems are best described as a web, or perhaps many connected webs. Thus, it is no stretch to consider the concept of the Internet of Trains. To take it a step further, trains are assembled into fleets and if the fleet is connected to the wayside by Wi-Fi, it would indeed become part of the Internet.
Quester Tangent | The Internet of Trains | A Layman’s Guide Part 1 Where does the data come from? Page 2 as either a single car or married pair. The VS will usually have a
processor and software to manage the flow of data from each ES. With data traffic going in all directions, there is ample room for confusion. The VS acts like stoplights and arrows to provide timing and direction to the data traffic so it moves as efficiently as possible. For example, the VS will ensure certain packets with higher priority get handled first, keep some ports separated/ hidden from others, and manage a ring network and make routing changes if it detects a break in the ring.
Ethernet switches are used to manage Ethernet networks. Depending on the communication mode of each ES, there may be other types of networks on the train. The rail vehicles on such a train will need a data translator, or Gateway (GW), so these non-Ethernet ESs can interoperate with Ethernet networks. Up until now, we have been describing the communications architecture within the confines of a BOU. The next type of Ethernet switch, and the most complex, is the Train Switch (TS). This device controls data communications between BOUs, usually across a coupler (a physical connection between train cars). The TS often carries the added burden of extra hardware and software to configure the flow of information throughout each vehicle and along the train.
DATA DIVERSITY
Now that we have described the basic way that data flows onboard a train, let’s talk about the nature of the data itself. There are two types of train data: analog and digital. Over time, analog data could become a thing of the past, but for now, there are still devices that provide information using this method. One such device is a sensor that measures speed from wheel rotation. Usually, data collected from these types of devices requires discrete communication channels with dedicated ES inputs. The ES may digitize the signal so it can become part of the wider traffic flow on the data highway. Newer sensors will usually convert the information to digital form at the source so it immediately becomes available to the Internet.
Data generated by major vehicle subsystems is typically digital can be divided into two types: monitoring and control. As you can imagine, the complexity of the subsystem or its criticality for the safe operation of a train dictate the complexity and volume of the data.
Most subsystems on a train broadcast health-related information. At a minimum, these broadcasts are called heartbeats, conveying only “I am alive or powered on.” The next level might be “I am alive and I am working as expected," with the expectation defined by the train operator and usually embedded in the train design. Also communicated is “Who am I, anyway?” in which case, the message would be “I am a tachometer, and I am alive and meeting your expectations.” Of course, it would be nice to know the specific tachometer, since there may be more than one per train. The majority of devices are not self-aware and, therefore, must leave it up to
the network controller to determine the origin of the data. In an ideal world, from the perspective of data management, the message would be independent of the communication link and would provide a message like “I am a tachometer, my ID is S3d5Rdd-r4, I am attached to the last wheel, right side, and I am powered on and operating as expected.”
This example demonstrates a relatively simple system communication within only one data parameter: speed. Error detection adds another level of complexity. The electronic handshake between devices may require error checking so the receiving device knows that it has obtained the correct information. This is done with a pre-signal that says, “I am about to send you data and it is a total of 26 bytes, are you ready?” When the receiver answers in the affirmative and the transmission is complete, the receiver checks to see that it did, indeed, receive 26 bytes and confirms with the sending device that the message was received in good order. If not, the receiver sends a “communications error” message instead, usually triggering another attempt. If a predetermined number of attempts is unsuccessful, a “timeout error” may also occur. A monitoring or diagnostics system on a train would likely see these errors and report them.
Integrity checking of data becomes all the more important when the data are used to control other devices, particularly safety critical devices. An example of control data is where our trusty tachometer identifies that the train is moving and sends the information to a Master Control Unit (MCU). If the network is the central nervous system of a train, the MCU is the brain. The MCU in turn, sends a signal to the doors telling them to stay closed. The MCU already knows that the doors are closed because the doors were predesigned to send a “door closed” signal to the MCU whenever they close. It is clearly of the utmost importance that the doors are closed when the train is moving, so integrity of the data is paramount.
DATA VOLUME
Through recent experience at Quester Tangent, we know that the data challenge is extensive if data volumes from a propulsion system are compared with those of a tachometer. For example, one propulsion-system brand we encountered broadcasts about 3,500 messages per second. An interesting note from that example is that the messages from that
propulsion system were displayed front and center on a driver’s console, and most of the information displayed carried no criticality nor enabled the driver to make decisions. This issue of data relevance will be explored within the context of data management in Part 2 of this whitepaper.
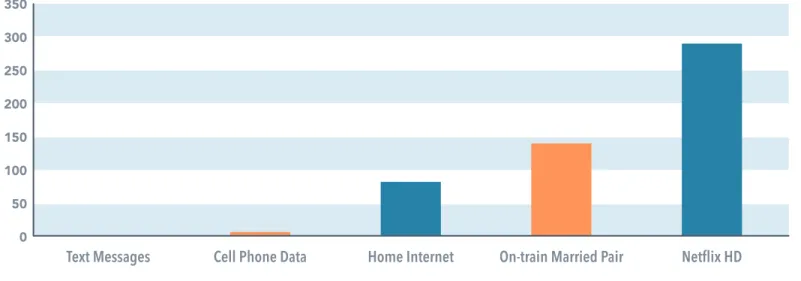
To state a train's data volumes are enormous does not tell the reader where the Internet of Trains sits in the grand scheme of things. Today, there is an expectation that all subsystems on a new train will report data. Data volumes are a function of a train's size and a car's complexity. Where does a train stand in relation to other data devices? Figure 3 illustrates the answer.
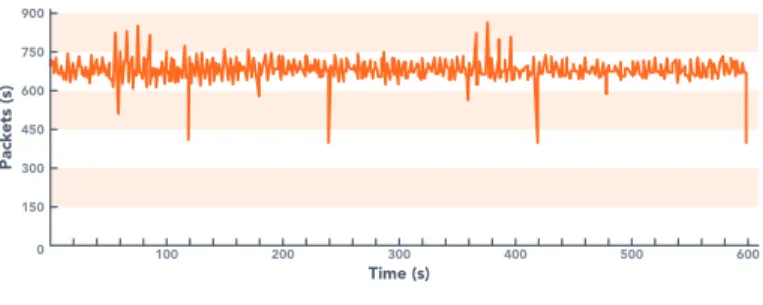
The average number of data points per second being
communicated within a married pair is about 800. The monitoring and diagnostics system sees about 75% of this data, or 600 data points. This translates into almost 52 million records per day. The data rate is fairly constant, as can be seen in the following graph (Figure 2).
In descending volume, these are the subsystems generating data:
1. Propulsion/Braking/Traction - usually come in one package from a network point of view
2. Doors
3. Automatic Train Operations and Control (ATO/ATC) 4. Heating Ventilation and Air Conditioning (HVAC) 5. Communications and Passenger Information Systems 6. Power Supplies
7. Event Recorders 8. Security Systems
This list does not include video data, which will increase data volumes by orders of magnitude.
It is important to note that the information described here is not typically the information that is transmitted to operations for decision making during revenue service. That is usually the domain of train signaling. The data being collected by the monitoring systems is used by maintenance personnel to manage fleet readiness and maintenance activities.
900 750 600 450 300 100 200 300 Time (s) Packets (s) 400 500 600 150 0
Fig 02: Train Data Points per Second
DATA & TIME
This is probably a good time to talk about data timing. In this era of instant gratification, the term “real-time data” is a much-used euphemism. What is real time? In its purest sense, real time is data travelling at the speed of light between the time an event happens and the time the user is informed that the event happened. From a practical perspective, real time should be considered data communications delayed only by latency in getting the signal to the display device. In the digital world, delays can be caused by the switches processing data, for example, or if the signal has to be amplified along the way.
In the context of data management, another concept that resembles timing is data resolution. Consider an analog speedometer, for example. As the wheel revolves, it drives a gear connected to a needle on a dial. The direct coupling provides a real-time view of speed. If an observer were to look at the needle and write down the speed every two seconds, the data may be available in real time, but only with a resolution of two seconds. In other words, speed of data transmission should not be decoupled from its resolution. A related question often pondered is, “If the data is only captured every two seconds, is there any need to report it more often than that?” This question comes into play when a data consolidator, such an MCU is polling various ESs for status updates. If data generated once every two seconds, there would seem to be no need to poll more often than that. The concept of data resolution will come into play later when we discuss methods for controlling data volumes.
Quester Tangent | The Internet of Trains | A Layman’s Guide Part 1 Where does the data come from? Page 4
SUMMARY
As shown in figure 3, trains are not overwhelmingly data heavy compared to other data devices – TV streaming, for example. However, trains are forms of mass transportation owned or administrated by the taxpayer (P3s notwithstanding), so it is incredibly important that they operate efficiently and safely. Where does one begin to answer the questions surrounding train data? Data collection has been mandated but to what end? Quester Tangent used to develop technologies that could process sea-floor data resulting from a ship’s fathometer, the device used to measure water-depth. Every ocean-going vessel has one on board. Along with the water-depth signal, these fathometers have the ability to collect data on sea-floor type: gravel, sand, mud, or rock. Quester Tangent invested hundreds of thousands of dollars into software that could process the data and yield information. This information was in demand from governments for environmental or military applications, or so we thought. Some 20 years hence, trillions of gigabytes of data has been collected and stored, but there is very little interest processing the data. The lesson, which applies equally to trains, is that just because it can be collected does not mean it should be or that it is inherently useful. These questions about the value of data will be tackled in Part 2 of this whitepaper.
350 300 250 200 150 100 50 0
Text Messages
Cell Phone Data
Home Internet
On-train Married Pair
Netflix HD
INTRODUCTION
Picture big banks of computer servers,
sometimes called a
server farm.
These must
be housed in special-purpose, environmentally
controlled rooms that, in some cases, must be
earthquake proof. The facility must be secure
because it is likely that some data is considered
sensitive. The connection to the room must
also be secure. As the volume of data grows, so
does the overhead required to manage it. The
data had better be worth something!
According to Sir Francis Bacon, “knowledge is power”. The underlying sentiment suggests that we should be collecting as much data as we can from trains. Be reminded that most major, and many minor, subsystems on a train generate data, including Doors, HVAC, Power Systems, Traction, Braking, Propulsion, Passenger Information, Communications, Security Systems, and Event Recorders. For many years, data has been collected and stored onboard so it is easily accessible to maintenance personal when needed. Now, with the explosion of Wi-Fi capability, dynamic data exchange is all the rage.
At WMATA and PATCO for example, trains are connected such that when they come close to a dedicated wireless access point, the “onboard Wi-Fi radio” sends data to the wayside. As other transit agencies build out their Wi-Fi infrastructure, there will be an exponential increase in data being captured, transmitted, and stored at the wayside. Data capture is well in hand, but secure data transmission via Wi-Fi presents an enormous challenge. Just ask the engineers designing and implementing Positive Train Control, the rail industry’s collision avoidance/ derailment prevention system.
WHY IS DATA IMPORTANT?
“Data” is raw measured and reported values. When data has meaning, we refer to it as “information”. When information is put into context, it provides “knowledge”. Using past and present knowledge to make better decisions leads to “wisdom”, which is where we can make the best decisions for our organization.
Data, being the foundation of wisdom, is a mission-critical element of moving people and goods safely and efficiently using trains. The maintenance community has yet to see the full extent of knowledge gained from train monitoring.
The following scenario is available to the community today. Take a Monitoring and Control Unit (MCU) as currently manufactured by Quester Tangent. During manufacture, each MCU is run through a battery of tests to prepare it for use on the train. The Environmental Stress Screening (ESS) is designed to deliberately promote the early failure of components with latent defects, called infant mortality. The equipment is actively monitored during ESS with test reports generated. This is in addition to the first routine tests applied to each system. Now the system gets shipped and installed on a vehicle.
During operation, normal or otherwise, the system reports on its status, as well as other information as prescribed by the equipment designers. After 30 years, there will be an incredible wealth of “cradle to grave” data on the operation of that MCU. Along the way, both the equipment designers and operating authorities will have the best possible picture of system performance and can design maintenance schedules, as well as accurately predict system lifecycle. Armed with that knowledge, better system-specific planning decisions can be made and fed into an overhaul cycle. From the manufacturer’s perspective, data captured throughout the equipment’s life will be fed back into the design of future equipment, improving reliability and longevity. With data available from the moment the unit was turned on, fault troubleshooting and maintenance can also be improved.
The Internet of Trains
| A Layman’s Guide
PART 2
Where does the data go?
WISDOM
KNOWLEDGE
INFORMATION
DATA
Quester Tangent | The Internet of Trains | A Layman’s Guide Part 2 Where does the data go? Page 6
ENABLING THE DATA HIGHWAY WHILE
AVOIDING GRIDLOCK
So the data is now at the wayside. What next? The answer to the question goes back to the first thoughts on transit system design. Consideration of the end game for the data is the most important first step in ensuring that the data highway is not clogged with useless information. There are various definitions of data or information engineering; for our purposes it is “…planning, analyzing, designing, and implementing enterprise applications”.
Consider the following:
» For data to be useful, the applications running on-train must be designed before the system is implemented, with an understanding of user needs and use cases.
» To be valuable, information provided by each system
requires an integrated view of the entire system. Local systems have local knowledge, but in complex systems, a complete view is necessary.
» The hierarchy of system functionality must accommodate individual user groups, such as train operators, maintenance engineers, control center dispatch, and management. A historical example may help to illustrate the point. In 2000, Quester Tangent instigated a research initiative entitled “Intelligent Fault Diagnosis”. The idea was to use advanced pattern-recognition algorithms (the same kind eventually used for facial recognition) to identify patterns of fault data that could be used to predict failures. The goal was to collect and analyze train data logged from many rail vehicle subsystems during revenue service, the thought being that it might be possible to identify incipient failures based on the abnormal – but not faulty – operation of one or more pieces of equipment. Data was collected, analyzed, and presented to the maintenance staff at a respected transit authority. For the presentation, Quester Tangent engineers portrayed the information from a single system as a line graph with data points. The maintenance staff had never seen the information presented as a continuous log of data points. Their response was to forget the future possibilities of predictive fault diagnosis because the line graph alone was a great advancement as a diagnostic tool. Perhaps the idea was ahead of its time, but more effort should have been expended at the outset to ensure clarity on how the data was to be used. The converse scenario is that the data’s end user may not yet know the value of a specific data set but may realize its value at some future point, only to find out that it had not been collected at all. How to determine the data worthy of collection? In the world of Internet, it seems that the idea is to promote data logging because someone out there will eventually find a use for it. At a recent high-tech conference, the president of EA Sports said that 1,000 new apps hit the streets every day. The cost to acquire data may be very low, which makes the gamble worth the risk. Not so in trains, because the interconnection of equipment
is expensive. The technology required to get the data to the wayside and manage it forever is also expensive. There are a couple of decision points worth noting when considering how to assess data value.
Historical cost to maintain equipment. If wheels are the most costly part of a train to maintain, it makes sense to collect as much data as possible from the wheels in an attempt, through data analysis, to reduce maintenance costs. If train subsystems were organized by historical cost to maintain, you could probably identify their priority for data collection.
Value-stream mapping. Some years ago, Quester Tangent reorganized its manufacturing area to emphasize manufacturing operations that provide the most value to the end product and reduce or eliminate shop-floor operations that provided little or no value. For example, if an inspection step never identified any non-conformances, chances are it had limited or no value, and was, thus, eliminated from the stream. In the same way, data collected from a train that could lead to improved operating efficiencies – energy consumption, for example – may yield significant value.
WHAT ARE THE OPTIONS
FOR DATA MANAGEMENT?
Asset management software has been around since the computer database. Typically, when representing static data, the applications were largely blind to the type of asset. With the advent of GPS, RFIDs, and more sophisticated processing, asset management software has become a powerful application for managing data, but with limited utility as a tool to extract greater future value from equipment operation and maintenance.
Maintenance management software has streamlined the process of equipment maintenance. When integrated with an enterprise resource planning tool, the equipment owner has an integrated solution to predict, manage, and report cost. Maintenance scheduling, with a view to equipment lifecycle and revenue service availability, has significantly improved with the expansion of maintenance management software. However, the input data is typically derived from OEM maintenance schedules, which may not accurately reflect the operations of that equipment, particularly when integrated on a vehicle and used in concert with the other vehicle subsystems.
Wayside Monitoring and Diagnostic Software (WMDS) has been developed specifically to capture, present, and analyze train equipment data. At its core, it is linked to the prescription of how a piece of gear is supposed to operate on a vehicle as articulated by, for example, a fault tree or data dictionary. A WMDS is not blind to the equipment set generating the data and is considerate of the other equipment to which the specific equipment is connected. The better products also have two-way communication to the equipment set to allow dynamic interrogation or push commands to the onboard unit, either individually or across fleets. It is a more relevant source of information upon which to base equipment maintenance scheduling. An example of such a product is FleetWise® from
Quester Tangent.
THE ART OF WI-FI COMMUNICATIONS
Let’s take a moment to look at the seemingly
straightforward task of Wi-Fi communication. It must be easy, because most North American households have Internet-equipped internal Wi-Fi for the convenience of connection! Through recent involvement in two projects with train data being broadcast to wayside, we know the challenges are impressive.
Quester Tangent has been involved in the integration of train subsystems with vehicle communication systems for many years. See our whitepaper Five Insights of a Train Integrator on the topic. We understand the importance of flowing detailed design requirements to the system vendors. You have to make a plan, and that plan has to be realistic in terms of the expectations of the technology. Here are some of the considerations in planning to connect a train to the wayside.
The Federal Government allocates two frequency bands for public data communications: 2.4 and 5 GHz. The 2.4 GHz band carries less information, but is able to travel farther without signal loss. The 5 GHz signal carries more information, but is less reliable over distance. Under typical conditions, equipment is designed to automatically adapt to the best frequency depending on data
throughput requirements and distance to wayside wireless access points. The algorithms used for the decision can be complex.
The goal is to maximize data throughput using the appropriate infrastructure while maintaining cost efficiencies. Site surveys are required to design a mesh type of physical coverage in a yard or at a station. By the way, cell phone technology is the best way to communicate along the track while the train is moving. Wi-Fi is not effective because a train’s speed does not allow enough time within a suitable range to send much data. Cellular data charges can make this option for train-to-track communication prohibitive.
The types of antennas used are an important piece of the puzzle because each has unique directionality and strength characteristics. The question of where to locate wireless-access devices on the wayside or the position of antennas on trains is complicated by other factors, such as interference from other devices on the train, wireless communication at the facility, and the influence of external communications devices – public or otherwise – near the track. It is not unusual for a train antenna to pick up signals from 30 to 50 wireless devices simultaneously; consider the number of wireless printers in use at office buildings.
Quester Tangent | The Internet of Trains | A Layman’s Guide Part 2 Where does the data go? Page 8
KNOWLEDGE TO BE GAINED
FROM A WMDS
A WMDS is the land-based extension of a vehicle’s systems communications network. When connected via Wi-Fi, such a system can show real-time vehicle readiness for revenue service operation. Figure 5 is a view of every car in the fleet that is stationed in a yard called Greenbelt.
In this view, the Yard Master can see that there are five trains in the yard, four of which are actively connected. The orange icon above a train car indicates an active Wi-Fi connection. A green car means there are no faults affecting revenue service. Yellow and orange cars mean there are faults or cut-outs, but the train is still available for service. A red car means that it has a major fault that requires intervention. It is possible that the intervention may be as simple as issuing a “clear fault” command from the wayside console, but it may also require dispaching a work party. That decision can be made by looking at the status of individual cars using the cursor to select the target vehicle.
In the car view, all the faults for a given time period can be displayed. In the screen shown on the following page, there is one major fault described as “Insufficient Air Supply”. This fault is with the Brake subsystem. There are other problems with this car, such as a failure identified by the HVAC system. The associated warning value may or may not preclude the vehicle from moving, depending on the fault-tree prescription in the design.
By selecting a specific fault, the user will get detailed information on the problem and on its corrective action. There is a natural link at this point to a maintenance management system. From a single information source, the Yard Master is in a strong position to organize work crews and assess fleet availability.
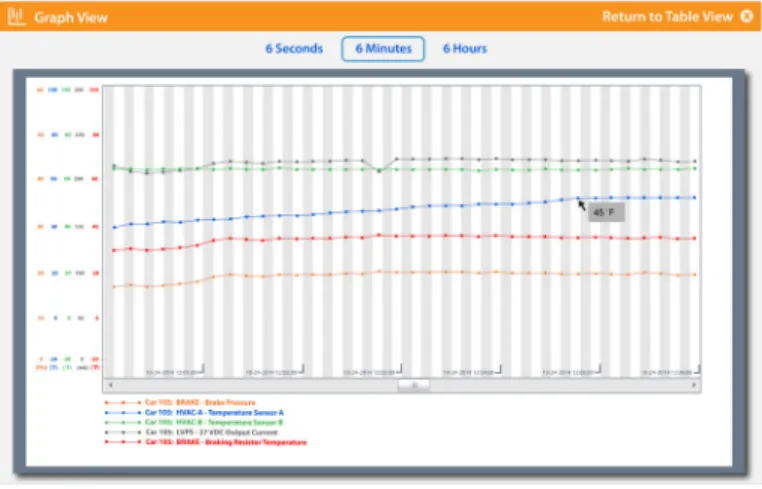
For the longer historical perspective, and perhaps as a clue to troubleshooting existing problems, the user can search the data for specific attributes. There are multiple ways to analyze the data, and in some cases, a line graph will allow for rapid problem diagnosis. Figure 7 provides an example of how such data may be viewed.
Depending on the resolution of the data, it is possible to have a near-continuous view of a particular piece of equipment throughout the lifecycle of the vehicle.
Fig 05: Fleet View in Greenbelt Yard
Fig 06: Diagnostic Fault View for Car 7004
SUMMARY
The Internet of Trains holds a legitimate position within the context of the bigger picture – the Internet of Things. Witness the data being collected from a diverse but integrated set of equipment. Multiple data being amassed and pushed through onboard management devices in real-time or from repositories and, ultimately, ending up on the screen of a decision maker, is clearly in the domain of what is called “The Internet”. While the machine2machine moniker describes how the system works, ultimately, the actions derived from such interaction still require human intervention to affect a solution.
Tactics used to extract the data from each machine will vary with the nature of the equipment and data. In the short term, this may only evolve as CPUs get smaller, faster, and cheaper. As it becomes easier to enable on-train devices, modest data expansion is inevitable. In all but a few major transit authorities, the infrastructure to get data to the wayside does not yet exist, but there are no technical barriers to such implementation. There will be an information explosion as transit authorities develop successful techniques of data analysis to demonstrate that, armed with the correct knowledge, mass transit by rail will be significantly more cost efficient, safer, and provide a better passenger experience.
It is time that concerted efforts be made to collectively identify the data of highest value and arm new specifications with the requirements so minimum standards can be met. The newest trend in the evolving Internet seems to be centered on the idea of “community engagement”. Individuals are no longer sitting alone playing video games; they are connected to a global community of players. Businesses seeking solutions to challenging problems turn to crowd-sourcing as a strategy for success. Consider a cloud platform, whereby all historical train data can be accessed by a global community charged with developing tools to improve equipment reliability or operational efficiency. The power of community engagement could be enormous, generating a significant return on investment by enabling the data highway and the Internet of Trains.
ABOUT THE AUTHOR
William Collins has been working with big data for 30 years. As a marine scientist, Bill collected and analyzed high volumes of data from the deep ocean. Armed with that knowledge, he aided in the design of sonar-based, remote sensing systems for rapid data acquisition and analysis. Fifteen years ago, Bill brought that experience into the train data world, helping Quester Tangent to achieve excellence in delivering electronic solutions for passenger rail. Bill has held both domestic and international scientific positions within universities and governments, as well as executive and ownership positions in industry. He is currently Vice President and Chief Operating Officer at Quester Tangent located in British Columbia, Canada. Bill can be reached at:[email protected]
ABOUT QUESTER TANGENT
Quester Tangent has served international markets for more than 30 years with an innovative range of products and services. The first market was acoustic seabed classification, involving capture and analysis of raw seabed data on international coast guard and navy vessels. The company eventually parlayed its expertise into train management systems in the early 1990s.
Today, Quester Tangent is a leading North American manufacturer, supplier, and integrator of train electronics and software solutions for the passenger rail and locomotive industries. Quester Tangent features a complete portfolio of technology products for the rail transportation industry: TrainWise®, flexible on-board train and locomotive electronics,
FleetWise®, innovative wayside software and TestWise®, comprehensive
test equipment products.
For more information, visit:QuesterTangent.com
Follow us on Twitter: @QuesterTangent
Quester Tangent is registered to ISO 9001:2008, CMMI Level 2 SCAMPI A ready.
P 1 855 510-7837 E [email protected] QuesterTangent.com 6582 Bryn Road, Saanichton, British Columbia V8M 1X6 Canada
Copyright © 2016 Quester Tangent. All rights reserved.
DWP-CORP-1000-R01-0
4