HVAC Energy Efficiency
Maintenance Study
Issued: December 29, 2010
Presented To: Brett Close
Southern California Edison
Prepared By: Marshall Hunt, PE, Davis Energy Group, Inc. Kristin Heinemeier, PhD, PE, UC Davis, WCEC Marc Hoeschele, PE, Davis Energy Group, Inc Elizabeth Weitzel, Davis Energy Group, Inc.
CALMAC Study ID SCE0293.01
Acknowledgements
The authors would like to thank Brett Close of the SCE for his valuable insights, support and facilitation of the project process, and project management.
We would like to acknowledge the assistance of the Project Management Team, our Project Advisory Panel, and attendees of our Technical Forum. Finally, the report benefited from detailed comments on the review draft by experts in the field who took the time to delve into the details of the report calculations and analysis. We had significant help on this report from Jennifer White and Campbell BrownKorbel.
Executive Summary
Research has shown that the performance of existing residential and small-commercial heating ventilating and air-conditioning (HVAC) systems is far from optimal. In many cases, the systems were never installed correctly and have never operated optimally, resulting in lower efficiency than implied by the nameplate rating. In other cases, the performance has degraded over time, either because of faults or improper service, causing the equipment to malfunction or to perform poorly. Measures such as duct sealing and repair, condenser and evaporator coil cleaning, refrigerant charge and air flow adjustments, economizer retro-commissioning, and HVAC controls can potentially produce significant savings.
The California investor-owned utilities (IOUs) have shown a great deal of leadership in initiating maintenance-based HVAC programs. These and other energy efficiency programs have been in existence since the 1980s, and have reached millions of homes and small businesses. Despite their success in reaching the market, however, the energy savings attributable to HVAC
maintenance programs have been called into question. For example, one evaluation of savings for residential charge and air-flow adjustment programs in the 2006-2008 program cycle found quite low savings rates, but also found wide variations in the different program impact
parameters. These studies raised the possibility that some of the Evaluation, Measurement and Verification (EM&V) questions being asked and answered have such large uncertainties that conclusions and recommendations based on them should be considered carefully.
In the long run, achieving the ambitious California Public Utilities Commission (CPUC) “Big-Bold” HVAC goal of 50% improvement in residential and small commercial HVAC system efficiency will require new, more comprehensive programs that have the potential for greater impact. For these programs to constitute a prudent use of ratepayer money, however, they must be designed based on a good understanding of the impacts and interrelationships of individual and combined system faults (i.e., abnormal conditions that may lead to system performance degradation or failure) and maintenance measures. A simple “widgets” approach that focuses on individual measures that save 10% here and 5% there will not achieve the level of savings that is needed to meet the CPUC’s ambitious goal. HVAC technologies should benefit from a broad based systems approach.
Highlights of our analysis include the following key observations, each of which is discussed in depth in the report.
Uncertainties are inherent in programs such as these and are not well accounted for. There are many interrelated sources of uncertainty, including measurement errors, uncertainties in predicting human behavior, and the compounding effect of performing calculations on imperfect data. Perhaps the most important observation here is that, with the program specifications, methods, and tools commonly used today, it is difficult for a simple refrigerant charge
adjustment to be implemented, measured, and verified to the level of confidence that is required by the CPUC. It is impossible to eliminate all sources of uncertainty, but they should be
mitigated where possible (e.g. if the technician stops when a target superheat or subcooling value is reached there will be a 50% chance that the charge will be within the desired range, and a 50%
chance that it will not). A good understanding of uncertainties by program designers, contractors, and technicians is important.
Additional screening and more sophisticated diagnostic/servicing approaches would benefit future programs. Quality maintenance programs have the potential to be successful, but their design and structure could be improved. For example, if technicians perform basic screening of HVAC systems to determine whether (and which) services are likely to improve efficiency before implementing charge adjustments, additional energy could be saved. Furthermore,
implementing multiple measures can potentially save much more energy than the current strategy of implementing single, simple measures, particularly when multiple faults are present. The costs of providing such a comprehensive service may be higher. However, the additional savings might justify the cost at a large number of sites. The presence of multiple faults and the need for multiple measures complicates diagnostic/service protocols in ways that are not well understood. There is not a thorough, up to date, and independent assessment of the baseline fault conditions of the over 10 million unitary air conditioners in California. Further study would help to develop appropriate diagnostic and service strategies that can be guided by the principles of making sure that no harm is done to the system, that energy efficiency is improved, and that to the greatest extent possible every site visit results in an energy efficiency improvement.
Human factors are significant but are poorly understood. The behavior, motivations,
preparation, and constraints on technicians, owners, tenants, contractors, and EM&V specialists can make or break a program. This is an area that has been overlooked in the field of behavioral research, and a better understanding of why people do what they do is critical. If broad CPUC energy efficiency policy goals are to be achieved, the measurement of "free-ridership" needs to be improved to recognize that HVAC quality maintenance measures and services do not exist without the support of energy efficiency programs.
Measurement and verification processes must be improved. EM&V processes and
instrumentation need to be improved and integrated with program delivery, quality control and reporting. One-time field EER measurements appear to be of marginal value since uncertainties can approach ±20%. Even with high-quality, time-series EER measurements, there is
uncertainty in simulating the annual kWh savings, in part due to behavioral factors affecting occupancy and thermostat patterns. Longer term, broadly implemented pre- and
post-measurements of kWh consumption would reduce uncertainty, and could be implemented using utility smart meters and/or web based sub metering.
Over the long term, achieving large energy savings might be possible with replacement of existing systems and integration with whole-building energy efficiency measures.
Intuitively, the whole-building approach to energy efficiency should be much more effective than implementing energy efficiency measures in a piecemeal fashion, with the potential to achieve savings of over 50%. Past attempts at this approach have enjoyed limited success. The theory is that a new HVAC system can be sized for the reduced load that results from
improvements in ducts, windows, insulation, lighting, infiltration, etc. Equipment kW savings are achieved, although kWh savings are less certain. In the long term, the HVAC industry and utility energy efficiency programs will continue to improve and will likely include providing quality installation, commissioning, automated diagnostics, demand response, and
whole-building integration, in addition to maintenance. There will probably always be a need for maintenance-based programs to address the HVAC systems that can become efficient when they receive quality maintenance and the repairs that are needed.
In the short run, the authors feel that maintenance-based programs continue to be refined, improved, and redesigned. The focus of this study is on how the industry can be moved from current programs to better programs in the future. This project was sponsored by Southern California Edison (SCE), Pacific Gas and Electric (PG&E), San Diego Gas and Electric (SDG&E) and Southern California Gas (SCG) EM&V funds and managed by SCE to evaluate the current state of knowledge on the impact of HVAC maintenance measures, analyze potential sources of uncertainties, and develop recommendations for additional research. We hope this report will provide a common framework for discussion and facilitate better communication among program stakeholders, while providing insight into potential areas for improvement.
Table of Contents
Executive Summary ... E-1
1 Introduction ... 1
2 Project Objectives ... 5
3 Methodology ... 6
4 Refrigeration Cycle Analysis and RCA Programs ... 8
5 Duct Systems and DTS Programs ... 18
6 EER, Energy Savings, and Peak Demand Reduction ... 24
7 Uncertainties in Site Measurements ... 32
8 Uncertainties in kWh Calculations ... 43
9 Other Uncertainties ... 45
10 Implications of Uncertainty ... 53
11 Roadmap to CPUC Goals ... 59
12 Research Plan ... 63
13 Conclusions and Recommendations ... 69
14 References ... 73
Glossary ... 77
Tables
Table 1. Example R-22 Superheat Calculation………..16Table 2. Data for Sensitivity Coefficient Calculations………...…..36
Table 3. Calculated Sensitivity Coefficients………...37
Table 4. Impact of Test Conditions on Uncertainty………..38
Table 5. Instrumentation Uncertainty………...………39
Table 6. Summary of Uncertainties in Measured Values and Energy Metrics………. 53
Table 7. Allowed Range as a Function of Superheat or Subcooling Measured Uncertainty…...55
Table 8. Changes to 2004 AEC Specification Recommended at Technical Forum…………..…56
Figures
Figure 1. Unitary Refrigeration System Schematic………...10Figure 2. Taxonomy of Refrigeration System Faults……….11
Figure 3. Condenser Coil Fouling………...…...12
Figure 4. Evaporator Coil Fouling……….13
Figure 5. Variance of Normalized Sensible EER v. Subcooling………...………17
Figure 6. Complex RTU System Interactions………18
Figure 7. Duct Leakage Impacts on Distribution Efficiency……….20
Figure 8. Percent of AHRI Tests v. Nominal Duct Leakage for Ducts Located in Attics……….21
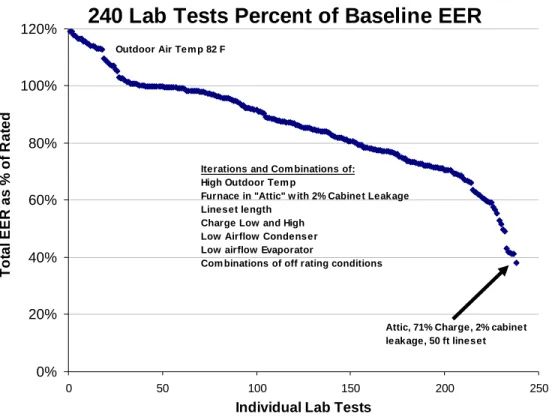
Figure 9. Range of EER Lab Test Data……….25
Figure 10. DEER Projected Annual Savings for a Climate Zone 10 Home……….……….29
Figure 11. Normalized Efficiency Plot………..…31
Figure 12. Normalized Efficiency Impact Charge at Dry Conditions………...32
Figure 13. Response Time of Temperature Probes………34
Figure 15. Age of California Residential Air Conditioning Systems………...50 Figure 16. Illustrations of Interaction of Measurement Uncertainty and Measured Superheat….54 Figure 17. Illustrations of Adjusted Allowed Superheat Range………54 Figure 18. Real-time Condensing Unit and Blower Demand Tracking……….68
1 Introduction
Energy use is increasing in California, with current projections indicating that by the end of the century household energy use will grow by as much as 55% in the hotter regions of the state1. Peak demand is also growing, resulting in the use of high-cost peaking power plants that operate only a few hours every year. Residential and commercial unitary HVAC units contribute
significantly to peak demand, with residential units accounting for 24% of peak demand in 2006.2 Before the widespread use of vapor compression cycle air conditioners the cooling peak did not exist or was small driven by use of circulating fans. Unitary air conditioners typically do not achieve rated efficiency because of improper installation or lack of servicing: lab testing suggests that service and replacement programs can yield energy savings on the order of 30-50%3. For these reasons, HVAC units have become a focal point for energy efficiency programs. In 2006, Assembly Bill 2021 directed the California Energy Commission (CEC) to develop a “strategic plan designed to improve energy efficiency and reduce peak energy use of central air-conditioning systems in California.” The CEC’s strategic plan focused on new systems covered by Title 24, and on the building permit process. In September 2008, the California Public Utilities Commission (CPUC) adopted the California Long-Term Energy Efficiency Strategic Plan, referred to as the "Big-Bold" plan. The Big-Bold plan built on the CEC's strategic plan and envisioned a radical transformation of the residential and small commercial HVAC industry. The Big-Bold plan set very aggressive energy reduction targets: a "50% improvement in efficiency in the HVAC sector by 2020, and a 75% improvement by 2030."4
To achieve the goals of AB 2021 and the Big-Bold plan, there have been a number of HVAC-related energy-efficiency measures and incentive programs implemented in California. From 2006 to 2009 the CPUC approved and monitored a variety of Duct Test and Seal (DTS) and Refrigerant Charge and Airflow or Adjustment 5(RCA) service programs, which were
administered by Investor Owned Utilities (IOUs). The DTS and RCA programs used estimated energy savings and estimated incremental measure costs to create incentive payment schedules. There is controversy surrounding the question of whether the programs were cost effective when evaluated using ex ante (estimated before the program) deemed kWh/year savings based on the "Total Resource Cost Effectiveness" method.6 Savings values based on Evaluation Measurement & Verification (EM&V) studies (ex post) were so low that the programs are not considered cost effective by the study authors. Experts in the field point out the necessity of distinguishing
1 p. 13, Auffhammer, M., Aroonruengasawat, A., "Uncertainty over Population, Prices or Climate? Identifying the
Drivers of California’s Future Residential Electricity Demand," Energy Institute at Haas, WP 208, August 2010.
2 p. 5, Messenger, M., "Strategic Plan to Reduce the Energy Impact of Air Conditioners," CEC-400-2008-010, June
2008.
3 p. 20, Messenger June 2008.
4 p. 58, Section 6, California Long Term Energy Efficiency Strategic Plan, California Public Utilities Commission,
September 2008.
5 Different interpretations of what “A” in RCA means. “Adjustment” is the technically accurate meaning since
airflow is not measured but is determined to be adequate based on the temperature split. EM&V studies and some programs call out “Airflow”.
between cost effectiveness of the measures and cost effectiveness of the programs that implement them on a broad scale.
The key EM&V studies are as follows:
• August 2006 – EM&V Final Report, RCA Verification Program for New and Existing Residential and Commercial Air Conditioners; CPUC # 1385-04, 1395-04, and 1437- 04, CALMAC Study ID – RMA 0001.01; Aloha Systems.
The Refrigerant Charge and Airflow Verification Program (RCAVP) implemented by Robert Mowris & Associates is assessed. “The net energy savings achieved by the statewide program were … 113% of the energy savings goal … and 136% of the demand reduction goal …”7 The program supported improvements in Title 24 RCA
requirements. Participating contractors agreed with a report recommendation that the program should continue. The study was not designed to provide an assessment of measurement precision or confidence intervals and no field measurements were performed.
• November 2008 – Residential Retrofit Contract Group First Draft Verification Report; CPUC Energy Division; The CADMUS Group.
An assessment of programs during implementation without final program results was performed by CADMUS. This study is used as an input to the February 2010 KEMA study. The report introduced Monte Carlo analysis of the probability of accurately measuring refrigerant superheat and subcooling. The study found that 47% of the duct sealing sites surveyed did not pass the program criteria8 and 58% of the RCA sites surveyed failed. Concerns about the sample size and analytic methodology have been expressed.
• March 2009 – Process Evaluation: CPACS Program 2007-2008; SCE0265.01; EMI
The report assesses the process and makes recommendations. A “Rapid-Feedback” evaluation was done in 2007 during the 2006-2009 implementation timeframe and then followed up beginning in mid-2008. This second assessment identified if and how the initial recommendations were addressed as well as any additional program performance issues.”9 Problems with planning, goals projection, and production meeting the goals occurred. Concerns about savings estimates, work papers, cost effectiveness calculations and the uncertainties of the VSP applied technologies led to the recommendation10 that "SCE should coordinate with the other IOUs, California Energy Commission, CPUC, and
7 p. I, EM&V Final Report, RCA Verification Program for New and Existing Residential and Commercial Air
Conditioners; CPUC # 1385-04, 1395-04, and 1437- 04, CALMAC Study ID – RMA 0001.01; Aloha Systems. Robert Mowris Associates (RMA) is now Verified, Inc.
8 Criteria are disputed by implementers as based on erroneous interpretation of the Duct Sealing program.
Implementers claim that passing requires15% total leakage or a 15% reduction of total leakage. EM&V contractors only used 15% total leakage with no credit for reduction in leakage.
9 p. 3, March 2009 – Process Evaluation: CPACS Program 2007-2008; SCE0265.01; EMI 10 p. 5, EMI March 2009
verification service providers (VSPs) to quantify system and process uncertainties. These studies should lead to the development of processes or protocols that support improving the reliability of VSP field verification and ensure that measures are installed
appropriately via post-installation review/inspection."
• April 2009 – CPACS RCA Billing Analysis Report, EMI for SCE
In the Executive Summary the report concluded: "The billing analysis-based assessment of SCE’s RCA measure showed no statistically significant energy savings for the general populations of participants studied (26 ± 28 kWh/year). The great difference between the confidence interval of expected savings found from this statistical analysis of
participants’ bills and the 2005 DEER calculated savings (233 kWh/year) provides a high degree of certainty that the DEER calculation requires re-calibration."11
This analysis of billing data has been criticized as inappropriate because it does not follow the IPMVP guidance that "typically savings should be more than 10% of the base year energy use if they are to be separated from the noise in base year data"12 when using billing analysis for measurement and verification. But, the California Energy Efficiency Evaluation Protocols do not include that guideline in the Gross Energy Impact Protocol.
13
• July 2009 – Market Assessment and Field M&V Study for Comprehensive Packaged A/C Systems Program, ADM Associates, SCE0286.01, July24, 2009
This study evaluated 109 units in the field and found that 89 had fault conditions, with 31 having two or more faults.14 A rule-based diagnostic protocol adapted from work by James Braun and his colleagues at Purdue University was used to good effect: "The average EER for the units increased from 6.64 before servicing to 7.05 after servicing, an average increase of 6.1%. However, the results of a paired t-test showed that the
hypothesis of “no difference” between the pre- and post-servicing averages can be rejected only with a confidence level of 80%."15 Duct test and seal protocols and measurement techniques were included, and showed that airflow dropped when ducts were sealed for a group of 35 houses. Accuracy of instrumentation and uncertainty of EER calculations were not discussed and the sample size was limited. Finally, the protocol developed at Purdue is not universally accepted by experts in the field.
• February 2010 – Evaluation Measurement and Verification of the California Public Utilities Commission HVAC High Impact Measures and Specialized Commercial
11 p. 1, CPACS RCA Billing Analysis Report, EMI for SCE, April 2009.
12 p. 28, International Performance Measurement & Verification Protocol Concepts and Options for Determining
Energy and Water Savings Volume I, DOE/GO-102002-1554, March 2002.
13 p. 28-30, California Energy Efficiency Evaluation Protocols: Technical, Methodological, and Reporting
Requirements for Evaluation Professionals, Prepared for the California Public Utilities Commission by The TecMarket Works Team,April 2006.
14 p. 4-9, ADM July 2009 15 p. 6-1, ADM July 2009
Contract Group Programs, 2006-2008 Program Year, Volume 1, KEMA, CADMUS and Summit Blue, CPUC, February 10, 2010 and Volume 2, Appendices.
Refrigerant Charge and Airflow (RCA) and Duct Test and Seal (DTS) were two of the high impact measures covered by the study that considered them as contained in
programs administered by the IOUs. The estimated savings, or ex post savings estimates, were so much lower than normally encountered in EM&V studies that the validity of the programs has been challenged. In Table 3-116, of the nine programs studied, the best had an ex post that was 45.6% of ex ante and the worst was at just 5% (weighted average of 20.1%). In Table 3-517 of the five DTS programs the worst ex post was 26.5% and the best was 49%. With over half of the savings coming from the worst program the
weighted average was only 29.8%. The study did not attempt to measure the annual kWh savings. Ex ante deemed savings were significantly reduced due to finding low rates of proper installation and higher than expected free ridership. A Monte Carlo technique was used to compare the uncertainty of HVAC contractor superheat and subcooling results with the findings of the EM&V team. But, there were no uncertainty estimates given for the EERs that were calculated from field measurements. The study was also burdened by lower than planned sample size. There is an intense controversy about the validity of the study that is not the focus of this report but that is indicative of the uncertainty that surrounds HVAC Quality Maintenance (QM) programs.
Taken together, these six EM&V studies raised serious questions about the design and efficacy of the implementation of current DTS and RCA energy efficiency measures. For this reason, as of August 2010, the California IOU’s HVAC Quality Management programs are largely on hold, with many demand-side management (DSM) experts being concerned about their viability. A few third-party programs (which make the implementer more responsible for achieving the predicted energy savings, rather than the IOU) are still active but the mass market SCE core programs for 2010 do not include the RCA and DTS programs of 2006-2009. PG&E and SDG&E presently offer scaled down revised RCA and DTS programs. Pressure is building to get programs restarted as soon as possible, but only with a good understanding of how to improve them to ensure their effectiveness. While it may not be possible to arrive at consensus among the stakeholders, it could be beneficial to convene a forum for the purpose of forging consensus. The forum would be successful if it clearly defines areas of disagreement, areas needing more research and how to get the work done. For example, the problems of small field sample size and the paucity of detailed field test data are widely recognized as a high priority issues.
It's unclear whether the current programs' disappointing results were due to ineffective program design, overly optimistic projections, or inaccurate pre- and/or post-implementation evaluation techniques. What is clear is that the DSM industry needs a sound strategy for designing programs and evaluating their effectiveness.
During this same time frame a set of four national consensus standards were adopted and published. The concepts of quality maintenance (QM) and quality installation (QI) are clarified
16 p. 13,Volume 1, KEMA February 2010 17 p. 16, Volume 1, KEMA February 2010
by the standards and are utilized by this report. Without the QM standards, RCA and DTS stand alone as energy efficiency measures. With QM standards, RCA and DTS are integrated into HVAC contractor business practices while raising new questions about how to handle levels of QM that progress from simple service activities, to complete diagnostics, to adjustments, and finally to recommendation of repairs. Discussion at the August Technical Forum and elsewhere points to stakeholder concerns that the standards are too complicated and will be generally too costly to be implemented.
The four standards that influence HVAC maintenance are:
1. ACCA Standard 4: In 2008, ACCA published ACCA Standard 4: "Maintenance of Residential HVAC Systems" (ANSI/ACCA 4 – 2008). This standard includes a set of screening tasks that could form the basis for a maintenance program.
2. ACCA/ASHRAE Standard 180: In 2008, in support of commercial system screening, the following ANSI/ASHRAE/ACCA Standard 180 – 2008 was approved: "Standard
Practice for Inspection and Maintenance of Commercial Building HVAC Systems." This standard covers the full range of commercial equipment. A proposed Economizer Table developed by the Western HVAC Performance Alliance is being considered for
inclusion.
3. ACCA Standard 5: In 2007, the Air Conditioning Contractors of America (ACCA) published Standard 5: "HVAC Quality Installation Specification" (ANSI/ACCA 5 QI – 2007). This standard covers the installation of air conditioners and ducts, and
emphasizes duct quality.
4. ACCA Standard 9: In 2009, ACCA published Standard 9 (ANSA/ACCA 9 QIVP – 2009): “HVAC Quality Installation Verification Protocols” which sets forth the procedures for verifying adherence with Standard 5.
2 Project
Objectives
In the aftermath of the recent EM&V studies, fundamental differences of opinion have emerged on what, if anything, went wrong with previous programs (and why), and on how to move forward with future energy efficiency programs. In this report, we hope to provide a common framework for discussion and to facilitate better communication among program stakeholders, while providing insight into potential areas for improvement. It is impossible to eliminate all sources of uncertainty -- whether they are in measurement and analysis or human behavior -- but it is critical to design programs with a better understanding of the sources of uncertainty and their potential impacts. With this in mind, the key objectives of this project were to:
1. Assess the current state of knowledge about the impact of unitary HVAC equipment maintenance measures, including potential savings and long-term persistence of these savings. The technical focus is on the efficiency of the cooling
system (i.e., the refrigeration and duct systems) and not on the heating and ventilation systems.
2. Identify key uncertainties that affect the energy and demand savings potential of these measures, and that affect the ability to measure these savings.
3. Assess current information on the roles of these uncertainties in reducing the savings from these measures.
4. Propose research activities to help fill in the gaps in our understanding of factors
affecting savings.
This project is not intended to provide a complete analysis and critique of current measurement and diagnostic procedures or program designs. Instead, our focus is on developing the next steps that will lead to better program design and implementation resulting in verified savings.
3 Methodology
A project of this nature is challenging since there are many stakeholders and a broad range of issues to be addressed, ranging from technical details to broad CPUC policy goals. There is significant interplay between technical issues (e.g., sensor installation procedures) and human factors (e.g., how the contractor directs the technician to implement the program requirements). This project was designed to better understand the issues related to uncertainty and EM&V issues and to develop a roadmap to provide direction on future research and program needs. The following activities were conducted in this study:
• Assembled and developed a summary review of key publications and reports over the past 20+ years that provide a basic catalog of information relevant to HVAC energy efficiency.
• Analyzed laboratory test data from HVAC systems operated with and without faults. • Worked with verification service providers (VSPs) and the EM&V contractors to better
understand their processes, quality control procedures, and diagnostic protocols. • Assessed implementation of VSP processes in the field.
• Utilized the knowledge and perspective of an experienced refrigeration engineer in reviewing current VSP procedures, sensor specifications, identification of multiple faults, etc.
• Interviewed stakeholders, industry experts, and diagnostic equipment manufacturers to gather input on data collection procedures, calibration issues, and measurement
repeatability.
• Incorporated fundamental analysis of uncertainty statistics in better understanding how program specifications need to be set to ensure that a meaningful result is generated. • Gathered input from utilities, industry groups (such as the Western HVAC Performance
In this project, we did not delve into the databases generated by the VSPs in the process of tracking the delivery of the 2006-09 programs; this work has been done by others. Instead, we focused our efforts on the programs' technical foundations.
As the project evolved over the past seven months, it became increasingly clear that it would be critical to solicit stakeholder input and work towards consensus building in order to keep HVAC maintenance focused programs moving forward. To that end, we organized and facilitated two meetings that brought together a wide range of industry stakeholders. The first was a day and a half Tech Forum held at PG&E’s Stockton Training Center on August 4th and 5th, 2010. The second was a mid-August informal session held at ACEEE’s biennial Summer Study, titled “Unitary HVAC Quality Maintenance Project: Fault Detection, Diagnostics and Repair; and Duct Test and Seal”. Input from the meetings has been integrated into this report.
The Davis Energy Group team was comprised of Project Manager Marshall Hunt, PE; Marc Hoeschele, PE; Beth Weitzel; Bill Dakin, PE; and David Springer. The Western Cooling Efficiency Center effort was lead by Kristin Heinemeier, Ph.D., PE. To assist the core consulting team, a small group of outside consultants were added to the team to provide additional expertise. These consultants included:
• Allen Amaro, Amaro Construction. Mr. Amaro is a practicing HERS rater who completes RCA inspections under current Title 24 processes.
• Jennifer White provided technical writing and editing.
• Mark Cherniak, New Buildings Institute. Mr. Cherniak is the Senior Program
Manager with New Buildings Institute, and has over 25 years of experience in the field of energy efficiency.
• Jim Phillips, The Energy Savers. Mr. Phillips has over 45 years of hands-on and training experience in the HVAC industry working on both residential and commercial systems and is a NATE certified technician.
• Dr. Neil Willits, UC Davis Statistics Lab. Dr. Willits provided support in understanding the statistical basis of measurement uncertainty.
• Hugh Henderson, PE, CDH Energy. Mr. Henderson contributed to the discussion of normalization in Section 6.
• Campbell BrownKorbel. Ms. BrownKorbel provided writing and editing skills. The project also convened a Project Advisory Panel (PAP) to provide review input to the team on key deliverables. The panel was selected from HVAC industry leaders with a broad range of expertise. Participating PAP members included:
• Edward Vine, Lawrence Berkeley National Labs (LBNL). Dr Vine is a Staff Scientist at LBNL and is the Manager of the Environmental Program at the California Institute for Energy and Environment (CIEE).
• Mike Lubliner, Washington State University (WSU). Dr. Lubliner is a researcher at WSU and co-chair of the ASHRAE 6.3 Residential Central Forced Air Heating and Cooling Equipment committee.
• Loren Lutzenhiser, Portland State University (PSU). Dr. Lutzenhiser is a Professor of Urban Studies and Planning at PSU with a focus on behavioral studies related to energy and water use.
• Hugh Henderson, CDH Energy. Mr. Henderson has an extensive background in the monitoring and modeling of unitary HVAC equipment.
• Piotr Domanski, National Institute of Standards and Technology (NIST). Dr. Domanski is the HVAC&R Equipment Performance Group Leader at NIST.
• Marc Newman, Standard Refrigerators Inc. Mr. Newman is President of a firm that provides design, installation, and HVAC service to commercial and residential customers in New York City.
• Jim Braun, Purdue University. Dr. Braun is a professor in the School of Mechanical Engineering and has worked in the field of air conditioning and refrigeration for over 30 years in both university and industrial settings.
• Adrienne Thomle, Honeywell, Inc. Ms. Thomle is a Product Market Manager of Economizer Systems & Motors at Honeywell.
A draft of this study was circulated to stakeholders for review and many substantive and helpful comments were received. All substantive comments were carefully considered and changes have been made for this final draft. Out of respect for input from stakeholders and in the interest of transparency, footnotes are used to give credit to sources that are not in published documents. This allows the report to be current. Care was taken to ensure that the comments came from legitimate sources. Given the controversial nature of the subject and the need for more research, reasonable experts disagree. This report takes note of the disagreements but does not try to make final judgments as to who is right and who is wrong.
4
Refrigeration Cycle Analysis and RCA Programs
The refrigeration cycle is a complex thermodynamic process that is well understood in a laboratory setting resulting in the design and production of high-quality systems of increasing sophistication. Despite the fact that several studies of field performance have been done18,19, 20,21,22,23,24, field problems are still not as well understood as lab performance, given the wide
18 Davis, R. 2001. “Influence of Expansion Device and Refrigerant Charge on the Performance of a Residential
Split-System Air Conditioner using R-410a Refrigerant,” Report No.: 491-01.7. San Francisco, Calif.: Pacific Gas and Electric.
19 Downey, T., Proctor, J., 2002. “What can 13,000 Air Conditioners Tell Us?” Proceedings of the 2002 American
Council for an Energy Efficient Economy Summer Study on Energy Efficiency in Buildings.
20 Li, H.. “A decoupling-based unified fault detection and diagnosis approach for packaged air conditioners. Ph.D.
Thesis, West Lafayette, IN: Purdue University,” 2004.
21 Farzad, M., O’Neal, D. 1993. “Influence of the Expansion Device on Air Conditioner System Performance
Characteristics Under a Range of Charging Conditions.” Paper 3622. ASHRAE 2004 ACEEE Summer Study Proceedings I-226 Transactions. Atlanta, Ga.: American Society of Heating Refrigerating and Air-Conditioning Engineers.
22 Rodriguez, A., "Effect of Refrigerant Charge, Duct Leakage, and Evaporator Air Flow on the High Temperature
Performance of Air Conditioners and Heat Pumps," Master's Thesis, August 1995.
23 Siegel, J., Wray, C., "An Evaluation of Superheat-Based Refrigerant Charge Diagnostics for Residential Cooling
variety of installation issues, occupant impacts, improper service over time, and component degradation which contribute to a large degree of performance uncertainty. This section provides an overview of refrigeration system operation and performance issues, along with an analysis of current RCA program specifications and challenges.
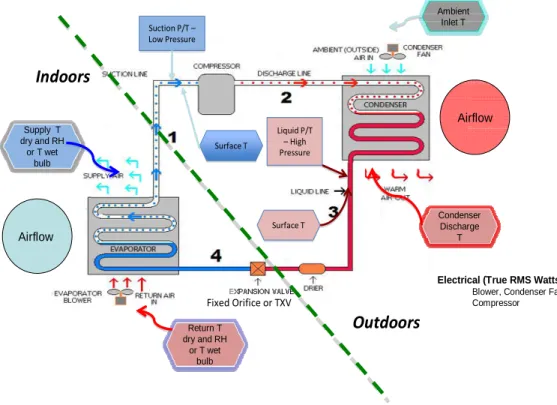
Figure 1 illustrates the key components of a unitary refrigeration system25. These components (compressor, condenser, evaporator, expansion device, fans, and controls) are generally separate in residential systems (split system with indoor and outdoor equipment), and typically
“packaged” for commercial rooftop units (RTUs). The numbers in Figure (1-4) refer to the four system states: 1) low pressure, cool vapor; 2) high pressure, hot vapor; 3) high pressure, warm liquid; and 4) low pressure, cold liquid that in turn becomes vapor again after the evaporator coil. Outdoor air cools the hot refrigerant gas at the condensing unit, causing the refrigerant to change phase from gas to liquid. The liquid refrigerant is forced through the expansion device (orifice or TXV) at which point the low pressure causes a fraction of the liquid to “flash” to vapor. At the indoor coil (evaporator), warm return air causes the rest of the liquid refrigerant to change to a gaseous state. During this phase change process, the return air is cooled at the evaporator, typically on the order of 18-22 °F. The low temperature refrigerant gas then enters the compressor where mechanical work raises the pressure and temperature of the gas.
24 Temple, K., Rossi, T., Field Diagnostics Services, Inc., “Enhanced Refrigeration Diagnostics for an Improved Air
Conditioning Tune-up Program,” ACEEE Summer Study, 2006Mowris, R., Blankenship, A., et. al, "Field Measurements of Air Conditioners With and Without TXV's," ACEEE Summer Study Proceedings 2004.
Vapor Compression Cooling
Vapor Compression Cooling
System Schematic with Measurements
System Schematic with Measurements
Outdoors Indoors Suction P/T – Low Pressure Suction P/T – Low Pressure Liquid P/T – High Pressure Liquid P/T – High Pressure Fixed Orifice or TXV Surface T Surface T Surface T Surface T Condenser Discharge T Ambient Inlet T Return T dry and RH or T wet bulb Supply T dry and RH or T wet bulb
Electrical (True RMS Watts):
Blower, Condenser Fan, Compressor
Airflow
Airflow
Figure 1. Unitary Refrigeration System Schematic.
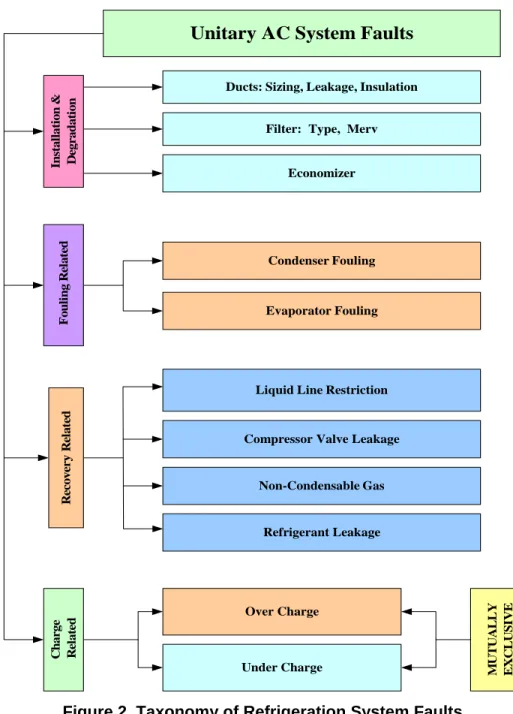
A key challenge in understanding refrigeration system performance is that there are many possible sources of degradation, some of which are more significant than others, and there is rarely an obvious indication which part (or often, parts) of the system is failing. Furthermore, there is a wide range of system performance characteristics encountered in the field which depend on ambient conditions, the load on the evaporator, and the fault status. In spite of the complexity of multiple faults and highly variable performance, HVAC technicians providing service calls are expected to improve system efficiency, often within a short scheduled time window. A systematic approach is needed to fully assess the current state of any HVAC system in the field. The flow chart shown in Figure 2, adapted from Dr. Haorong Li's dissertation on addressing multiple system faults26, illustrates the “taxonomy” of faults in an existing unitary
HVAC system.
26 p. 49, Li, Haorong, "A Decoupling-Based Unified Fault Detection and Diagnosis Approach for Packaged Air
Unitary AC System Faults C h arge Re la te d Over Charge Under Charge MU TU A L LY EX C L U S IV E
Ducts: Sizing, Leakage, Insulation
Filter: Type, Merv
Economizer
Compressor Valve Leakage Liquid Line Restriction
Condenser Fouling Evaporator Fouling Non-Condensable Gas Refrigerant Leakage F o u lin g R ela te d In sta llati o n & D egradati o n Re co v er y Re la te d
Figure 2. Taxonomy of Refrigeration System Faults
Multiple, simultaneous faults are possible, although some faults are insignificant and can be ignored. The extent of the problem with multiple faults is not well described in the literature, and experts disagree on the importance of multiple faults. Fortunately, there are commonly encountered faults such as coil fouling, contactor failure, capacitor failure, and, in the case of commercial RTUs, economizer failure that reduce the range of possible faults to a more workable list. A baseline study would serve to establish the range and distribution of fault conditions. Technicians ideally need a hierarchical screening process that starts with an assessment of installation and degradation, continues with visual inspections, and eventually addresses refrigerant charge. The process must be fast and cost effective. A technician in a comprehensive maintenance program, or a diagnostic system directing the technicians’ efforts,
would need to be able to do all parts of the screening and not just the charge-related items. Such a system needs to save time while minimizing misdiagnosis.
This process is complicated by the fact that technicians often do not have remote access to manufacturer data specific to the system, which would save time and potentially improve the accuracy of the diagnosis. Examples of data from manufacturers are: compressor performance map; superheat values; subcooling values; rated EER; blower performance; amperage draw for various components; charge for weighing in with long line adjustments; fault codes; and wiring diagrams. Some of this data is on the equipment or in a document that is intended to be left with the unit but, especially on older units, the data is missing. Service is competently done everyday without complete information but this is not the preferred situation. Energy efficiency programs add the challenge of optimizing system energy efficiency, which is not standard practice for technicians who often lack the training and instruments required to perform the necessary tasks.
4.1 RCA Program Issues
In past RCA programs the only service required to be performed was to check and adjust the refrigerant charge after verifying the supply airflow27 across the evaporator coil is adequate. Some VSPs require their contractors and technicians to do more than the program minimum and require that technicians are competent to do the complete range of service functions. The charge is checked by considering only one of a half dozen key indicators of refrigerant cycle
performance.
Other factors such as condenser and/or evaporator coil fouling (as shown in Figures 3 and 4) have significant impacts on system efficiency and whether the charge is correct. Figure 3 shows an extreme example of a residential condenser coil fouling from lawn clippings28, followed by pet hair and dirt.
27 Using the “temperature split” method (difference between supply and return air temperature) 28 Image from http://desertcomfortmechanical.com/air_conditioning_repair_and_maintenance
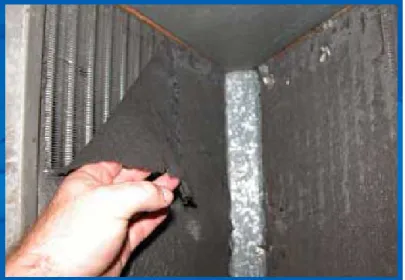
Figure 4 shows heavy evaporator coil fouling29, which is most common on systems with floor (or low wall) returns, especially in homes with cats and dogs. It can be difficult if not impossible for technicians to access and clean evaporator coils; contractors report having to cut access holes when none are provided. A VSP estimates that less than 1% of residential split system
evaporator coils are accessible and that “only 0.4% of the evaporator coils get cleaned” even when there is a $40 incentive available30. There are various spray products that work with condensate to clean and wash away debris on the evaporator coil. Technicians need a simple diagnostic to determine whether either coil needs to be cleaned and then a procedure that
instructs them on how to clean coils as part of QM servicing. Without this guidance it is possible for a program to “devolve from a comprehensive program to a condenser coil cleaning program only”31.
Laboratory tests32 conducted on systems with condenser and evaporator coil blockages have shown that coil blockage has a significant impact on system performance, with condenser airflow blockage having more of an impact than evaporator coil blockage at the same level of blockage. Evaporator fouling is more commonly found because, especially in residential split systems, the time and expense needed to properly clean them is prohibitive. In the lab, blockage is simulated by reducing airflow with panels. In the field, fouling not only blocks airflow but also coats coil surfaces, changing the heat transfer characteristics. The relationship between lab tested blockage and coil fouling in the field has not been established. Newer, high efficiency air conditioning units typically have narrower evaporator coil fin spacing, making it easier for coils to foul and harder to clean. As seen in the picture, a wet coil makes a very effective filter.
29 Image from http://losangelescountyheating.com/
30 PEG comments on 112310 Study Draft submitted to Brett Close, SCE.
31 PEG comments on 112310 Study Draft submitted to Brett Close, SCE. The condenser approach temperature
could be used and is straight forward to implement.
32Faramarzi, R., Rauss, D., "An Experimental Approach to Quantify Effects of Common Maintenance Strategies for
5-Ton Rooftop Units," ASHRAE 2010 Annual Meeting – Orlando Seminar 6 (Sponsored by TC-8.11) January 24, 2010, Technology Test Centers (TTC) Southern California Edison www.sce.com/rttc
Airflow evaluation needs to involve more than just making sure that the temperature split (difference between supply and return air temperature) is within a reasonable range. The Duct Test and Seal (DTS) programs require total duct leakage be reduced so that it is equal to or less than 15% of total flow with the assumption that there is 400 cfm/ton of air conditioner capacity. This in line with Title 24 2008 requirementsimplemented in the “Simplified Prescriptive
Certificate of Compliance: 2008 Residential HVAC Alterations CF-1R-ALT-HVAC” form33. If a duct system is undersized sealing the leaks can reduce the airflow to the extent that the temperature split is significantly changed. RCA and DTS programs have not been linked allowing the RCA technician not to be concerned with leakage and the DTS technician not to be concerned with airflow. While direct measurement of airflow through the evaporator coil is allowed as an alternative to the temperature split test, this method is rarely done Measuring airflow with a flow metering plate34 is slowly gaining acceptance in residential applications but contractors and technicians are resistant because of the cost of equipment and the time that it takes to make the measurement.35
4.2 RCA Program Specifications
Using laboratory data,36 Title 24 RCA testing specifications37, and the results of field research38 the Architectural Energy Corporation (AEC) developed the “Technical Specifications and Best Practices for Charge and Air Flow Verification Services”39 for the Pacific Gas & Electric Company (PG&E) that were used by the IOUs for the 2006-2009 RCA and DTS programs. The specifications provided for qualified VSPs to sign contracts with IOUs and gain approval to implement the RCA program. Technicians are required to have a US EPA refrigerant handling certification and training “including but not limited” to the following:
Customer interaction
Equipment calibration procedures
Test procedures
Data collection procedures
Calculation and/or procedures required to determine pass-fail test status
Charge and airflow correction procedures.
Measurement equipment requirements are focused on hand-held devices and the manual
recording of readings in the field. Existing California Title 24 RCA procedures are used for the
33 pdf page 450 of 563, California Energy Commission, 2008 Building Energy Efficiency Standards Residential
Compliance Manual, CEC-400-2008-016-CMF-Rev1, March 2010.
34http://www.energyconservatory.com/download/trueflow.pdf
35 PEG comments on 112310 Study Draft submitted to Brett Close, SCE.
36 Davis, R., D'Albora, E.. “Influence of Expansion Device and Refrigerant Charge on the Performance of a
Residential Split-System Air Conditioner using R-410a Refrigerant” Report No.: 491-01.7. San Francisco, Calif.: Pacific Gas and Electric, 2001.
37 Appendix RD, Residential Alternative Calculation Method (ACM) Approval Manual for the 2005 Building
Energy Efficiency Standards, CEC 400-003-003F, October 2004. Reference is also made to manufacturer (e.g. Carrier, Lennox, and Trane) guidelines as the source for the T24 methodology.
38 Downey, T., Proctor, J., 2002. “What can 13,000 Air Conditioners Tell Us?” Proceedings of the 2002 American
Council for an Energy Efficient Economy Summer Study on Energy Efficiency in Buildings.
39 Residential Air Conditioner Charge and Air Flow Verification Study, Task 4 Report, Technical Specifications and
Best Practices for Charge and Air Flow Verification Services, Contract # 4600010737, Revision 2, Architectural Energy Corporation, for PG&E, August 19, 2004.
purpose of determining whether the refrigerant charge is adequate, and if not, for adding or removing charge to achieve the required superheat or subcooling, as per program requirements. Unstated in AEC’s specifications for the RCA program is the assumption that other HVAC system faults are either not present or are not impacted by the charge adjustment and that they do not eliminate the savings achieved by charge adjustment. RCA procedures follow the Title 24 guidelines which in the 2008 version use Table RA3.2-3 Target Temperature Split which covers return air dry-bulb conditions from 70 oF to 84 oF paired with return web-bulb conditions from 50 oF to76 oF. For superheat determination there must be at least 5 degrees. Referring to Table
RA3.2-2 Target Superheat40 if the outdoor temperature is below 65 oF then the indoors must be at least 70oF. The table goes down to an outdoor temperature of 55 oF with an indoor return wet bulb of 50 oF which can be done so long as the return dry bulb is 70 oF. These limitations have proven to be a problem especially when RCA work is done before and after the summer season. Outdoor temperatures up to 115 oF are allowed but over 100 oF require return wet-bulb
temperatures that can be difficult to reach in hot dry climates.
Temperature Split: Table RA3.2-3 is used to look up the required temperature split based on the operating conditions, and the measured value must be within ±3 degrees of the reference value listed for the airflow to be considered adequate. The temperature split test does not measure airflow or ensure that at least 350-400 cfm/ton is flowing through the evaporator.41 It establishes that there is an adequate balance between the quantity of refrigerant flowing through the evaporator coil, changing phase from liquid to gas as heat is absorbed, and the quantity of air flowing across the evaporator coil42 that is being cooled be the refrigerant phase change.
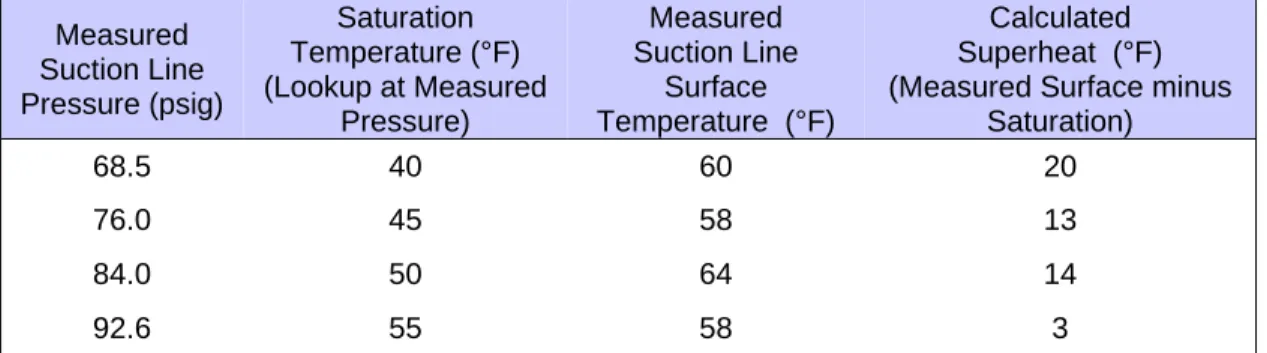
Superheat: If a fixed orifice refrigerant expansion valve is used the superheat is calculated to determine adequate refrigerant charge. Superheat is based on measuring the pressure of the suction line and the surface temperature of the suction line. Fixed orifice (FO) expansion valves come in a variety of forms, none of which change size in response to operating conditions. Refrigerant mass flow rates do however vary in response to the pressure dynamics as driven by conditions at the evaporator and condenser. Charging is based on achieving the correct amount of superheat given the indoor and outdoor conditions and the value is found in Table RA3.2-2. The charge is considered correct if the superheat is within ±5 oF of the target value found in the
Title 24 superheat table. Each refrigerant type has a temperature/pressure relationship that converts a pressure reading to the matching temperature, as shown in Table 1.
40 pp. RA3-18 to RA3-20, California Energy Commission, Reference Appendices for the 2008 Building Energy
Efficiency Standards for Residential and Nonresidential Buildings, CEC-400-2008-004-CMF, December 2008.
41 Metoyer, J., Swan, E., McWilliams, J. "HVAC Airflow Measurement Issues for Programs and Evaluators,"
KEMA, 2010
42 It is possible to reduce refrigerant flow and airflow in tandem to achieve the desired temperature split while
Measured Suction Line Pressure (psig) Saturation Temperature (°F) (Lookup at Measured Pressure) Measured Suction Line Surface Temperature (°F) Calculated Superheat (°F) (Measured Surface minus
Saturation)
68.5 40 60 20
76.0 45 58 13
84.0 50 64 14
92.6 55 58 3
Table 1. Example R-22 Superheat Calculation
Subcooling: When a thermal expansion valve (TXV) is present, subcooling is calculated to assess whether the refrigerant charge is correct. A TXV has a sensing bulb attached to the refrigerant line exiting the evaporator coil. The sensing bulb is charged with a gas whose
expansion and contraction in response to pipe surface temperature results in modulating the TXV valve, thereby adjusting refrigerant flow. A TXV is sometimes referred to as a constant
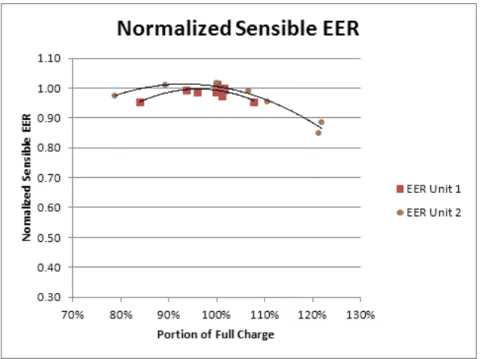
superheat valve. Manufacturers specify the subcooling value for the system, but when it is not easily available; a default of 10 oF is often used even though manufacture values will vary widely with little impact on EER, making it a useful default value. Given the discussion at the Technical Forum it would be good to explore this issue further. The charge is considered correct if the calculated subcooling is within ±3 oF of the target value. But, as shown in Figure 5 in lab testing on two systems, in support of proposed Title 24 changes, “efficiency varied less than 5% over a range of subcooling from 2 oF to 21 oF”43. This testing and other testing being done at Intertek in 2010 could have significant impacts on our understanding of how to implement refrigerant charge correction measures.
43 PEG comments on 112310 Study Draft submitted to Brett Close, SCE from “Measure Information Template –
Residential Refrigerant Charge Testing and Related Issues”, 2013 California Building Energy Efficiency Standards, California Utilities Statewide Codes and Standards Program, December 2010.
Figure 5. Variance of Normalized Sensible EER v. Subcooling
The process steps that a technician is required to follow are detailed in Sections 2.4.3 Non-TXV and 2.4.5 TXV.44 The temperature split must be corrected before charge can be checked and adjusted as required. In the case of systems that are far from having correct charge and airflow a sequential approach does not work. Rather, the technician must iteratively adjust airflow and charge. Both the airflow and charge must be re-tested until they both sequentially pass.”45
Direct airflow measurement is allowed but not required. Coil, either evaporator or condenser, cleaning is not addressed. Filters are to be considered if the temperature split is high. While this approach makes sense for new equipment covered by Title 24, it ignores the “as found”
condition of air conditioners if only the program minimum requirements are met. In some applications filters must be changed monthly and condenser coils cleaned quarterly.
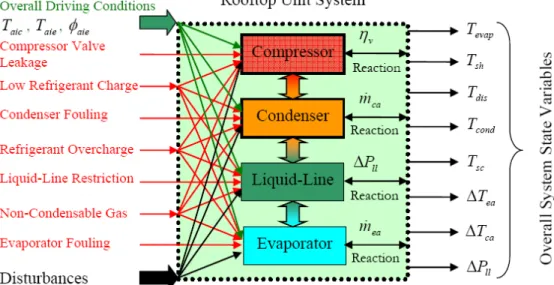
Referring back to the taxonomy of fault conditions it is the case that if a technician is only doing the minimum by the RCA program specifications then only charge is checked. All that is needed is to have indoor and outdoor conditions within a broad range of conditions and the machine capable of running for 30 minutes producing air that is cooled about 20 degrees across the evaporator coil. This is a simplification of the complex operation of an air conditioner. It allows narrowly trained technicians to perform the RCA service quickly without regard to the multiple fault conditions that may be found in many systems. The complexity of the interactions is best illustrated by Figure 6 from H. Li46. Only a few of the possible faults on the left hand side impact just one component in the system and refrigerant charge, either high or low, impacts all of the components.
44 p. 8 – 12, Architectural Energy Corporation, Residential Air Conditioner Charge and Air Flow Verification Study,
Task 4 Report, Technical Specifications and Best Practices for Charge and Air Flow Verification Services”, Contract # 4600010737, Revision 2, PG&E, August 19, 2004.
45 p. 11, AEC Task 4, 2004. 46 p. 51, H. Li, 2004.
Figure 6. Complex RTU System Interactions
There is no consensus as to how to address multiple faults. In reviewing comments on this report, Field Diagnostic Services Inc. noted the following:
Using the charging chart to calculate the superheat goal or comparing the subcooling to the manufacturer’s specification are an implied “no fault” model of expected
performance. A “no fault” model that predicts the evaporating temperature and
condensing temperature over ambient goal values for a system of a specific design under specific driving conditions is essential to evaluating the complex operation of an air conditioner. Resolution of faults and degradations that impact evaporating temperature and condensing temperature over ambient is essential prior to charge adjustment based on superheat and subcooling.47
Comments from Proctor Engineering Group caution that it is not practical or necessary to resolve all faults. The RCA service “does not claim to be able to diagnose all possible faults, but it does diagnose the most common faults that have a significant impact.”48 We did not find adequate field test data to definitively settle this difference of opinion even though such a research study would be valued by all stakeholders.
5
Duct Systems and DTS Programs
The performance of residential duct systems has been extensively tested over the past 20 years with numerous studies49 documenting the inefficiencies associated with ducts outside of
conditioned space, such as those located in attics. Total duct leakage levels of 35-40% of system fan flow (at 25 Pascal pressure or 0.1 IWC) are fairly common in these prior studies. Duct leakage results in significant system inefficiency due to reduced space conditioning capacity,
47 FDSI comments on 112310 Study Draft submitted to Brett Close, SCE. 48 PEG comments on 112310 Study Draft submitted to Brett Close, SCE.
49 See: Kinert 1992, Palmiter and Francisco 1994, Jump 1996, Coito 1998, Lerman 1998, Walker 1998, Modera
with resulting peak demand impacts. The Duct Test and Seal programs implemented during the 2006-2008 time period were designed to reduce leakage in existing systems to 15% of total airflow or to reduce leakage by 15% of total system airflow. Duct pressurization tests were required before and after sealing with the results being reported to the VSP overseeing the contractor’s work.
According to the California Residential Appliance Saturation Survey (RASS),50 only about 37% of homes built before 1975 have central air conditioning (CAC). Slightly over 70% of the homes built between 1983 and 1992 have CAC. By 2001, 84% of new homes had CAC. Coincident with increased air-conditioning penetration, construction practice has moved towards slab-on-grade construction for virtually all California production homes built in the last 25 years. As a result, ductwork has become almost exclusively installed in the attic space where it is exposed to very hot and cold temperatures.
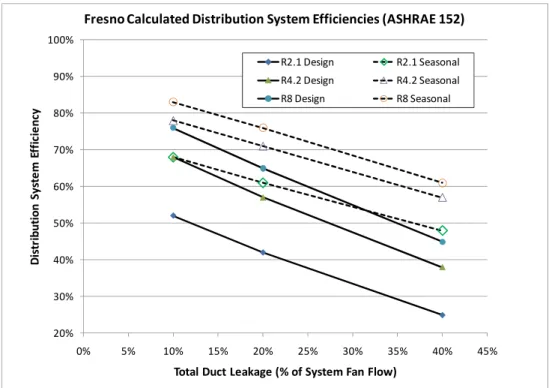
Duct insulation levels have increased over the past few years, but most pre-1991 homes have duct insulation levels of only R2.151 As shown in Figure 7 analysis using the ASHRAE 15252 calculation methodology, increasing R2.1 duct insulation levels to R8 in a Fresno, CA home would generate similar seasonal duct efficiency improvements as reducing duct leakage from 40% to 20%. Losses are particularly high during peak day cooling events, when the temperature difference across the ducts can exceed 70 °F (with attic air at 130 °F and cool ducted air at 60 °F). Duct leakage compounds the duct heat loss to unconditioned space, by increasing the length of air conditioner run cycles due to the energy loss between the indoor unit and the supply
registers. This effect is most pronounced during peak heat spells, when attic return leakage increases the load on the air conditioning system and the supply duct thermal losses are greatest.
50 p. 23, Figure ES-23, 2009 California Residential Appliance Saturation Study, Executive Summary,
CEC-200-2010-004-ES, KEMA, October 2010.
51 Table R3-50 on page 3-81 of the 2008 Title 24 ACM has assumptions based on house vintage. http://www.energy.ca.gov/2008publications/CEC-400-2008-002/CEC-400-2008-002-CMF.PDF
52 ANSI/ASHRAE Standard 152-2004, Method of Test for Determining the Design and Seasonal Efficiencies of Residential
20% 30% 40% 50% 60% 70% 80% 90% 100% 0% 5% 10% 15% 20% 25% 30% 35% 40% 45% Di str ibuti o n Sys te m Ef fi ci e n cy
Total Duct Leakage (% of System Fan Flow)
Fresno Calculated Distribution System Efficiencies (ASHRAE 152)
R2.1 Design R2.1 Seasonal R4.2 Design R4.2 Seasonal R8 Design R8 Seasonal
Figure 7. Duct Leakage Impacts on Distribution Efficiency
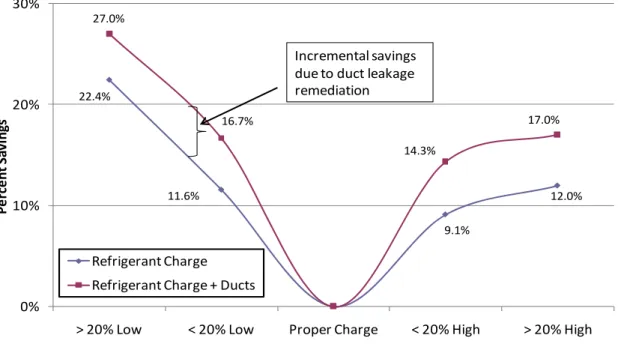
The combined impact of leaky and poorly insulated ducts can result in seasonal distribution efficiencies of 50% or less. Ideally, duct systems should be relocated to conditioned space or totally eliminated (ductless delivery systems), but realistically the best solutions involve duct leakage remediation and the addition of more duct insulation (and/or burying ducts under the blown-in attic insulation). Either manual sealing (with mastic, tape, and draw bands) or use of the aerosol duct sealing approach have been shown to reduce leakage by 50-80%53 with aerosol techniques offering the advantage of sealing inaccessible leaks.
Duct leakage can occur on the system's supply side, return side, and at the air handling unit itself.54 A duct test using a duct pressurization fan55 is the standard approach to testing for duct leakage. By pressurizing the duct system to a standardized level (typically 25 Pascals or 0.1 Inches of Water Column, IWC), leakage can be normalized either to a “per square foot of living area” metric or as a percentage of system fan flow (the latter typical for California). The percent air leakage is calculated in comparison with an industry standard airflow rate of 400 cfm/ton, which is an unrealistically high number for most installations. Alternative duct leakage measurement techniques --such as pressurizing at one-half of measured duct system static pressure, using tracer gas, and the Delta Q method56--are potentially more accurate, but
considerably more involved for any type of production program. Another method called the Zone
53 See Jump 1996, Kallet 2000
54 p. 2, Walker, I., Dickeroff, D., Delp, W. "Residential Forced Air System Cabinet Leakage and Blower
Performance," LBNL 3383E, PIER Final Project Report, CEC-500-07-006, December 2008.
55 The Energy Conservatory and Retrotec are two leading manufacturers of duct pressurization equipment and are
found at: www.energyconservatory.com/products/products2.htmand http://www.retrotec.com/products/duct_testing_systems/q32_ductester/
DeltaP test has been proposed that addresses the artificially uniform pressure issue using inflatable bags inserted inside the duct system to test different parts of the system.57 In the 1990s, interest among DOE and HVAC industry experts led to the development of ASHRAE Standard Project committee 152P to develop a detailed duct efficiency calculation methodology. The resulting ASHRAE 152 Standard was developed at LBNL with input from numerous parties. The standard prescribes algorithms for the calculation of duct delivery efficiency based on duct surface area and location (e.g. attic, crawlspace), duct leakage and insulation levels, climate, and other factors. The methodology has been tested in the field58 and
was found to provide good agreement with field monitoring data.
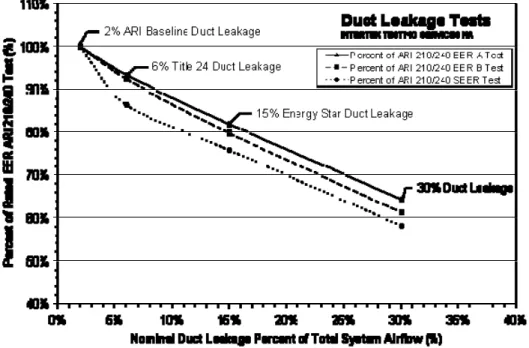
Testing done at the Intertek Laboratory in Plano, Texas59 (Figure 8) under the direction of Robert Mowris provides insight into the impacts on efficiency of duct leakage when ducts are located in attics.
Figure 8. Percent of AHRI Tests v. Nominal Duct Leakage for Ducts Located in Attics60
The EER A test is at 95oF while the EER B test is at 82oF which shows how a hot attic impacts the EER. The attic is simulated with a chamber held at just under 120oF which is possible even
57 p. 1, Moujaes, S., Nassif, N., Teeters, T. et. al, "Duct Leakage Measurements in Residential Buildings," Final
Report NCEMBT-080215, University of Nevada Los Vegas, February 2008.
58 Siegel, J., McWilliams, J., Walker, I. 2002. “Comparison Between Predicted Duct Effectiveness from Proposed
ASHRAE Standard 152P and Measured Field Data for Residential Forced Air Cooling Systems.”
59 http://www.intertek.com/news/2009/11-09-hvac-facility/
60 p. 8, Mowris, Robert, Verified Inc., Evaluation Measurement and Verification of Air Conditioner Quality
on mild weather days. It is also notable that duct leakage at an all too probable 30% has a much greater impact than a 40% undercharged system.61
5.1 Duct Testing Protocols and Sources of Error
Typical system operating pressures are up to five times higher in the supply plenum and up to five times more negative in the return plenum than at leakage test conditions (25 Pa). At the terminals, both supply and return, the pressures can be very low. Thus, the current test tends to overvalue leakage that occurs far from the air handler, and undervalue leakage at the air handler where operating pressures are greatest. This effectively directs remediation efforts equally throughout the distribution system62, resulting in less emphasis at the furnace/plenum
connections where the driving force is the greatest. Establishing a prescriptive requirement for technicians that they must first seal the connections and joints at furnace/air handler unit and the adjacent supply and return plenums could address this testing error. It is possible that an
aggressive set of prescriptive requirements will eliminate the need for testing in those cases where the duct system is largely exposed but they must be accompanied by an effective quality control program.
According to Gary Nelson, founder of diagnostic equipment manufacturer The Energy Conservatory, duct leakage measurement repeatability can be affected by several factors, including the level of duct leakage, placement of the duct pressurization device and static pressure sensor, and the sealing technique at the registers63. In high leakage systems, the placement of the equipment and pressure sensor could result in deviations in leakage
measurements of up to 15%64, when the same measurement device is used in different locations. In relatively tight duct systems, common to homes and commercial systems that have
61 For complete information see : Draft Report – Evaluation Measurement and Verification of Air Conditioner
Quality Maintenance Measures, prepared by VERIFIED, Incorporated, James J. Hirsch & Associates, and Intertek Testing Services (North America) under the auspices of the California Public Utilities Commission, April 2010. Robert Mowris summarizes the work as follows. Laboratory measurements of HVAC maintenance and installation measures were performed by Intertek Testing Services, an AHRI Certified laboratory, located in Plano, Texas. Testing was performed on a new split-system air conditioner with rated cooling capacity of 36,000 Btu/hour (3 tons) and matching condenser and evaporator coils with an AHRI rating of 13 SEER and 11.2 EER (per ARI 210/240). The air conditioner was tested with R22 refrigerant and five expansion devices including 1) original equipment manufacturer (OEM) piston metering valve (non-TXV), OEM pressure-equalizing thermostatic expansion valve (TXV), OEM hard shut-off TXV, non-OEM HSO TXV, and non-OEM electronic expansion valve (EXV). The forced air unit, evaporator, TXV, and ducts were located in a chamber maintained at conditioned space temperatures of 80F dry bulb and 67F wet bulb (per ARI 210/240) and 118F dry bulb and 78F wet bulb to simulate a hot attic. The following conditions were evaluated: 1) baseline 3-ton system per the ARI 210/240 test standard, 2) hot attic
environment around components, 3) 25 and 50 feet line-set, 4) correct refrigerant charge, under charge of -5% to -40%, and over charge of +5% to +40% with a piston (non-TXV) and TXV metering devices, 5) evaporator airflow from 250 to 400 cfm per ton, 6) duct leakage of 2%, 6%, 15%, and 30%, 7) various TXV sensing bulb installation conditions including one strap, two straps, one insulation wrap with 50% overlap, and two insulation wraps with 50% overlap, 8) 30% to 80% condenser coil blockage, 9) 50% evaporator coil blockage, 10) combined or mixed measures, and 11) non-condensibles. Additional tests will be performed to measure the energy efficiency impacts of refrigerant restrictions and expanded superheat and temperature split target values. The Intertek test results indicate that HVAC maintenance and installation defects can significantly reduce air conditioning cooling capacity and energy efficiency.
62 Register boots are a common area that is sealed with the standard duct pressurization test. Although important,
other higher pressure parts of the system must be targeted.
63 A smaller concern relates to calibration of the digital manometers used with the equipment. Mr. Nelson estimates
that only 10% of the manometers in the field are returned for regular calibration. Although this is a low percentage, virtually all are found to be within spec, with less than half a percent of the manometers being out of spec by more than 5%.