management
Judith Chapman
T
he classic blood supply chain (Fig. 1) travels from the donor through all aspects of process-ing, testprocess-ing, and issue in the blood service to the hospital blood transfusion laboratory and ends with transfused patients. It is a chain because patient demand affects how many donors may be called. Short-ages occur when supply does not meet demand, and in this situation the patient’s requirements for blood may be compromised, so it is important that blood supply chain management is effective and all parts of the chain work together to complement each other.It has been found that highly effective supply chains rely on three elements: time—timely provision of the product; transparency where all parts of the supply chain have visibility; and trust, which is derived from transpar-ency.1Having poor data management means leaving key
decisions to chance. Access to key supply chain data are essential for our understanding of the blood supply chain, for improving blood inventory management practice, and for performance evaluations.
THE PURPOSE OF THE BLOOD STOCKS
MANAGEMENT SCHEME (BSMS)
In England, Wales, and Northern Ireland, blood supply data are collected by the BSMS from hospitals and the blood services. The Scheme is a partnership between hos-pitals and the blood services with the purpose of collect-ing from and providcollect-ing them with information on various
aspects of blood inventory management.2The Scheme’s
data management system acts as a data repository, and over time a huge amount of data has been acquired. Its purpose is also to lead best practice in blood inventory management both in the hospitals and in the blood service, as well as to facilitate benchmarking of the UK blood services and hospital performance and to develop appropriate guidelines and recommendations; the latter is a more recent development. Originally, there was insuf-ficient data to compare performance with practice; however, now that 6 years of data is available, evidence-based inventory management practice can be assessed and guidelines and recommendations can be written.
HOW DOES IT WORK?
The Scheme fulfills its purpose through the use of a web-based data management system, VANESA, an acronym for Vital Appropriate Knowledge (silent K) Empowers Stock Analysis.
Communication with participants is essential and occurs in a variety of ways, including through the website http://www.bloodstocks.co.uk, VANESA, regular reports that are sent to participants, regional participant meet-ings, and annual meetings.
An annual survey of blood inventory management practice is also carried out, examining a variety of aspects of blood supply management, including red blood cell (RBC) and platelet (PLT) inventory management practice, cold chain management, and the level of blood group sub-stitution.
Regular VANESA training days, “VANESA 4 Dummies,” and education days, “VANESA 4 VIPs,” are held. These enable participants to familiarize themselves with the software and to learn about best practice in blood inventory management.
The Scheme is run by a team of four—a manager and three data analysts, one of whom also has responsibility for liaison with the hospitals and training. The National Blood Service (NBS) information technology department provides the software development and support.
There is an Operations Group made up of hospital and blood service representation, which is a sounding board for new ideas and provides feedback to and from ABBREVIATIONS:BSMS=Blood Stocks Management Scheme;
ISI=issuable stock index; NBS=National Blood Service;
VANESA=Vital Appropriate Knowledge Empowers Stock
Analysis.
From the National Blood Service, London, UK.
Address reprint requests to:Jim MacPherson, America’s Blood Centers, Washington, DC; e-mail: jmacpherson@ americasblood.org.
Received for publication November 6, 2006; revision received February 27, 2007, and accepted March 15, 2007.
doi: 10.1111/j.1537-2995.2007.01384.x
participants on VANESA. The Operations Group in turn reports to a Steering Group, which together with the staff team provides the strategic direction for the Scheme. The steering group reports to the UK Forum, which provides the funding. It also reports to the NBS senior management team, which, in turn, reports to the National Health Service Blood and Transplant board, which ultimately reports to the Department of Health.
The data management system is a web-based system collecting data via the Internet in a Sequel Server (Microsoft, Redmond, WA) database. The system facili-tates the collection of hospital and blood service stock wastage and transfused data for RBCs and PLTs, and it allows benchmarking of performance. It calculates the “issuable stock index (ISI),” which is an approximation of one day’s worth of blood stock, wastage as a percentage of issues, and the shelf life of the stock that is issued to the hospitals. It provides online, real-time data and charts, both to the blood service and the hospitals that use it.
DATA COLLECTION
Hospitals supply data through the web pages of their daily unreserved stock, their daily or monthly wastage (with four reasons for the wastage of RBCs, and six for PLTs), and the number of monthly transfused units. For consistency, it is recommended that hospitals go online and provide their stock data after their daily distribution of issued units and before the main order from the blood service arrives.
The blood services have an automated daily data feed into VANESA on RBC stock, RBC and PLT issues, RBC and PLT wastage, and the age of stock at issue.
The data that are collected are con-fidential to the BSMS staff but anony-mized to other participants. Hospitals can agree between themselves to de-anonymize and share their data with other participants or with regional transfusion committees. Indeed, the Northern Ireland hospitals share their information with each other and with the Northern Ireland Blood Service. Some of the English hospitals have also agreed this principle.
THE WEB PAGES
The home page of the BSMS website (Fig. 2) contains a wide range of infor-mation on blood inventory manage-ment for both hospitals and the blood services. This is also the portal through which hospitals access VANESA, the data management system.
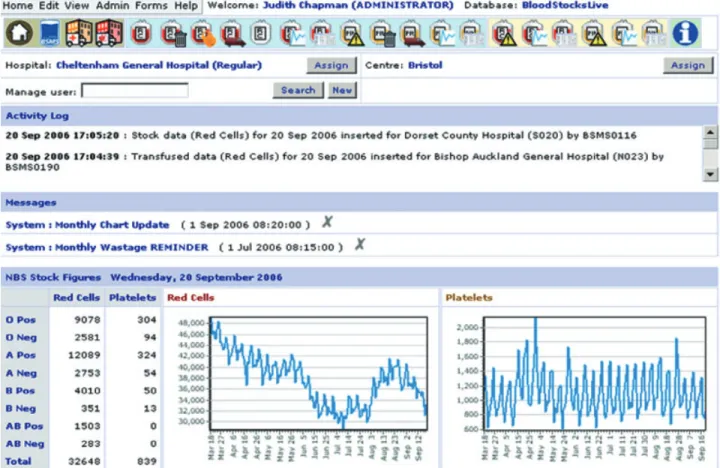
The hospital home page (Fig. 3) also contains a variety of information, including an activity log for the hospital’s interactions with VANESA, a messaging service, and the NBS stock figures for RBCs and PLTs that were posted at 8am. Welsh hospitals can view the Welsh Blood Service stock figures, and Northern Ireland hospitals can view the Northern Ireland Blood Service figures.
The icons at the top of the VANESA home page give access to the various data entry, chart, and data pages in VANESA (Fig. 4). Online help is also available.
The hospital’s stock data entry page (Fig. 5) shows information related to stock and the stock data entry fields. Data for unreserved stock figures are entered by tabbing down the fields in the stock entry column. There is a column for impacts where the receipt of older than acceptable blood or shortages of particular groups can be identified. Comments can also be entered; for instance, a comment could be made if the hospital had ordered excessive amounts of B positive because they had a patient of that group who was bleeding heavily. The information would enable the BSMS team to understand the reasons behind abnormal group levels.
The RBC wastage page (Fig. 6) facilitates the collec-tion of RBC wastage by four reasons: time expired, out of temperature control, miscellaneous, and fridge failure. The Scheme identified early on that there were a number of occurrences of fridge failures both in hospitals and in the blood services and therefore fridge failure data collec-tion was introduced in the last software version release.
The wastage columns add up as the month progresses and eventually give total figures for wastages and as a per-centage of blood issued. There is a zero wastage button if the hospital does not have any wastage to record.
Fig. 1. The blood supply chain.
The key to the power and success of the Scheme are the charts that are available to the hospitals and the blood services. Figure 7 shows the listing of those available for RBCs. The data can be sorted by a variety of categories for individual hospitals. For example, hospitals that have hematology oncology as a specialty can benchmark them-selves against other hospitals that have this specialty. Figure 8 shows wastage data for a selected hospital against a benchmark group of hospitals. The charts can be potent drivers for improving performance because hospitals can measure themselves against their peers.
USE OF THE DATA
The NBS center that supports the hospital can use the data for demand forecasting, for determining appropriate inventory levels, for contingency planning, and in blood supply chain management, because all the data across the supply chain are accessible.
In addition to monitoring their own data and bench-marking against others, hospitals may use the data for reporting to their hospital transfusion committee and for informing laboratory staff. Feedback from participants indicates that they use the information to change their blood inventory practice. Some of them have used it for validating changes in practice and for contingency planning.
IMPACT ON HOSPITAL PRACTICES
The changes that have been made in practice in hospitals include the introduction of stock management training and written Standard Operating Procedures related to ordering and inventory management. Stock rotation has been introduced with blood, with the earliest expiration placed at the front of the fridge to be used first, and the newest at the back.
Some hospitals have introduced stock movements between themselves, e.g., private hospitals with National Health Service hospitals and larger hospitals with smaller hospitals. This has led to a reduction in wastage in the smaller hospitals. Many hospitals have reduced their inventory levels because they found that they were holding too much blood when they compared them-selves with their peers.
One hospital, which has hardly any wastage, has attributed their low wastage level to a “Stock Expiring” notice board on the front of the fridge that lists the units that are going out of date over the next 2 days.
A 24-hour crossmatch reservation period and electronic issue have been found to reduce the amount of blood that hospitals hold in their inventory.3
The data also facilitate a picture of the blood supply chain across the hos-pitals and the blood service (Fig. 9).3The
solid line in the middle of the chart is the ISI, i.e., the number of days’ worth of stock held for all the hospitals in the Scheme that are supplied by the NBS. The ISI is relatively stable at around 5.5 days. The broken line with diamonds is hospital wastage as a percentage of issue. The solid top line with triangles is the NBS ISI and the broken line with squares is NBS wastage as a percent-age of wastpercent-age. A relationship between the blood service stock level and wastage has been identified, and the chart shows that they mirror each other. This is helpful in deter-mining appropriate stock levels.
Fig. 3. Example of a hospital home page.
Hospital
Red cell stock Red cell wastage Red cell reserved stock Red cell movements Red cell graphs Red cell dataHospital
Platelet impacts Platelet wastage Platelet movements Platelet graphs Platelet dataBlood service
Red cell impacts Red cell charts Red cell data Platelet impacts Platelet charts Platelet dataH
e
l
p
Fig. 4. VANESA icons on hospital home page.
Fig. 5. Stock data entry page.
LESSONS LEARNED
What lessons have been learned in the five and a half years of the Scheme? Buy-in by both hospitals and blood ser-vices has been essential for the success of the Scheme. When the Scheme started, only 145 out of 300 hospitals supplied by the NBS voluntarily participated. Now 297
hospitals supplied by the NBS, all of the Northern Ireland hospitals, and about three-quarters of the Welsh hospitals are participating. This shows the success of the Scheme in building trust with hospital participants.
It was essential that there was a partnership philoso-phy from the start so that hospitals have an equal say in the operations of the Scheme as much as the blood ser-vices do. This too has been critical to obtain hospital support for participation.
A staged approach is also important. The Scheme started relatively simply, collecting only data on RBCs. Later, PLT and transfused data collection was introduced. This approach has paid dividends with the development of a culture of trust between participants and the Scheme. It was also important that somebody who knew about hospital transfusion practice managed the Scheme, and that it has been kept fresh with a planned program of developments over the five and a half years of operation.
For effective supply chain management, the elements of time, trust, and transparency were identified as being important. The data and information that the Scheme has accumulated has enabled trust to be developed between the blood service and hospitals and the Scheme, and transparency has been gained from knowledge. Data from
Fig. 7. Hospital chart options page.
Benchmark group Selected hospital
Sep 2005 Oct 2005 Nov 2005 Dec 2005 Jan 2006 Feb 2006 Mar 2006 Apr 2006 May 2006 Jun 2006 Jul 2006 Aug 2006
Month 0%
1% 2% 3%
Wastage as a Percentage of lssue
Fig. 8. ABO RBC wastage as a percentage of issue hospital versus benchmark group.
across much of the supply chain from the hospitals and the blood service is now available and accessible.
FUTURE DEVELOPMENTS
There are a number of future developments. Currently, hospitals manually enter their data. An automated down-load of the data is being developed and piloted. Geo-graphical expansion of the Scheme will also occur, with Scotland and Eire joining in the near future.
It is intended to expand the data collection portfolio to include blood supply data and clinical information, so that there is access to information across the whole supply chain. The dif-ficulty with clinical information is the accurate coding of surgical procedures and medical conditions.
De-anonymization of the data in the future would also increase the pow-erfulness of the benchmarking and enable hospitals to identify others with good performance and best practice.
REFERENCES
1. Wilding R. The 3Ts of highly effectivesupply chains. Supply Chain Pract 2004;5:30-9.
2. Chapman JF, Cook R. The Blood Stocks Management Scheme, a partnership venture between the National Blood Service of England and North Wales and participating hos-pitals for maximizing blood supply chain management. Vox Sang 2003;83:239-46.
3. Chapman JF, Hick R, Hyam C. A national blood manage-ment scheme—purpose and progress. Transfusion 2002;44:162A-163A.
NBS ISI Hospital ISI Hospital wastage NBS wastage
0.0 2.0 4.0 6.0 8.0 10.0 12.0 14.0 Jan 05Feb 05 Mar 05 Apr 05May 05 Jun 05 Jul 0 5 Aug 0 5 Sep 0 5 Oct 05 Nov 05 Dec 05 Jan 06Feb 0 6 Mar 06Apr 0 6 May 06Jun 06 Jul 0 6 0.0 1.0 2.0 3.0 4.0 Is s u a b le S to c k I n d e x Wastage as a % of Issue