CHAPTER 3
UNDERSTANDING FINANCIAL STATEMENTS
Financial statements provide the fundamental information that we use to analyze and answer valuation questions. It is important, therefore, that we understand the principles governing these statements by looking at four questions:
• How valuable are the assets of a firm? The assets of a firm can come in several forms – assets with long lives such as land and buildings, assets with shorter lives such inventory, and intangible assets that still produce revenues for the firm such as patents and trademarks.
• How did the firm raise the funds to finance these assets? In acquiring these assets, firms can use the funds of the owners (equity) or borrowed money (debt), and the mix is likely to change as the assets age.
• How profitable are these assets? A good investment, we argued, is one that makes a return greater than the hurdle rate. To evaluate whether the investments that a firm has already made are good investments, we need to estimate what returns we are making on these investments.
• How much uncertainty (or risk) is embedded in these assets? While we have not directly confronted the issue of risk yet, estimating how much uncertainty there is in existing investments and the implications for a firm is clearly a first step.
We will look at the way accountants would answer these questions, and why the answers might be different when doing valuation. Some of these differences can be traced to the differences in objectives – accountants try to measure the current standing and immediate past performance of a firm, whereas valuation is much more forward looking.
The Basic Accounting Statements
There are three basic accounting statements that summarize information about a firm. The first is the balance sheet, shown in Figure 3.1, which summarizes the assets owned by a firm, the value of these assets and the mix of financing, debt and equity, used to finance these assets at a point in time.
Assets Liabilities
Fixed Assets
Debt
Equity
Short-term liabilities of the firm
Intangible Assets Long Lived Real Assets
Assets which are not physical, like patents & trademarks
Current Assets
Financial Investments Investments in securities &
assets of other firms Short-lived Assets
Equity investment in firm Debt obligations of firm Current
Liabilties
Other
Liabilities Other long-term obligations
Figure 3.1: The Balance Sheet
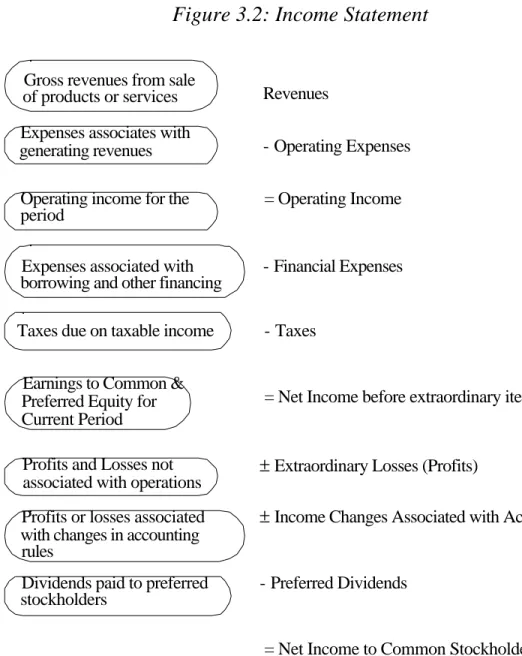
The next is the income statement, shown in Figure 3.2, which provides information on the revenues and expenses of the firm, and the resulting income made by the firm, during a period. The period can be a quarter (if it is a quarterly income statement) or a year (if it is an annual report).
Figure 3.2: Income Statement
Revenues Gross revenues from sale
of products or services
- Operating Expenses Expenses associates with
generating revenues
= Operating Income Operating income for the
period
- Financial Expenses Expenses associated with
borrowing and other financing
- Taxes Taxes due on taxable income
= Net Income before extraordinary items Earnings to Common &
Preferred Equity for Current Period
±Extraordinary Losses (Profits) Profits and Losses not
associated with operations
± Income Changes Associated with Accounting Changes Profits or losses associated
with changes in accounting rules
- Preferred Dividends Dividends paid to preferred
stockholders
= Net Income to Common Stockholders
Finally, there is the statement of cash flows, shown in figure 3.3, which specifies the sources and uses of cash of the firm from operating, investing and financing activities, during a period.
Cash Flows From Operations
+ Cash Flows From Investing
+ Cash Flows from Financing
Net cash flow from operations, after taxes and interest expenses
Includes divestiture and acquisition of real assets (capital expenditures) and disposal and purchase of financial assets. Also includes acquisitions of other firms. Net cash flow from the issue and repurchase of equity, from the
issue and repayment of debt and after dividend payments
= Net Change in Cash Balance
Figure 3.3: Statement of Cash FlowsThe statement of cash flows can be viewed as an attempt to explain how much the cash flows during a period were, and why the cash balance changed during the period.
Asset Measurement and Valuation
When analyzing any firm, we would like to know the types of assets that it owns, the values of these assets and the degree of uncertainty about these values. Accounting statements do a reasonably good job of categorizing the assets owned by a firm, a partial job of assessing the values of these assets and a poor job of reporting uncertainty about asset values. In this section, we will begin by looking at the accounting principles underlying asset categorization and measurement, and the limitations of financial statements in providing relevant information about assets.
Accounting Principles Underlying Asset Measurement
An asset is any resource that has the potential to either generate future cash inflows or reduce future cash outflows. While that is a general definition broad enough to cover almost any kind of asset, accountants add a caveat that for a resource to be an asset. A firm has to have acquired it in a prior transaction and be able to quantify future benefits with reasonable precision. The accounting view of asset value is to a great extent grounded in the notion of historical cost, which is the original cost of the asset, adjusted upwards for improvements made to the asset since purchase and downwards for the loss in value associated with the aging of the asset. This historical cost is called the book value. While
the generally accepted accounting principles for valuing an asset vary across different kinds of assets, three principles underlie the way assets are valued in accounting statements.
• An Abiding Belief in Book Value as the Best Estimate of Value: Accounting estimates of
asset value begin with the book value. Unless a substantial reason is given to do otherwise, accountants view the historical cost as the best estimate of the value of an asset.
• A Distrust of Market or Estimated Value: When a current market value exists for an
asset that is different from the book value, accounting convention seems to view this market value with suspicion. The market price of an asset is often viewed as both much too volatile and too easily manipulated to be used as an estimate of value for an asset. This suspicion runs even deeper when values are is estimated for an asset based upon expected future cash flows.
• A Preference for under estimating value rather than over estimating it: When there is
more than one approach to valuing an asset, accounting convention takes the view that the more conservative (lower) estimate of value should be used rather than the less conservative (higher) estimate of value. Thus, when both market and book value are available for an asset, accounting rules often require that you use the lesser of the two numbers.
Measuring Asset Value
The financial statement in which accountants summarize and report asset value is the balance sheet. To examine how asset value is measured, let us begin with the way assets are categorized in the balance sheet. First, there are the fixed assets, which include the long-term assets of the firm, such as plant, equipment, land and buildings. Next, we have the short-term assets of the firm, including inventory (including raw materials, work in progress and finished goods), receivables (summarizing moneys owed to the firm) and cash; these are categorized as current assets. We then have investments in the assets and securities of other firms, which are generally categorized as financial investments. Finally, we have what is loosely categorized as intangible assets. These include assets, such as patents and trademarks that presumably will create future earnings and cash flows, and also uniquely accounting assets such as goodwill that arise because of acquisitions made by the firm. Fixed Assets
Generally accepted accounting principles (GAAP) in the United States require the valuation of fixed assets at historical cost, adjusted for any estimated gain and loss in value from improvements and the aging, respectively, of these assets. While in theory the adjustments for aging should reflect the loss of earning power of the asset as it ages, in
practice they are much more a product of accounting rules and convention, and these adjustments are called depreciation. Depreciation methods can very broadly be categorized into straight line (where the loss in asset value is assumed to be the same every year over its lifetime) and accelerated (where the asset loses more value in the earlier years and less in the later years). [While tax rules, at least in the United States, have restricted the freedom that firms have on their choice of asset life and depreciation methods, firms continue to have a significant amount of flexibility on these decisions for reporting purposes. Thus, the depreciation that is reported in the annual reports may not, and generally is not, the same depreciation that is used in the tax statements.
Since fixed assets are valued at book value and are adjusted for depreciation provisions, the value of a fixed asset is strongly influenced by both its depreciable life and the depreciation method used. Many firms in the United States use straight line depreciation for financial reporting while using accelerated depreciation for tax purposes, since firms can report better earnings with the former1, at least in the years right after the asset is acquired. In contrast, Japanese and German firms often use accelerated depreciation for both tax and financial reporting purposes, leading to reported income which is understated relative to that of their U.S. counterparts.
Current Assets
Current assets include inventory, cash and accounts receivables. It is in this category that accountants are most amenable to the use of market value, especially in valuing marketable securities.
Accounts Receivable
Accounts receivable represent money owed by entities to the firm on the sale of products on credit. When the Home Depot sells products to building contractors and gives them a few weeks to make the payment, it is creating accounts receivable. The accounting convention is for accounts receivable to be recorded as the amount owed to the firm, based upon the billing at the time of the credit sale. The only major valuation and accounting issue is when the firm has to recognize accounts receivable that are not collectible. Firms can set aside a portion of their income to cover expected bad debts from credit sales, and accounts receivable will be reduced by this reserve. Alternatively, the bad debts can be recognized as they occur and the firm can reduce the accounts receivable accordingly. There is the danger,
1 Depreciation is treated as an accounting expense. Hence, the use of straight line depreciation (which is
lower than accelerated depreciation in the first few years after an asset is acquired) will result in lower expenses and higher income.
however, that absent a decisive declaration of a bad debt, firms may continue to show as accounts receivable amounts that they know are unlikely to be ever collected.
Cash
Cash is one of the few assets for which accountants and financial analysts should agree on value. The value of a cash balance should not be open to estimation error. Having said this, we should note that fewer and fewer companies actually hold cash in the conventional sense (as currency or as demand deposits in banks). Firms often invest the cash in interest-bearing accounts or in treasuries, so as to earn a return on their investments. In either case, market value can deviate from book value, especially if the investments are long term. While there is no real default risk in either of these investments, interest rate movements can affect their value. We will examine the valuation of marketable securities later in this section.
Inventory
Three basis approaches to valuing inventory are allowed by GAAP: FIFO, LIFO and Weighted Average.
(a) First-in, First-out (FIFO): Under FIFO, the cost of goods sold is based upon the cost
of material bought earliest in the period, while the cost of inventory is based upon the cost of material bought latest in the year. This results in inventory being valued close to the current replacement cost. During periods of inflation, the use of FIFO will result in the lowest estimate of cost of goods sold among the three valuation approaches, and the highest net income.
(b) Last-in, First-out (LIFO): Under LIFO, the cost of goods sold is based upon the cost
of material bought latest in the period, while the cost of inventory is based upon the cost of material bought earliest in the year. This results in finished goods being valued close to the current production cost. During periods of inflation, the use of LIFO will result in the highest estimate of cost of goods sold among the three valuation approaches, and the lowest net income.
(c) Weighted Average: Under the weighted average approach, both inventory and the cost of
goods sold are based upon the average cost of all materials bought during the period. When inventory turns over rapidly, this approach will more closely resemble FIFO than LIFO.
Firms often adopt the LIFO approach for its tax benefits during periods of high inflation. The cost of goods sold is then higher because it is based upon prices paid towards to the end of the accounting period. This, in turn, will reduce the reported taxable income and net income, while increasing cash flows. Studies indicate that larger firms with rising
prices for raw materials and labor, more variable inventory growth and an absence of other tax loss carry forwards are much more likely to adopt the LIFO approach.
Given the income and cash flow effects of inventory valuation methods, it is often difficult to compare the inventory values of firms that use different methods. There is, however, one way of adjusting for these differences. Firms that choose the LIFO approach to value inventories have to specify in a footnote the difference in inventory valuation between FIFO and LIFO, and this difference is termed the LIFO reserve. It can be used to adjust the beginning and ending inventories, and consequently the cost of goods sold, and to restate income based upon FIFO valuation.
Investments (Financial) and Marketable Securities
In the category of investments and marketable securities, accountants consider investments made by firms in the securities or assets of other firms, and other marketable securities including treasury bills or bonds. The way in which these assets are valued depends upon the way the investment is categorized and the motive behind the investment. In general, an investment in the securities of another firm can be categorized as a minority, passive investment; a minority, active investment; or a majority, active investment. The accounting rules vary depending upon the categorization.
Minority, Passive Investments
If the securities or assets owned in another firm represent less than 20% of the overall ownership of that firm, an investment is treated as a minority, passive investment. These investments have an acquisition value, which represents what the firm originally paid for the securities and often a market value. Accounting principles require that these assets be sub-categorized into one of three groups: investments that will be held to maturity, investments that are available for sale and trading investments. The valuation principles vary for each.
• For investments that will be held to maturity, the valuation is at historical cost or book value, and interest or dividends from this investment are shown in the income statement under net interest expenses
• For investments that are available for sale, the valuation is at market value, but the unrealized gains or losses are shown as part of the equity in the balance sheet and not in the income statement. Thus, unrealized losses reduce the book value of the equity in the firm, and unrealized gains increase the book value of equity.
• For trading investments, the valuation is at market value and the unrealized gains and losses are shown in the income statement.
Firms are allowed an element of discretion in the way they classify investments and, subsequently, in the way they value these assets. This classification ensures that firms such as investment banks, whose assets are primarily securities held in other firms for purposes of trading, revalue the bulk of these assets at market levels each period. This is called marking-to-market and provides one of the few instances in which market value trumps book value in accounting statements.
Minority, Active Investments
If the securities or assets owned in another firm represent between 20% and 50% of the overall ownership of that firm, an investment is treated as a minority, active investment. While these investments have an initial acquisition value, a proportional share (based upon ownership proportion) of the net income and losses made by the firm in which the investment was made, is used to adjust the acquisition cost. In addition, the dividends received from the investment reduce the acquisition cost. This approach to valuing investments is called the equity approach.
The market value of these investments is not considered until the investment is liquidated, at which point the gain or loss from the sale, relative to the adjusted acquisition cost is shown as part of the earnings under extraordinary items in that period.
Majority, Active Investments
If the securities or assets owned in another firm represent more than 50% of the overall ownership of that firm, an investment is treated as a majority active investment2. In this case, the investment is no longer shown as a financial investment but is instead replaced by the assets and liabilities of the firm in which the investment was made. This approach leads to a consolidation of the balance sheets of the two firms, where the assets and liabilities of the two firms are merged and presented as one balance sheet. The share of the firm that is owned by other investors is shown as a minority interest on the liability side of the balance sheet. A similar consolidation occurs in the financial statements of the other firm as well. The statement of cash flows reflects the cumulated cash inflows and outflows of the combined firm. This is in contrast to the equity approach, used for minority active investments, in which only the dividends received on the investment are shown as a cash inflow in the cash flow statement.
2 Firms have evaded the requirements of consolidation by keeping their share of ownership in other firms
Here again, the market value of this investment is not considered until the ownership stake is liquidated. At that point, the difference between the market price and the net value of the equity stake in the firm is treated as a gain or loss for the period.
Intangible Assets
Intangible assets include a wide array of assets ranging from patents and trademarks to goodwill. The accounting standards vary across intangible assets.
1. Patents and Trademarks
Patents and trademarks are valued differently depending on whether they are generated internally or acquired. When patents and trademarks are generated from internal sources, such as research, the costs incurred in developing the asset are expensed in that period even though the asset might have a life of several accounting periods. Thus, the intangible asset is not usually valued in the balance sheet of the firm. In contrast, when an intangible asset is acquired from an external party, it is treated as an asset.
Intangible assets have to be amortized over their expected lives, with a maximum amortization period of 40 years. The standard practice is to use straight-line amortization. For tax purposes, however, firms are not allowed to amortize goodwill or other intangible assets with no specific lifetime.
2. Goodwill
Intangible assets are sometimes the by-products of acquisitions. When a firm acquires another firm, the purchase price is first allocated to tangible assets and then allocated to any intangible assets such as patents or trade names. Any residual becomes goodwill. While accounting principles suggest that goodwill captures the value of any intangibles that are not specifically identifiable, it is really a reflection of the difference between the market value of the firm owning the assets and the book value of assets. This approach is called purchase accounting and it creates an intangible asset (goodwill) which has to be amortized over 40 years. Firms, which do not want to see this charge against their earnings, often use an alternative approach called pooling accounting, in which the purchase price never shows up in the balance sheet. Instead, the book values of the two companies involved in the merger are aggregated to create the consolidated balance of the combined firm.3
3 The Financial Accounting Standards Board (FASB) was considering eliminating the use of pooling and
reducing the amortization period for goodwill in purchase accounting to 20 years at the time this book went to print.
Illustration 3.1: Asset Values for Boeing and the Home Depot
Table 3.1 summarizes asset values, as measured in the balance sheets of Boeing, the aerospace giant, and The Home Depot, a building suppliers retailer, at the end of the 1998 financial year:
Table 3.1: Assets: Boeing and the Home Depot
Boeing Home Depot
Net Fixed Assets $8,589 $8,160
Goodwill $2,312 $140
Investments and Notes Receivable $0 $41
Deferred Income Taxes $411 $0
Prepaid Pension Expense $3,513 $0
Customer Financing $4,930 $0
Other Assets $542 $191
Current Assets
Cash $2,183 $62
Short-term Marketable Investments $279 $0
Accounts Receivables $3,288 $469
Current Portion of Customer Financing $781 $0
Deferred Income Taxes $1,495 $0
Inventories $8,349 $4,293
Other Current Assets $0 $109
Total Current Assets $16,375 $4,933
Total Assets $36,672 $13,465
There are a number of points worth noting about these asset values.
1. Goodwill: Boeing, which acquired Rockwell in 1996 and McDonnell Douglas in 1997,
used purchase accounting for the Rockwell acquisition and pooling for McDonnell Douglas. The goodwill on the balance sheet reflects the excess of acquisition value over book value for Rockwell and is being amortized over 30 years. With McDonnell Douglas, there is no recording of the premium paid on the acquisition among the assets. 2. Customer Financing and Accounts Receivable: Boeing often either provides financing
to its customers to acquire its planes or acts as the lessor on the planes. Since these contracts tend to run over several years, the present value of the payments due in future years on the financing and the lease payments is shown as customer financing. The current portion of these payments is shown as accounts receivable. The Home Depot provides credit to its customers as well, but all these payments due are shown as accounts receivable, since they are all short term.
3. Inventories: Boeing values inventories using the weighted average cost method, while
The Home Depot uses the FIFO approach for valuing inventories.
4. Marketable Securities: Boeing classifies its short term investments as trading
investments and records them at market value. The Home Depot has a mix of trading, available-for-sale and held-to-maturity investments and therefore uses a mix of book and market value to value these investments.
5. Prepaid Pension Expense: Boeing records the excess of its pension fund assets over its
expected pension fund liabilities as an asset on the balance sheet.
Finally, the balance sheet for Boeing fails to report the value of a very significant asset, which is the effect of past research and development expenses. Since accounting convention requires that these be expensed in the year that they occur and not capitalized, the research asset does not show up in the balance sheet. In chapter 9, we will consider how to capitalize research and development expenses and the effects on balance sheets.
Measuring Financing Mix
The second set of questions that we would like to answer and accounting statements to shed some light on relates to the current value and subsequently the mixture of debt and equity used by the firm. The bulk of the information about these questions is provided on the liability side of the balance sheet and the footnotes.
Accounting Principles Underlying Liability and Equity Measurement
Just as with the measurement of asset value, the accounting categorization of liabilities and equity is governed by a set of fairly rigid principles. The first is a strict
categorization of financing into either a liability or equity based upon the nature of the
obligation. For an obligation to be recognized as a liability, it must meet three requirements: 1. It must be expected to lead to a future cash outflow or the loss of a future cash inflow at
some specified or determinable date, 2. The firm cannot avoid the obligation.
3. The transaction giving rise to the obligation has happened already.
In keeping with the earlier principle of conservatism in estimating asset value, accountants recognize as liabilities only cash flow obligations that cannot be avoided.
The second principle is that the value of both liabilities and equity in a firm are
better estimated using historical costs with accounting adjustments, rather than with
expected future cash flows or market value. The process by which accountants measure the value of liabilities and equities is inextricably linked to the way they value assets. Since assets are primarily valued at historical cost or at book value, both debt and equity also get
measured primarily at book value. In the section that follows, we will examine the accounting measurement of both liabilities and equity.
Measuring the Value of Liabilities and Equities
Accountants categorize liabilities into current liabilities, long term debt and long term liabilities that are neither debt nor equity. Next, we will examine the way they measure each of these.
Current Liabilities
Current liabilities categorizes all obligations that the firm has coming due in the next accounting period. These generally include:
1. Accounts Payable – representing credit received from suppliers and other vendors to the firm. The value of accounts payable represents the amounts due to these creditors. For this item, book and market value should be similar.
2. Short term borrowing – representing short term loans (due in less than a year) taken to finance the operations or current asset needs of the business. Here again, the value shown represents the amounts due on such loans, and the book and market value should be similar, unless the default risk of the firm has changed dramatically since it borrowed the money.
3. Short term portion of long term borrowing – representing the portion of the long term debt or bonds that is coming due in the next year. Here again, the value shown is the actual amount due on these loans, and market and book value should converge as the due date approaches.
4. Other short term liabilities – which is a catch-all component for any other short term liabilities that the firm might have, including wages due to its employees and taxes due to the government.
Of all the items on the liability side of the balance sheet, absent outright fraud, current liabilities should be the one for which the accounting estimates of book value and financial estimates of market value are the closest.
Long Term Debt
Long term debt for firms can take one of two forms. It can be a long-term loan from a bank or other financial institution or it can be a long-term bond issued to financial markets, in which case the creditors are the investors in the bond. Accountants measure the value of long term debt by looking at the present value of payments due on the loan or bond at the time of the borrowing. For bank loans, this will be equal to the nominal value of the loan. With bonds, however, there are three possibilities: When bonds are issued at par value,
for instance, the value of the long-term debt is generally measured in terms of the nominal obligation created, in terms of principal (face value) due on the borrowing. When bonds are issued at a premium or a discount on par value, the bonds are recorded at the issue price, but the premium or discount to the face value is amortized over the life of the bond. As an extreme example, companies that issue zero coupon debt have to record the debt at the issue price, which will be significantly below the principal (face value) due at maturity. The difference between the issue price and the face value is amortized each period and is treated as a non-cash interest expense that is tax deductible.
In all these cases, the book value of debt is unaffected by changes in interest rates during the life of the loan or bond. Note that as market interest rates rise (fall), the present value of the loan obligations should decrease (increase). This updated market value for debt is not shown on the balance sheet. If debt is retired prior to maturity, the difference between book value and the amount paid at retirement is treated as an extraordinary gain or loss in the income statement.
Finally, companies which have long term debt denominated in non-domestic currencies have to adjust the book value of debt for changes in exchange rates. Since exchange rate changes reflect underlying changes in interest rates, it does imply that this debt is likely to be valued much nearer to market value than is debt in the home currency. Other Long Term Liabilities
Firms often have long term obligations that are not captured in the long term debt item. These include obligations to lessors on assets that firms have leased, to employees in the form of pension fund and health care benefits yet to be paid, and to the government in the form of taxes deferred. In the last two decades, accountants have increasingly moved towards quantifying these liabilities and showing them as long term liabilities.
1. Leases
Firms often choose to lease long-term assets rather than buy them. Lease payments create the same kind of obligation that interest payments on debt create, and they must be viewed in a similar light. If a firm is allowed to lease a significant portion of its assets and keep it off its financial statements, a perusal of the statements will give a very misleading view of the company's financial strength. Consequently, accounting rules have been devised to force firms to reveal the extent of their lease obligations on their books.
There are two ways of accounting for leases. In an operating lease, the lessor (or owner) transfers only the right to use the property to the lessee. At the end of the lease period, the lessee returns the property to the lessor. Since the lessee does not assume the risk of ownership, the lease expense is treated as an operating expense in the income
statement and the lease does not affect the balance sheet. In a capital lease, the lessee assumes some of the risks of ownership and enjoys some of the benefits. Consequently, the lease, when signed, is recognized both as an asset and as a liability (for the lease payments) on the balance sheet. The firm gets to claim depreciation each year on the asset and also deducts the interest expense component of the lease payment each year. In general, capital leases recognize expenses sooner than equivalent operating leases.
Since firms prefer to keep leases off the books and sometimes to defer expenses they have a strong incentive to report all leases as operating leases. Consequently the Financial Accounting Standards Board has ruled that a lease should be treated as a capital lease if it meets any one of the following four conditions.
(a) The lease life exceeds 75% of the life of the asset.
(b) There is a transfer of ownership to the lessee at the end of the lease term.
(c) There is an option to purchase the asset at a "bargain price" at the end of the lease term. (d) The present value of the lease payments, discounted at an appropriate discount rate, exceeds 90% of the fair market value of the asset.
The lessor uses the same criteria for determining whether the lease is a capital or operating lease and accounts for it accordingly. If it is a capital lease, the lessor records the present value of future cash flows as revenue and recognizes expenses. The lease receivable is also shown as an asset on the balance sheet and the interest revenue is recognized over the term of the lease as paid.
From a tax standpoint, the lessor can claim the tax benefits of the leased asset only if it is an operating lease, though the revenue code uses slightly different criteria4 for determining whether the lease is an operating lease.
2. Employee Benefits
Employers provide pension and health care benefits to their employees. In many cases, the obligations created by these benefits are extensive and a failure by the firm to adequately fund these obligations needs to be revealed in financial statements.
a. Pension Plans
In a pension plan, the firm agrees to provide certain benefits to its employees, either by specifying a 'defined contribution' (wherein a fixed contribution is made to the plan each year by the employer, without any promises as to the benefits which will be delivered in the
4 The requirements for an operating lease in the revenue code are as follows - (a) the property can be used by
someone other than the lessee at the end of the lease term, (b) the lessee cannot buy the asset using a bargain purchase option, (c) the lessor has at least 20% of its capital at risk, (d) the lessor has a positive cash flow from the lease independent of tax benefits and (e) the lessee does not have an investment in the
plan) or a 'defined benefit' (wherein the employer promises to pay a certain benefit to the employee). In the latter case, the employer has to put sufficient money into the plan each period to meet the defined benefits.
Under a defined contribution plan, the firm meets its obligation once it has made the pre-specified contribution to the plan. Under a defined-benefit plan, the firm's obligations are much more difficult to estimate, since they will be determined by a number of variables including the benefits that employees are entitled to, the prior contributions made by the employer, the returns the plan have earned, and the rate of return that the employer expects to make on current contributions. As these variables change, the value of the pension fund assets can be greater than, less than or equal to pension fund liabilities (which is the present value of promised benefits). A pension fund whose assets exceed its liabilities is an over-funded plan, whereas one whose assets are less than its liabilities is an under-over-funded plan and disclosures to that effect have to be included in financial statements, generally in the footnotes.
When a pension fund is over-funded, the firm has several options. It can withdraw the excess assets from the fund, it can discontinue contributions to the plan, or it can continue to make contributions on the assumption that the over-funding is a transitory phenomenon that could well disappear by the next period. When a fund is under-funded, the firm has a liability, though accounting standards require that firms reveal only the excess of accumulated5 pension fund liabilities over pension fund assets on the balance sheet.
b. Health Care Benefits
A firm can provide health care benefits in one of two ways: by making a fixed contribution to a health care plan, without promising specific benefits (analogous to a defined contribution plan), or by promising specific health benefits and setting aside the funds to provide these benefits (analogous to a defined benefit plan). The accounting for health care benefits is very similar to the accounting for pension obligations. The key difference between the two is that firms do not have to report6 the excess of their health care obligations over the health care fund assets as a liability on the balance sheet, though a footnote to that effect has to be added to the financial statement.
lease.
5 The accumulated pension fund liability does not take into account the projected benefit obligation, where
actuarial estimates of future benefits are made. Consequently, it is much smaller than the total pension liabilities.
6 While companies might not have to report the excess of their health care obligations over assets as a
3. Deferred Taxes
Firms often use different methods of accounting for tax and financial reporting purposes, leading to a question of how tax liabilities should be reported. Since accelerated depreciation and favorable inventory valuation methods for tax accounting purposes lead to a deferral of taxes, the taxes on the income reported in the financial statements will generally be much greater than the actual tax paid. The same principles of matching expenses to income that underlie accrual accounting suggest that the 'deferred income tax' be recognized in the financial statements. Thus a company which pays taxes of $55,000 on its taxable income based upon its tax accounting, and which would have paid taxes of $75,000 on the income reported in its financial statements, will be forced to recognize the difference ($20,000) as deferred taxes in liabilities. Since the deferred taxes will be paid in later years, they will be recognized as paid.
It is worth noting that companies that actually pay more in taxes than the taxes they report in the financial statements create an asset on the balance sheet called a deferred tax asset. This reflects the fact that the firm's earnings in future periods will be greater as the firm is given credit for the deferred taxes.
The question of whether the deferred tax liability is really a liability is an interesting one. Firms do not owe the amount categorized as deferred taxes to any entity, and treating it as a liability makes the firm look more risky than it really is. On the other hand, the firm will eventually have to pay its deferred taxes, and treating it as a liability seems to be the conservative thing to do.
Preferred Stock
When a company issues preferred stock, it generally creates an obligation to pay a fixed dividend on the stock. Accounting rules have conventionally not viewed preferred stock as debt because the failure to meet preferred dividends does not result in bankruptcy. At the same time, the fact the preferred dividends are cumulative makes them more onerous than common equity. Thus, preferred stock is viewed in accounting as a hybrid security, sharing some characteristics with equity and some with debt.
Preferred stock is valued on the balance sheet at its original issue price, with any cumulated unpaid dividends added on. Convertible preferred stock is treated similarly, but it is treated as equity on conversion.
Equity
The accounting measure of equity is a historical cost measure. The value of equity shown on the balance sheet reflects the original proceeds received by the firm when it issued the equity, augmented by any earnings made since (or reduced by losses, if any) and
reduced by any dividends paid out during the period. While these three items go into what we can call the book value of equity, a few other items also end up in this estimate.
1. When companies buy back stock for short periods, with the intent of reissuing the stock or using it to cover option exercises, they are allowed to show the repurchased stock as treasury stock, which reduces the book value of equity. Firms are not allowed to keep treasury stock on the books for extended periods and have to reduce their book value of equity by the value of repurchased stock in the case of actions such as stock buybacks. Since these buybacks occur at the current market price, they can result in significant reductions in the book value of equity.
2. Firms that have significant losses over extended periods or carry out massive stock buybacks can end up with negative book values of equity.
3. Relating back to our discussion of marketable securities, any unrealized gain or loss in marketable securities that are classified as available-for-sale is shown as an increase or decrease in the book value of equity in the balance sheet.
As part of their financial statements, firms provide a summary of changes in shareholders equity during the period, where all the changes that occurred to the accounting (book value) measure of equity value are summarized.
Accounting rules still do not seem to have come to grips with the effect of warrants and equity options (such as those granted by many firms to management) on the book value of equity. If warrants are issued to financial markets, the proceeds from this issue will show up as part of the book value of equity. In the far more prevalent case where options are given or granted to management, there is no effect on the book value of equity. When the options are exercised, the cash inflows from the exercise do ultimately show up in the book value of equity and there is a corresponding increase in the number of shares outstanding. The same point can be made about convertible bonds, which are treated as debt until conversion, at which point they become part of equity. In partial defense of accountants, we must note that the effect of options outstanding is often revealed when earnings and book value are computed on a per share basis. Here, the computation is made on two bases, the first on the current number of shares outstanding (primary shares outstanding) and the second on the number of shares outstanding after all options have been exercised (fully diluted shares outstanding).
As a final point on equity, accounting rules still seem to consider preferred stock, with its fixed dividend, as equity or near-equity, largely because of the fact that preferred dividends can be deferred or cumulated without the risk of default. To the extent that there can still be a loss of control in the firm (as opposed to bankruptcy), we would argue that
preferred stock shares almost as many characteristics with unsecured debt as it does with equity.
Illustration 3.2: Measuring Liabilities and Equity: Boeing and the Home Depot
Table 3.2 summarizes the accounting estimates of liabilities and equity at Boeing and The Home Depot for the 1998 financial year:
Table 3.2: Liabilities – Boeing and Home Depot Boeing Home Depot
Current Liabilities
Accounts Payable & other liabilities $10,733 $1,586 Accrued Salaries and Expenses $0 $1,010 Advances in excess of costs $1,251 $0
Taxes payable $569 $247
Short term debt and Current LT debt $869 $14 Total Current Liabilities $13,422 $2,857 Accrued Health Care Benefits $4,831 $0 Other Long Term Liabilities $0 $210
Deferred Income Taxes $0 $83
Long-term Debt $6,103 $1,566
Minority Interests $0 $9
Shareholder's Equity
Par Value $5,059 $37
Additional Paid-in Capital $0 $2,891 Retained Earnings $7,257 $5,812 Total Shareholder's Equity $12,316 $8,740
Total Liabilities $36,672 $13,465
The most significant difference between the companies is the accrued health care liability, representing the present value of expected health care obligations promised to employees in excess of health care assets. The shareholders’ equity for both firms represents the book value of equity and is significantly different from the market value of equity. Table 3.3 summarizes the difference at the end of the 1998.
Table 3.3: Book and Market Value of Equity Comparison Boeing Home Depot
Market Value of Equity $32,595 $85,668
One final point needs to be made about the Home Depot’s liabilities. The Home Depot has substantial operating leases. Because these leases are treated as operating expenses, they do not show up in the balance sheet. Since they represent commitments to make payments in the future, we would argue that operating leases should be capitalized and treated as part of the liabilities of the firm. We will consider how best to do this later in this book.
Measuring Earnings and Profitability
How profitable is a firm? What did it earn on the assets that it invested in? These are the fundamental questions we would like financial statements to answer. Accountants use the income statement to provide information about a firm's operating activities over a specific time period. In terms of our description of the firm, the income statement is designed to measure the earnings from assets in place. In this section, we will examine the principles underlying earnings and return measurement in accounting, and the methods that they are put into practice.
Accounting Principles Underlying Measurement of Earnings and Profitability Two primary principles underlie the measurement of accounting earnings and profitability. The first is the principle of accrual accounting. In accrual accounting, the revenue from selling a good or service is recognized in the period in which the good is sold or the service is performed (in whole or substantially). A corresponding effort is made on the expense side to match7 expenses to revenues. This is in contrast to cash accounting, where revenues are recognized when payment is received and expenses are recorded when they are paid.
The second principle is the categorization of expenses into operating, financing and capital expenses. Operating expenses are expenses that, at least in theory, provide benefits only for the current period; the cost of labor and materials expended to create products that are sold in the current period is a good example. Financing expenses are expenses arising from the non-equity financing used to raise capital for the business; the most common example is interest expenses. Capital expenses are expenses that are expected to generate benefits over multiple periods; for instance, the cost of buying land and buildings is treated as a capital expense.
7 If a cost (such as an administrative cost) cannot be easily linked with a particular revenues, it is usually
Operating expenses are subtracted from revenues in the current period to arrive at a measure of operating earnings from the firm. Financing expenses are subtracted from operating earnings to estimate earnings to equity investors or net income. Capital expenses are written off over their useful life (in terms of generating benefits) as depreciation or amortization.
Measuring Accounting Earnings and Profitability
Since income can be generated from a number of different sources, generally accepted accounting principles (GAAP) require that income statements be classified into four sections: income from continuing operations, income from discontinued operations, extraordinary gains or losses and adjustments for changes in accounting principles.
Generally accepted accounting principles require the recognition of revenues when the service for which the firm is getting paid has been performed in full or substantially and for which it has received in return either cash or a receivable that is both observable and measurable. Expenses linked directly to the production of revenues (like labor and materials) are recognized in the same period in which revenues are recognized. Any expenses that are not directly linked to the production of revenues are recognized in the period in which the firm consumes the services.
While accrual accounting is straightforward in firms that produce goods and sell them, there are special cases where accrual accounting can be complicated by the nature of the product or service being offered. For instance, firms that enter into long term contracts with their customers, for instance, are allowed to recognize revenue on the basis of the percentage of the contract that is completed. As the revenue is recognized on a percentage of completion basis, a corresponding proportion of the expense is also recognized. When there is considerable uncertainty about the capacity of the buyer of a good or service to pay for a service, the firm providing the good or service may recognize the income only when it collects portions of the selling price under the installment method.
Reverting back to our discussion of the difference between capital and operating expenses, operating expenses should reflect only those expenses that create revenues in the current period. In practice, however, a number of expenses are classified as operating expenses that do not seem to meet this test. The first is depreciation and amortization. While the notion that capital expenditures should be written off over multiple periods is reasonable, the accounting depreciation that is computed on the original historical cost often bears little resemblance to the actual economical depreciation. The second expense is research and development expenses, which accounting standards in the United States classify as
operating expenses, but which clearly provide benefits over multiple periods. The rationale used for this classification is that the benefits cannot be counted on or easily quantified.
Much of financial analysis is built around the expected future earnings of a firm, and many of these forecasts start with the current earnings. It is therefore important that we know how much of these earnings come from the ongoing operations of the firm, and how much can be attributed to unusual or extraordinary events, that are unlikely to recur on a regular basis. From that standpoint, it is useful that firms categorize expenses into operating and nonrecurring expenses, since it is the earnings prior to extraordinary items that should be used in forecasting. Nonrecurring items include the following:
a. Unusual or Infrequent items, such as gains or losses from the divestiture of an asset or
division and write-offs or restructuring costs. Companies sometimes include such items as part of operating expenses. As an example, Boeing in 1997 took a write-off of $1,400 million to adjust the value of assets it acquired in its acquisition of McDonnell Douglas, and it showed this as part of operating expenses.
b. Extraordinary items, which are defined as events that are unusual in nature, infrequent
in occurrence and material in impact. Examples include the accounting gain associated with refinancing high coupon debt with lower coupon debt, and gains or losses from marketable securities that are held by the firm.
c. Losses associated with discontinued operations, which measure both the loss from the
phase out period and the estimated loss on the sale of the operations. To qualify, however, the operations have to be separable separated from the firm.
d. Gains or losses associated with accounting changes, which measure earnings changes
created by accounting changes made voluntarily by the firm (such as a change in inventory valuation and change in reporting period) and accounting changes mandated by new accounting standards.
Illustration 3.3: Measures of Earnings
Table 3.4 summarizes the income statements of Boeing and the Home Depot for the 1998 financial year:
Table 3.4: Income Statements: Boeing and Home Depot
Boeing (in millions)
Home Depot (in millons) Sales & Other Operating Revenues $56,154.00 $30,219.00 - Operating Costs & Expenses $51,022.00 $27,185.00
- Depreciation $1,517.00 $373.00
Operating Income $1,720.00 $2,661.00 + Other Income (Includes Interest Income) $130.00 $30.00
- Interest Expenses $453.00 $37.00
Earnings before Taxes $1,397.00 $2,654.00
- Income Taxes $277.00 $1,040.00
Net Earnings (Loss) $1,120.00 $1,614.00
Boeing's operating income is reduced by the research and development expense, which is treated as an operating expense by accountants. The Home Depot’s operating expenses include operating leases. As noted earlier, the treatment of both these items skews earnings and we will consider how best to adjust earnings when such expenses exist, in chapter 9. Measures of Profitability
While the income statement allows us to estimate how profitable a firm is in absolute terms, it is just as important that we gauge the profitability of the firm in comparison terms or percentage returns. Two basic gauges measure profitability. One examines the profitability relative to the capital employed to get a rate of return on investment. This can be done either from the viewpoint of just the equity investors, or by looking at the entire firm. Another examines profitability relative to sales, by estimating a profit margin.
I. Return on Assets (ROA) & Return on Capital (ROC)
The return on assets (ROA) of a firm measures its operating efficiency in generating profits from its assets, prior to the effects of financing.
(
)
Assets Total
rate tax -1 EBIT ROA=
Earnings before interest and taxes (EBIT) is the accounting measure of operating income from the income statement and total assets refers to the assets as measured using accounting rules, i.e., using book value for most assets. Alternatively, return on assets can be written as:
(
)
Assets Total
rate tax -1 Expenses Interest
Income Net
ROA= +
By separating the financing effects from the operating effects, the return on assets provides a cleaner measure of the true return on these assets.
ROA can also be computed on a pre-tax basis with no loss of generality, by using the earnings before interest and taxes (EBIT), and not adjusting for taxes
-Assets Total EBIT ROA tax -Pre =
This measure is useful if the firm or division is being evaluated for purchase by an acquirer with a different tax rate or structure.
A more useful measure of return relates the operating income to the capital invested in the firm, where capital is defined as the sum of the book value of debt and equity. This is the return on capital (ROC). When a substantial portion of the liabilities is either current (such as accounts payable) or non-interest bearing, this approach provides a better measure of the true return earned on capital employed in the business.
( )
Equity of BV Debt of BV t -1 EBIT ROC Tax -After + = Equity of BV Debt of BV EBIT ROC Tax -Pre + =Illustration 3.4: Estimating Return on Capital
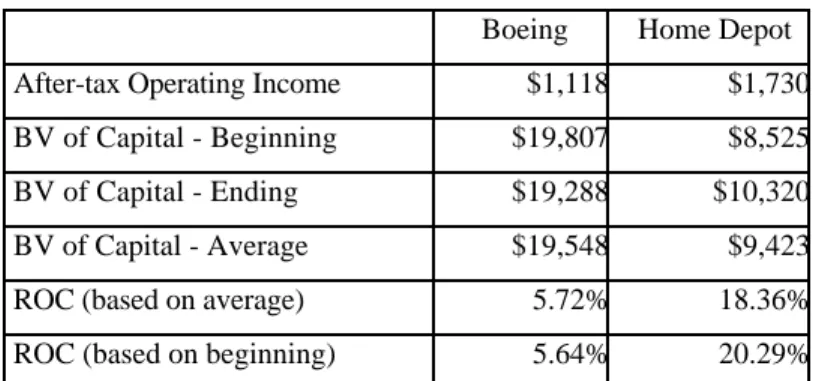
Table 3.5 summarizes the after-tax return on asset and return on capital estimates for Boeing, the Home Depot and InfoSoft, using both average and beginning measures of capital in 1998:
Table 3.5: Return on Capital
Boeing Home Depot After-tax Operating Income $1,118 $1,730 BV of Capital - Beginning $19,807 $8,525 BV of Capital - Ending $19,288 $10,320 BV of Capital - Average $19,548 $9,423 ROC (based on average) 5.72% 18.36% ROC (based on beginning) 5.64% 20.29%
Boeing had a terrible year in terms of after-tax returns. The Home Depot had a much better year.
Decomposing Return on Capital
The return on capital of a firm can be written as a function of its operating profit margin and its capital turnover ratio.
After - Tax ROC= EBIT 1-t
( )
BV of Capital =EBIT 1-t
( )
Sales XSales BV of Capital
=After -Tax Operating Margin * Capital Turnover Ratio Pre- Tax ROC=Pre -Tax Operating Margin * Capital Turnover Ratio
Thus, a firm can arrive at a high ROC by either increasing its profit margin or more efficiently utilizing its capital to increase sales. There are likely to be competitive constraints and technological constraints on increasing sales, but firms still have some freedom within these constraints to choose the mix of profit margin and capital turnover that maximizes their ROC. The return on capital varies widely across firms in different businesses, largely as a consequence of differences in profit margins and capital turnover ratios.
mgnroc.xls: There is a dataset on the web that summarizes the operating margins,
turnover ratios and returns on capital of firms in the United States, classified by industry. II. Return on Equity
While the return on capital measures the profitability of the overall firm, the return
on equity (ROE) examines profitability from the perspective of the equity investor by
relating profits to the equity investor (net profit after taxes and interest expenses) to the book value of the equity investment.
Equity Common of
Value Book
Income Net
ROE=
Since preferred stockholders have a different type of claim on the firm than do common stockholders, the net income should be estimated after preferred dividends and the book value of common equity should not include the book value of preferred stock. This can be accomplished by using net income after preferred dividends in the numerator and the book value of common equity in the denominator.
Determinants of ROE
Since the ROE is based upon earnings after interest payments, it is affected by the financing mix the firm uses to fund its projects. In general, a firm that borrows money to finance projects and that earns a ROC on those projects exceeding the after-tax interest rate
it pays on its debt will be able to increase its ROE by borrowing. The ROE can be written as follows8:
( )
(
ROC-i1-t)
E D ROC
ROE= +
where,
( )
Equity of BV Debt of BV t -1 EBIT ROC + = Equity of BV Debt of BV E D = Debt of BV Debt on Expense Interest i=t = Marginal tax rate on ordinary income
The second term captures the benefit of financial leverage.
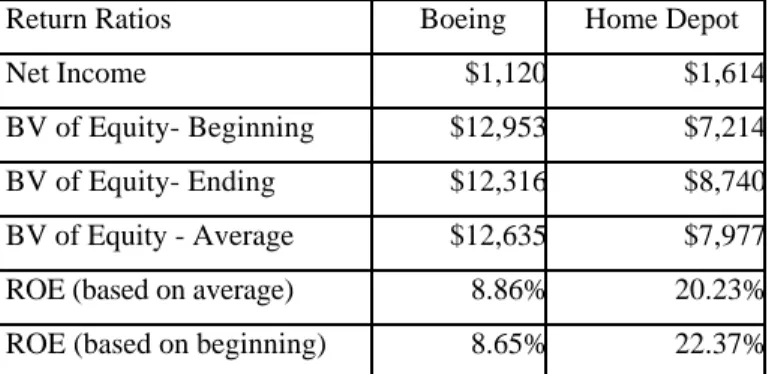
Illustration 3.5: ROE Computations
Table 3.6 summarizes the return on equity for Boeing and the Home Depot in 1998:
Table 3.6: Return on Equity
Return Ratios Boeing Home Depot
Net Income $1,120 $1,614
BV of Equity- Beginning $12,953 $7,214 BV of Equity- Ending $12,316 $8,740 BV of Equity - Average $12,635 $7,977 ROE (based on average) 8.86% 20.23% ROE (based on beginning) 8.65% 22.37%
The results again indicate that Boeing had a poor year in 1998, while the Home Depot reported a healthier return on equity. The returns on equity can also be estimated by decomposing into the components specified above (using the adjusted beginning of the year numbers):
Boeing Home Depot
After-tax ROC 5.82% 16.37%
8
( )
( ) ( ) ( ) ( )
( ) ( ) ( ) ( ) ROE
E NI E t -1 IE E t -1 IE E NI E t -1 IE E D 1 E D t -1 IE NI D t -1 IE E D t -1 IE NI E D E D t -1 IE NI t -1 i -ROC E D ROC = = − + = − + + + = − + + + + + = +
Debt/Equity Ratio 35.18% 48.37% Book Interest Rate (1-tax rate) 4.22% 4.06%
ROE 6.38% 22.33%
Note that we used a tax rate of 35% on both the return on capital and the book interest rate. This approach results in a return on equity that is different from the one estimated using the net income and the book value of equity.
rocroe.xls: There is a dataset on the web that summarizes the return on capital,
debt equity ratios, book interest rates and returns on equity of firms in the United States, classified by industry.
Measuring Risk
How risky are the investments the firm has made over time? How much risk do equity investors in a firm face? These are two more questions that we would like to find the answer to in the course of an investment analysis. Accounting statements do not really claim to measure or quantify risk in a systematic way, other than to provide footnotes and disclosures where there might be risk embedded in the firm. In this section, we will examine some of the ways in which accountants try to assess risk.
Accounting Principles Underlying Risk Measurement
To the extent that accounting statements and ratios do attempt to measure risk, there seem to be two common themes.
a. The first is that the risk being measured is the risk of default, i.e. the risk that a fixed obligation, such as interest or principal due on outstanding debt, will not be met. The broader equity notion of risk, which measures the variance of actual returns around expected returns, does not seem to receive much attention. Thus, an all-equity-financed firm with positive earnings and few or no fixed obligations will generally emerge as a low-risk firm from an accounting standpoint, in spite of the fact that its earnings are unpredictable.
b. Accounting risk measures generally take a static view of risk, by looking at the capacity of a firm at a point in time to meet its obligations. For instance, when ratios are used to assess a firm's risk, the ratios are almost always based upon one period's income statement and balance sheet.
Accounting Measures of Risk
Accounting measures of risk can be broadly categorized into two groups. The first is disclosures about potential obligations or losses in values that show up as footnotes on balance sheets, which are designed to alert potential or current investors to the possibility of significant losses. The second is the ratios that are designed to measure both liquidity and default risk.
Disclosures in Financial Statements
In recent years, the number of disclosures that firms have to make about future obligations has proliferated. Consider, for instance, the case of contingent liabilities. These refer to potential liabilities that will be incurred under certain contingencies, as is the case when a firm is the defendant in a lawsuit. The general rule that has been followed is to ignore contingent liabilities which hedge against risk, since the obligations on the contingent claim will be offset9 by benefits elsewhere. In recent periods, however, significant losses borne by firms from supposedly hedged derivatives positions (such as options and futures) have led to FASB requirements that these derivatives be disclosed as part of a financial statement. In fact, pension fund and health care obligations have moved from mere footnotes to actual liabilities for firms.
Financial Ratios
Financial statements have long been used as the basis for estimating financial ratios that measure profitability, risk and leverage. In the section on earnings, we looked at two of the profitability ratios – return on equity and return on capital . In this section, we will look at some of the financial ratios that are often used to measure the financial risk in a firm.
1. Short-Term Liquidity Risk
Short-term liquidity risk arises primarily from the need to finance current operations. To the extent that the firm has to make payments to its suppliers before it gets paid for the goods and services it provides, there is a cash shortfall that has to be met, usually through short-term borrowing. Though this financing of working capital needs is done routinely in most firms, financial ratios have been devised to keep track of the extent of the firm's exposure to the risk that it will not be able to meet its short-term obligations. The two most frequently used to measure short-term liquidity risk are the current ratio and the quick ratio.
9 This assumes that the hedge is set up competently. It is entirely possible that a hedge, if sloppily set up,
The current ratio is the ratio of current assets (cash, inventory, accounts receivable) to its current liabilities (obligations coming due within the next period).
s Liabilitie Current
Assets Current Ratio
Current =
A current ratio below one, for instance, would indicate that the firm has more obligations coming due in the next year than assets it can expect to turn to cash. That would be an indication of liquidity risk.
While traditional analysis suggests that firms maintain a current ratio of 2 or greater, there is a trade-off here between minimizing liquidity risk and tying up more and more cash in net working capital (Net working capital = Current Assets - Current Liabilities). In fact, it can be reasonably argued that a very high current ratio is indicative of an unhealthy firm, which is having problems reducing its inventory. In recent years, firms have worked at reducing their current ratios and managing their net working capital better.
Reliance on current ratios has to be tempered by a few concerns. First, the ratio can be easily manipulated by firms around the time of financial reporting dates to give the illusion of safety; second, current assets and current liabilities can change by an equal amount, but the effect on the current ratio will depend upon its level10 before the change.
The quick or acid test ratio is a variant of the current ratio. It distinguishes current assets that can be converted quickly into cash (cash, marketable securities) from those that cannot (inventory, accounts receivable).
s Liabilitie Current
Securities Marketable
Cash Ratio
Quick = +
The exclusion of accounts receivable and inventory is not a hard and fast rule. If there is evidence that either can be converted into cash quickly, it can, in fact, be included as part of the quick ratio.
Turnover ratios measure the efficiency of working capital management by looking
at the relationship of accounts receivable and inventory to sales and to the cost of goods sold.
Receivable Accounts
Average
Sales Turnover
Receivable
Accounts =
Inventory Average Sold Goods of Cost Turnover
Inventory =
These ratios can be interpreted as measuring the speed with which the firm turns accounts receivable into cash or inventory into sales. These ratios are often expressed in terms of the number of days outstanding.
Turnover Receivable 365 g Outstandin Receivable Days = Turnover Inventory 365 Held Inventory Days =
A similar pair of ratios can be computed for accounts payable, relative to purchases.
Payable Accounts Average Purchases Turnover Payable Accounts = Turnover Payable Accounts 365 g Outstandin Payable Accounts Days =
Since accounts receivable and inventory are assets and accounts payable is a liability, these three ratios (standardized in terms of days outstanding) can be combined to get an estimate of how much financing the firm needs to fund working capital needs.
+ + = g Outstandin Payable Days Held Inventory Days g Outstandin Receivable Days Period Financing Required
The greater the financing period for a firm, the greater is its short-term liquidity risk.
wcdata.xls: This is a dataset on the web that summarizes working capital ratios for
firms in the United States, classified by industry.
finratio.xls: This spreadsheet allows you to compute the working capital ratios for a firm, based upon financial statement data.
2. Long-term Solvency and Default risk
Measures of long-term solvency attempt to examine a firm's capacity to meet interest and principal payments in the long term. Clearly, the profitability ratios discussed earlier in the section are a critical component of this analysis. The ratios specifically designed to measure long term solvency try to relate profitability to the level of debt payments, to identify the degree of comfort with which the firm can meet these payments.
Interest Coverage Ratios
The interest coverage ratio measures the capacity of the firm to meet interest payments from pre-debt, pre-tax earnings.
Expenses Interest
EBIT Ratio
Coverage
Interest =
The higher the interest coverage ratio, the more secure is the firm's capacity to make interest payments from earnings. This argument however has to be tempered by the recognition that earnings before interest and taxes is volatile and can drop significantly if the economy enters a recession. Consequently, two firms can have the same interest coverage ratio but be viewed very differently in terms of risk.
The denominator in the interest coverage ratio can be easily extended to cover other fixed obligations such as lease payments. If this is done, the ratio is called a fixed charges
coverage ratio.
Fixed Chargeds Coverage Ratio =EBIT + Fixed Charges Fixed Charges
Finally, this ratio, while stated in terms of earnings, can be restated in terms of cash flows, by using earnings before interest, taxes and depreciation (EBITDA) in the numerator and cash fixed charges in the denominator.
Charges Fixed
Cash
EBITDA Ratio
Coverage Charges
Fixed
Cash =
Both interest coverage and fixed charge ratios are open to the criticism that they do not consider capital expenditures, a cash flow that may be discretionary in the very short term,
but not in the long term if the firm wants to maintain growth. One way of capturing the extent of this cash flow, relative to operating cash flows, is to compute a ratio of the two.
es Expenditur Capital
Operations from
flows Cash es
Expenditur Capital
to flow Cash
Operating =
While there are a number of different definitions of cash flows from operations, the most reasonable way of defining it is to measure the cash flows from continuing operations, before interest but after taxes, and after meeting working capital needs.
Cash flow from operations = EBIT (1-tax rate) - ∆ Working Capital
covratio.xls: There is a dataset on the web that summarizes the interest coverage
and fixed charge coverage ratios for firms in the United States, classified by industry.
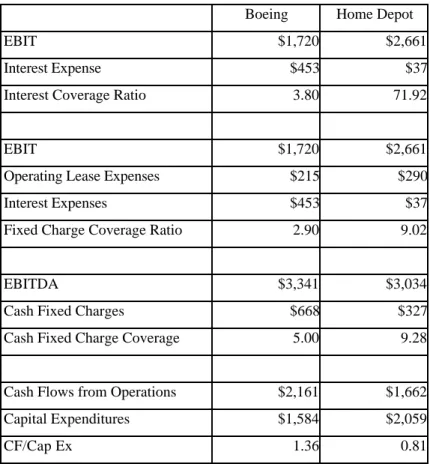
Illustration 3.6: Interest and Fixed Charge Coverage Ratios
Table 3.7 summarizes interest and fixed charge coverage ratios for Boeing and Home Depot in 1998:
Table 3.7: Interest and Fixed Charge Coverage Ratios
Boeing Home Depot
EBIT $1,720 $2,661
Interest Expense $453 $37
Interest Coverage Ratio 3.80 71.92
EBIT $1,720 $2,661
Operating Lease Expenses $215 $290
Interest Expenses $453 $37
Fixed Charge Coverage Ratio 2.90 9.02
EBITDA $3,341 $3,034
Cash Fixed Charges $668 $327
Cash Fixed Charge Coverage 5.00 9.28
Cash Flows from Operations $2,161 $1,662 Capital Expenditures $1,584 $2,059