2991 SHATTUCK AVENUE #203 | BERKELEY, CALIFORNIA 94705 | P: 510.647.5291 | F: 510.647.5295 | STRATEGICECONOMICS.COM
Date: September 28, 2012
To: Francie Stefan, City of Santa Monica
Peter James, City of Santa Monica Liz Bar-El, City of Santa Monica From: Dena Belzer, Strategic Economics
Amanda Gehrke, Strategic Economics Franklin Dingemans, Strategic Economics Project: Bergamot Area Plan
Subject: DRAFT Occupational-Wage Analysis and Residential Recommendations
This memo assesses the employment and demographic characteristics of workers currently employed in the Bergamot station study area to identify the types of residential units that are likely to meet these workers’ housing preferences and needs. Providing a stronger match between Bergamot workers and housing options could enable workers to live nearer to their jobs, reduce congestion, commute time, and vehicle miles traveled, as well as helping businesses in the Bergamot area to attract and retain skilled workers, one critical factor in helping the Bergamot area to remain a strong creative industry cluster.
The memo begins with an overview of demographic and commute patterns in the City of Santa Monica and the Bergamot study area, which provide insight into the current match between work force in the City and study area and the types of housing that will best fit the needs of existing Bergamot workers based on LA County wage data. The second section contains an analysis of wages earned by Bergamot workers and their associated residential purchasing power to understand, in the near term, what housing types would best suit these workers’ financial needs as well as their preferences as identified by a recent survey. This section includes a description of the methodology used in the analysis and a summary of key findings and recommendations.
Santa Monica and Bergamot Worker Demographics and Commute Pattern
This section contains a summary of key demographic trends and commute patterns for employees working in the Bergamot study area and the City of Santa Monica. This information provides insight into the housing needs and preferences of Bergamot workers. Data for this section are drawn from the U.S. Census Longitudinal Employer-Household Dynamics (LEHD) program and the Bergamot Area Plan Housing and Services Survey. Data from the Bergamot Area Plan Housing and Services Survey is provided at the study area level. U.S. Census data is provided at the City of Santa Monica level rather than the Bergamot study area level due to accuracy concerns in using the data at smaller geographies. Los Angeles County data is provided for comparative purposes.Many Bergamot workers currently have a substantial commute and report wanting to live closer to their offices. One-third (33 percent) of Bergamot worker survey respondents report an
Bergamot Area Plan Occupational-Wage Analysis and Residential Recommendations | 9/28/2012 DRAFT
2
evening commute of over 45 minutes1, compared to only 21 percent of Los Angeles County workers who experience commutes in this timeframe.2 The 2010 American Community Survey showed Santa Monicans commuted on average 26.1 minutes each way. This may be a function of the share of Santa Monica workers who commute into the city—only one in ten Santa Monica workers lives within Santa Monica.3 In comparison, approximately 34% of Santa Monicans also work in Santa Monica. According to a 2008 study done by the Westside Cities, approximately 49% of Santa Monica workers live in adjoining Westside city neighborhoods. However, over half of Bergamot workers report interest in moving into the area near Bergamot station4 to reduce their commute time, indicating
significant potential unmet demand for housing in Santa Monica from Bergamot workers. Demographic trends suggest that a significant share of unmet demand for housing may come from the Bergamot area’s younger workers. The City of Santa Monica workforce is generally characterized by younger workers compared to Los Angeles County, with more than one-quarter (26 percent) of City of Santa Monica workers under the age of 29, compared to 23 percent in Los Angeles County (Figure 1). At the same time, Santa Monica’s residential population is older, on average, than that of the surrounding county (only 31 percent of Santa Monica residents are under the age of 29, compared to 43 percent countywide). This mismatch suggests that current housing opportunities for younger workers in Santa Monica are limited.
The majority of Bergamot worker survey respondents is single and/or have no children, indicating strong potential demand for smaller housing types. More than half (53 percent) of the Bergamot Area Plan survey respondents report being single and 74 percent do not have children.5 In addition to preferring smaller housing units, research suggest that these household types, including young singles and households without children, have a strong preference for living in “walkable and mixed-use neighborhoods”, such as those planned for the Bergamot study area.6
Figure 1. City of Santa Monica Workers by Age
City of Santa Monica Los Angeles County
Number Percent Number Percent
Age 29 or younger 17,887 26% 834,743 23%
Age 30 to 54 40,348 58% 2,163,827 59%
Age 55 or older 10,829 16% 684,993 19%
Total 69,064 3,683,563
Source: U.S. Census Bureau, Longitudinal Employer-Household Dynamics Program, 2010; Strategic Economics 2012.
City of Santa Monica Residents by Age
City of Santa Monica Los Angeles County
Number Percent Number Percent
Age 29 or younger 27,846 31% 4,224,348 43%
Age 30 to 54 37,169 41% 3,515,402 36%
Age 55 or older 24,721 28% 2,078,855 21%
Total 89,736 9,818,605
Source: U.S. Census Bureau, Longitudinal Employer-Household Dynamics Program, 2010; Strategic Economics 2012.
1
City of Santa Monica, Bergamot Area Plan Housing and Services Survey.
2
U.S. Census Bureau, 2008-2010 American Community Survey.
3
U.S. Census Bureau, OnTheMap Application Longitudinal-Employer Household Dynamics Program, 2010.
4
City of Santa Monica, Bergamot Area Plan Housing and Services Survey.
5
Ibid.
6
Belden Russonello & Stewart, The 2011 Community Preference Survey (Washington D.C.: National Association of Realtors, March 2011), http://www.realtor.org/government_affairs/smart_growth/survey.
3
Earnings and Residential Purchasing Power
This section contains an analysis of wages earned by Bergamot workers to provide insight into the housing price points which might best align with this group’s ability to pay for housing either by renting or purchasing a unit. For purposes of this discussion, the amount workers can afford to pay will be referred to as “purchasing power” although this term will, in fact, refer to each worker’s disposable income available to either rent or purchase a unit. The section begins with an overview of the methodology used in conducting the analysis, followed by results and key findings.
Wage-Occupation Methodology
This section describes the multi-step process used to analyze the occupations and associated wages for Bergamot workers. The process described in subsequent paragraphs refers to figures included at the end of the memo. Economic terms used frequently in this description include industry, occupation, and wage. An industry is a sector of the economy associated with a specific kind of product or service; every business belongs to an industry. Every business also employs workers, each of which has an occupation. An occupation defines the kind of work that an individual does on a day-to-day basis, and businesses in different industries employ workers of different occupations. However, businesses within an industry tend to employ occupations in common ratios that can be quantified. This analysis starts with employment by industry and uses said ratios to translate employment by industry into the appropriate occupational mix. Finally, each occupation is associated with a range of wages (wages in this memo refers to annual wages). We use the arithmetic mean to represent the average wage within this range. Ultimately, our goal is to move from employment by industry, to employment by occupation, to employment by occupation and wage. This methodology provides a much more detailed understanding of what workers can afford than simply looking at average wages by industry.
In order to model the residential purchasing power of Bergamot workers, Strategic Economics began with point-level employment data7 for the study area—that is, a list of business with information about their geographic location, number of employees, and industry. This data was then aggregated by 4-digit North American Industry Classification System (NAICS) code to define employment in Bergamot by industry (the first three columns of Figure 2). Next, each industry’s employment total was broken down into its component occupations using the 2010-2020 California Industry-Occupational Matrix produced by the California Employment Development Department (EDD).8 This provided an estimate of employment by industry and occupation in the study area. Mean wage9 data was then attached to each occupation using the EDD’s occupational wage dataset for Los Angeles County10, and the weighted mean wage for each industry was calculated (last column of Figure 2). Unfortunately not all industries are represented in the Industry-Occupational Matrix—those absent from the matrix are noted with a dash, and do not factor in to the remaining analysis. These excluded industries represent 14 percent of Bergamot employment. The only top employer excluded is Toms Shoes, which is no longer located in the study area.
7
Urban Explorer, 2011; Dun & Bradstreet, 2011.
8
California Employment Development Department, California Industry-Occupational Matrix 2010 – 2020.
9
Mean wages are used rather than median wages because the EDD only calculates median wages on an hourly basis. Using mean wages avoids the error associated with assuming a number of hours worked per year.
10
California Employment Development Department, Los Angeles Occupational Employment (May 2011) & Wage (2012 - 1st Quarter) Data.
Bergamot Area Plan Occupational-Wage Analysis and Residential Recommendations | 9/28/2012 DRAFT
4
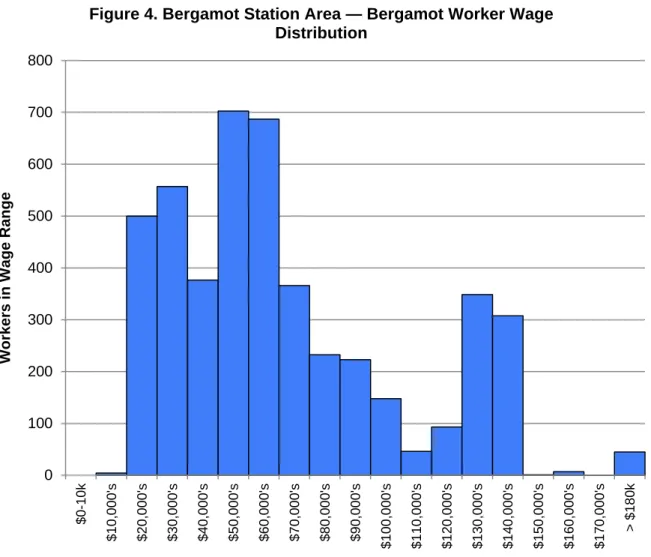
See Figure 3 for a list of common occupations in the largest industries in the study area, as well as the modeled wage distribution of top industries as measured by the total number of jobs. The occupations shown in this table account for approximately 24 percent of total employment in the study area. The complete modeled distribution of wages in the study area is shown in Figure 4. The final step of the analysis is to translate the wages by occupation into housing purchasing power using affordability calculations in order to inform recommendations about housing types. Figure 5 and
Figure 6 show the estimated distribution of housing purchasing power for current Bergamot study area workers.
Housing purchasing power estimates are based on a set of assumptions around the typical share of income spent on housing and other costs associated with housing rental or purchase. These affordability calculations assume one worker per household, paying $160 per month in utilities and spending 30 percent of income on housing. The assumption of one worker per household is based in part on the relatively small household sizes in the City of Santa Monica (1.87 persons per household in 2010, compared to 3.01 for Los Angeles County) and the low ratio of workers to households (1.00 worker per household in 2010).11,12 In addition, the assumption of one worker per household is a product of the demographic attributes of Bergamot workers—younger, single, without children— which suggest that they may prefer to live alone if it was economically viable. For-sale housing cost assumptions include $250 per month in homeowner’s association (HOA) fees, 10 percent property taxes and insurance, with a 30-year 5.5 percent interest mortgage and a 15 percent down payment.13It is important to note that these assumptions are conservative. Current mortgage interest rates are more favorable than this (although rates are unlikely to remain low in the long-term). Some workers will have other sources of income or will not be the sole income earner in their household. For these reasons, the models of rental and purchasing power used here should be considered conservative estimates of what Bergamot workers could afford.
Wage-Occupation Analysis Key Findings and Summary of Recommendations
Creative industries dominate the study area employment, with the Motion Picture and Video industry accounting for the greatest number of workers in the Bergamot study area. The top three industries in Bergamot—Motion Picture and Video; Specialized Design Services; and Advertising, Public Relations and Specialized Services—account for more than half of total employment (Figure 2). The Motion Picture industry is the area’s largest single employer, comprising approximately 39 percent of study area employment. This industry includes several sub-industries, including TV and movie production, licensing, and distribution. The purchasing power of Bergamot workers is therefore heavily influenced by the wages paid to employees of these particular industries.
Study area incomes are greater than those in Los Angeles County. The average wage for Bergamot workers is approximately $71,452 (Figure 2), compared to $68,121 for a one-worker household in Los Angeles County in 2011.14,15 Both of these wages are significantly higher than the County area overall median worker income of $27,422.16 These wages suggest that Bergamot
11
U.S. Census Bureau, 2010 American Community Survey.
12
U.S. Census Bureau, OnTheMap Application Longitudinal-Employer Household Dynamics Program, 2010.
13
The utility costs, HOA fees, taxes, insurance, and portion of income available for housing expenditure used here are industry standard values for affordability calculations.
14
Given the assumption that Bergamot workers will live in a one-worker household, wages in the Bergamot area are compared to those of a one-worker household in Los Angeles County.
15
U.S. Census Bureau, 2011 American Community Survey.
5
workers can afford higher housing costs relative to the overall workforce in Los Angeles County.
Despite the relatively high average wage for Bergamot area workers, wages vary significantly both among and within industries. Figure 3 depicts typical occupations, wages and wage distributions in Bergamot’s top six industries, which represent 64 percent of study area employment, and illustrates how wages vary within industries. For example, although the mean wage in the Motion Picture and Video industry is $81,657, most workers earn in the range of either $30,000 to $60,000 or $120,000 to $150,000 range annually. Wages for occupations in Graphic Design Services, Advertising, Public Relations and Specialized Services, Accounting, Tax Preparation, Bookkeeping, and Payroll Services and Business, Professional, Labor, Political, and Similar Organizations are all more likely to earn less than $90,000 per year. By comparison, typical wages in the Computer Systems Design and Related Services are significantly higher and more likely to fall between $60,000 and $120,000 per year. These variances within wage distribution suggest that Bergamot workers are in need of housing at a range of price points.
Although Bergamot workers can afford housing at a range of price points, many could not afford to live in Santa Monica today. Real estate and rental listing websites report typical single family home prices in the City of Santa Monica at more than $800,000, with one-bedroom condos starting at $500,000 and two-bedroom condos starting at $650,000. Rents for one bedroom apartments are at least $1,500-2,500 per month.17 At these prices, only 45 percent of Bergamot workers could afford to rent a home in Santa Monica as a single person and only 15 percent could afford to purchase a one-bedroom condominium (Figures 5 and 6). As a single person, one percent could afford to purchase a single-family home or two-bedroom condominium.
The provision of housing in the Bergamot area with rents of $1,000 to $1,500 per month would greatly expand the share of Bergamot workers able to live in the City in single income households. Only 44 percent of Bergamot workers can afford rents of more than $1,500 per month if there is only one wage earner; an additional 28 percent of workers could afford to live in the area if rental rates included options between $1,000 and $1,500 per month. In order to improve for-sale housing affordability by Bergamot workers, prices would need to drop significantly—only 47 percent of Bergamot workers could afford a home starting at $210,000 in single income households. It is important to note, however, that these affordability estimates are conservative and do not account for other sources of income or more favorable lending rates. In addition, these estimates do not account for households with multiple incomes.
Providing housing affordable to a wider range of Bergamot workers would enable more Bergamot workers to live in Santa Monica, thereby reducing commute times, vehicle miles traveled and commute trips from outside of the City. In addition, Some Bergamot businesses report moving to Santa Monica as a way to attract and retain workers;18 given that Bergamot businesses employ workers at a range of wage levels, housing a more economically diverse group of workers—including younger, creative workers—would further improve the City’s competitive advantage in attracting creative businesses. And, providing local housing for local workers could help the area meet its goals to generate no net new trips with new development.
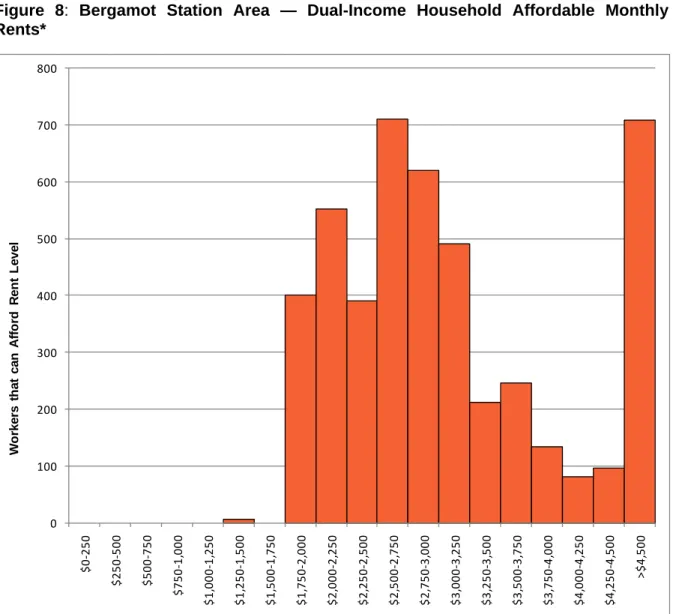
Most workers living in dual-income households are able to afford rental housing in Santa Monica. For Bergamot workers living with residents earning the Santa Monica per capita income of
17
Zillow, City of Santa Monica, Santa Monica Real Estate Market Report, 2012.
Bergamot Area Plan Occupational-Wage Analysis and Residential Recommendations | 9/28/2012 DRAFT
6
$58,399,19 nearly all (99.9 percent) are able to afford a one-bedroom apartment and most (79 percent) can afford a two-bedroom apartment20(Figures 7 and 8). In comparison, only 42 percent of dual-income households could afford a one-bedroom condominium and 21 percent a two-bedroom condo. Fewer than 18 percent could afford a single-family home.
7
Figure 2. Bergamot Station Area Industries* — Employment and Mean Wage Estimates
4-Digit
NAICS Description Employment LA Mean Wage
5121 Motion Picture and Video Industries 1,767 $81,657 5414 Specialized Design Services 450 $70,245 5418 Advertising, Public Relations, and Related Services 289 $67,215 5412 Accounting, Tax Preparation, Bookkeeping, and Payroll Services 139 $61,606 5415 Computer Systems Design and Related Services 127 $89,252 8139 Business, Professional, Labor, Political, and Similar Organizations 110 $63,189 6111 Elementary and Secondary Schools 103 $53,398 3161 Leather and Hide Tanning and Finishing 90 - 2381 Foundation, Structure, and Building Exterior Contractors 71 $51,925 5413 Architectural, Engineering, and Related Services 71 $81,920 7121 Museums, Historical Sites, and Similar Institutions 67 -
5122 Sound Recording Industries 61 -
4239 Miscellaneous Durable Goods Merchant Wholesalers 54 - 7113 Promoters of Performing Arts, Sports, and Similar Events 53 - 8111 Automotive Repair and Maintenance 53 $35,904
5614 Business Support Services 50 $44,794
5416 Management, Scientific, and Technical Consulting Services 49 $79,120
7221 Full-Service Restaurants 48 -
6116 Other Schools and Instruction 47 $55,676 3343 Audio and Video Equipment Manufacturing 46 - 3231 Printing and Related Support Activities 40 - 5419 Other Professional, Scientific, and Technical Services 36 $56,122 4461 Health and Personal Care Stores 30 - 6242 Community Food and Housing, and Emergency and Other Relief Services 30 $49,736 5171 Wired Telecommunications Carriers 29 $64,560
5179 Other Telecommunications 29 -
4431 Electronics and Appliance Stores 28 - 2361 Residential Building Construction 27 $57,417 5312 Offices of Real Estate Agents and Brokers 27 $56,908 2383 Building Finishing Contractors 26 $49,917 8134 Civic and Social Organizations 26 $40,480 2382 Building Equipment Contractors 25 $60,049 4539 Other Miscellaneous Store Retailers 25 $30,751 4234
Professional and Commercial Equipment and Supplies Merchant
Wholesalers 21 $66,426
4238 Machinery, Equipment, and Supplies Merchant Wholesalers 17 $57,365 4249 Miscellaneous Nondurable Goods Merchant Wholesalers 17 $49,725 7115 Independent Artists, Writers, and Performers 17 $76,082 3221 Pulp, Paper, and Paperboard Mills 16 - 5617 Services to Buildings and Dwellings 16 $33,142 5324 Commercial and Industrial Machinery and Equipment Rental and Leasing 14 $55,438 5611 Office Administrative Services 13 $62,359
8121 Personal Care Services 12 $28,367
5239 Other Financial Investment Activities 11 $81,529 7111 Performing Arts Companies 10 $56,201
Total All Industries 4,501 $71,452
*Employing ten or more workers
Sources: California Employment Development Department, California Industry-Occupational Matrix 2010 - 2020 & Los Angeles Occupational Employment (May 2011) & Wage (2012 - 1st Quarter) Data; Urban Explorer, 2011; Dun & Bradstreet, 2011; Strategic Economics, 2012.
Bergamot Area Plan Occupational-Wage Analysis and Residential Recommendations | 9/28/2012 DRAFT
8
Figure 3. Selected Occupations and Mean Wage Distribution for Bergamot Station Area Major Industries
Description Employment LA Mean Wage CA/LA Industry Wage Distribution
Motion Picture and Video Industries 1,767 $81,657
Producers and Directors $141,592
Media and Communication Workers, All Other $69,581
Film and Video Editors $104,110
Multimedia Artists and Animators $91,032
Office and Administrative Support Workers, All Other $31,959
Graphic Designers $60,404
Writers and Authors $116,524
Camera Operators, Television, Video, and Motion Picture $81,050
Computer Programmers $85,827
Specialized Design Services 450 $70,245
Graphic Designers $60,404
Interior Designers $62,777
Commercial and Industrial Designers $59,797
General and Operations Managers $132,691
Art Directors $120,341
Secretaries and Administrative Assistants, Except Legal, Medical, and Executive $37,465
Advertising, Public Relations, and Related Services 289 $67,215
Demonstrators and Product Promoters $32,544
Advertising Sales Agents $67,025
Public Relations Specialists $72,010
Market Research Analysts and Marketing Specialists $65,840
Relativ e Frequency Relativ e Frequency Relativ e Frequency
9
Accounting, Tax Preparation, Bookkeeping, and Payroll Services 139 $61,606
Accountants and Auditors $75,131
Bookkeeping, Accounting, and Auditing Clerks $40,378
Billing and Posting Clerks $36,049
Tax Preparers $42,704
Computer Systems Design and Related Services 127 $89,252
Software Developers, Applications $95,406
Computer Programmers $85,827
Computer Support Specialists $54,859
Computer and Information Systems Managers $137,605
Business, Professional, Labor, Political, and Similar Organizations 110 $63,189
Human Resources, Training, and Labor Relations Specialists, All Other
$71,488
Business Operations Specialists, All Other $70,941
Secretaries and Administrative Assistants, Except Legal, Medical, and Executive $37,465
General and Operations Managers $132,691
Sources: California Employment Development Department, California Industry-Occupational Matrix 2010 - 2020 & Los Angeles Occupational Employment (May 2011) & Wage (2012 - 1st Quarter) Data; Urban Explorer, 2011; Dun & Bradstreet, 2011; Strategic Economics, 2012.
Relativ e Frequency Relativ e Frequency Relativ e Frequency
Bergamot Area Plan Occupational-Wage Analysis and Residential Recommendations | 9/28/2012 DRAFT
10
Sources: California Employment Development Department, California Industry-Occupational Matrix 2010 - 2020 & Los Angeles Occupational Employment (May 2011) & Wage (2012 - 1st Quarter) Data; Urban Explorer, 2011; Dun & Bradstreet, 2011; Strategic Economics, 2012. 0 100 200 300 400 500 600 700 800 $0 -10 k $1 0,00 0' s $2 0,00 0' s $3 0,00 0' s $4 0,00 0' s $5 0,00 0' s $6 0,00 0' s $7 0,00 0' s $8 0,00 0' s $9 0,00 0' s $1 00 ,0 00 's $1 10 ,0 00 's $1 20 ,0 00 's $1 30 ,0 00 's $1 40 ,0 00 's $1 50 ,0 00 's $1 60 ,0 00 's $1 70 ,0 00 's > $1 80 k Workers in Wage Range
Figure 4. Bergamot Station Area — Bergamot Worker Wage Distribution
11
Sources: California Employment Development Department, California Industry-Occupational Matrix 2010 - 2020 & Los Angeles Occupational Employment (May 2011) & Wage (2012 - 1st Quarter) Data; Urban Explorer, 2011; Dun & Bradstreet, 2011; Strategic Economics, 2012. 0 100 200 300 400 500 600 700 800 $0 -25 0 $2 50 -500 $5 00 -750 $7 50 -1,00 0 $1 ,000 -1,25 0 $1 ,250 -1,50 0 $1 ,500 -1,75 0 $1 ,750 -2,00 0 $2 ,000 -2,25 0 $2 ,250 -2,50 0 $2 ,500 -2,75 0 $2 ,750 -3,00 0 $3 ,000 -3,25 0 $3 ,250 -3,50 0 $3 ,500 -3,75 0 $3 ,750 -4,00 0 $4 ,000 -4,25 0 $4 ,250 -4,50 0 > $4,5 0 0 Workers that can
Afford Rent Lev
e
l
Figure 5. Bergamot Station Area — Single-Income Household Affordable Monthly Rents
Bergamot Area Plan Occupational-Wage Analysis and Residential Recommendations | 9/28/2012 DRAFT
12
Sources: California Employment Development Department, California Industry-Occupational Matrix 2010 - 2020 & Los Angeles Occupational Employment (May 2011) & Wage (2012 - 1st Quarter) Data; Urban Explorer, 2011; Dun & Bradstreet, 2011; Strategic Economics, 2012. 0 100 200 300 400 500 600 700 800 $0 -10 k $1 0k-5 0k $5 0k-9 0k $9 0k-1 30k $1 30 k-170 k $1 70 k-210 k $2 10 k-250 k $2 50 k-290 k $2 90 k-330 k $3 30 k-370 k $3 70 k-410 k $4 10 k-450 k $4 50 k-490 k $4 90 k-530 k $5 30 k-570 k $5 70 k-610 k $6 10 k-650 k $6 50 k-690 k > $69 0k Workers that can Afford Home Price
Figure 6. Bergamot Station Area — Single-Income HouseholdsHome Purchasing Power
13
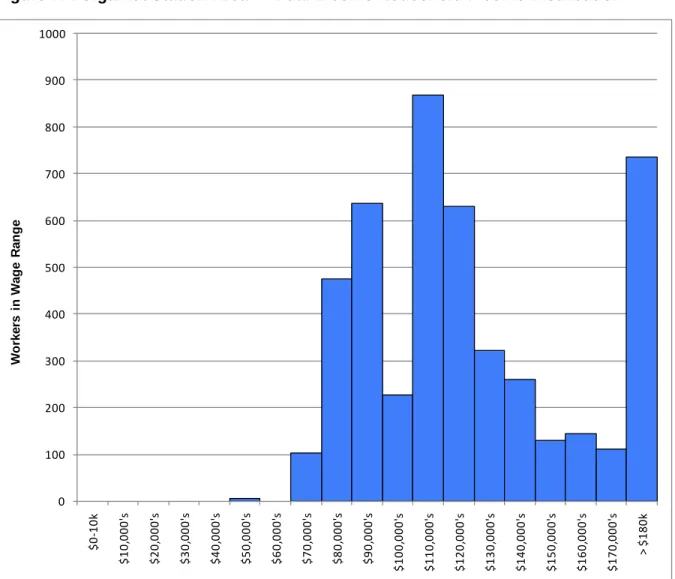
Figure 7: Bergamot Station Area — Dual-Income Household Income Distribution*
*For a theoretical household with two incomes: one Bergamot worker, and one worker with the Santa Monica per capita income of $58,399.
Sources: California Employment Development Department, California Industry-Occupational Matrix 2010 - 2020 & Los Angeles Occupational Employment (May 2011) & Wage (2012 - 1st Quarter) Data; Urban Explorer, 2011; Dun & Bradstreet, 2011; Strategic Economics, 2012. 0 100 200 300 400 500 600 700 800 900 1000 $0 ‐ 10k $1 0, 000 's $2 0, 000 's $3 0, 000 's $4 0, 000 's $5 0, 000 's $6 0, 000 's $7 0, 000 's $8 0, 000 's $9 0, 000 's $10 0, 000 's $11 0, 000 's $12 0, 000 's $13 0, 000 's $14 0, 000 's $15 0, 000 's $16 0, 000 's $17 0, 000 's > $180k Wo rker s i n Wag e R a n g e
Bergamot Area Plan Occupational-Wage Analysis and Residential Recommendations | 9/28/2012 DRAFT
14
Figure 8: Bergamot Station Area — Dual-Income Household Affordable Monthly Rents*
*For a theoretical household with two incomes: one Bergamot worker, and one worker with the Santa Monica per capita income of $58,399.
Sources: California Employment Development Department, California Industry-Occupational Matrix 2010 - 2020 & Los Angeles Occupational Employment (May 2011) & Wage (2012 - 1st Quarter) Data; Urban Explorer, 2011; Dun & Bradstreet, 2011; Strategic Economics, 2012. 0 100 200 300 400 500 600 700 800 $0 ‐ 250 $250 ‐ 500 $500 ‐ 750 $750 ‐ 1, 00 0 $1, 000 ‐ 1, 250 $1, 250 ‐ 1, 500 $1, 500 ‐ 1, 750 $1, 750 ‐ 2, 000 $2, 000 ‐ 2, 250 $2, 250 ‐ 2, 500 $2, 500 ‐ 2, 750 $2, 750 ‐ 3, 000 $3, 000 ‐ 3, 250 $3, 250 ‐ 3, 500 $3, 500 ‐ 3, 750 $3, 750 ‐ 4, 000 $4, 000 ‐ 4, 250 $4, 250 ‐ 4, 500 > $4, 500 Wo rker s t h at can A ff o rd R e n t L e v e l
15
Figure 9: Bergamot Station Area — Dual-Income Household Affordable Home Prices*
*For a theoretical household with two incomes: one Bergamot worker, and one worker with the Santa Monica per capita income of $58,399.
Sources: California Employment Development Department, California Industry-Occupational Matrix 2010 - 2020 & Los Angeles Occupational Employment (May 2011) & Wage (2012 - 1st Quarter) Data; Urban Explorer, 2011; Dun & Bradstreet, 2011; Strategic Economics, 2012. 0 100 200 300 400 500 600 700 800 900 $0 ‐ 10k $10k ‐ 50k $50k ‐ 90k $90k ‐ 130k $130k ‐ 170k $170k ‐ 210k $210k ‐ 250k $250k ‐ 290k $290k ‐ 330k $330k ‐ 370k $370k ‐ 410k $410k ‐ 450k $450k ‐ 490k $490k ‐ 530k $530k ‐ 570k $570k ‐ 610k $610k ‐ 650k $650k ‐ 690k > $690 k W o rker s t h at can A ff o rd H o m e P ri c e
Bergamot Area Plan Occupational-Wage Analysis and Residential Recommendations | 9/28/2012 DRAFT