Open Access
Research
Anti-inflammatory and anti-coagulatory activities of caffeic acid and
ellagic acid in cardiac tissue of diabetic mice
Pei-chun Chao
1,2, Cheng-chin Hsu
1and Mei-chin Yin*
3Address: 1Department of Nutritional Science, Chung Shan Medical University, Taichung City, Taiwan, Republic of China, 2Department of Nutrition, Chung Shan Medical University Hospital, Taichung City, Taiwan, Republic of China and 3Department of Nutrition, China Medical University, Taichung City, Taiwan, Republic of China
Email: Pei-chun Chao - cshc029@csh.org.tw; Cheng-chin Hsu - king@camu.edu.tw; Mei-chin Yin* - mcyin@mail.cmu.edu.tw * Corresponding author
Abstract
Background: Caffeic acid (CA) and ellagic acid (EA) are phenolic acids naturally occurring in many plant foods. Cardiac protective effects of these compounds against dyslipidemia, hypercoagulability, oxidative stress and inflammation in diabetic mice were examined.
Methods: Diabetic mice were divided into three groups (15 mice per group): diabetic mice with
normal diet, 2% CA treatment, or 2% EA treatment. One group of non-diabetic mice with normal diet was used for comparison. After 12 weeks supplement, mice were sacrificed, and the variation of biomarkers for hypercoagulability, oxidative stress and inflammation in cardiac tissue of diabetic mice were measured.
Results: The intake of CA or EA significantly increased cardiac content of these compounds,
alleviated body weight loss, elevated plasma insulin and decreased plasma glucose levels in diabetic mice (p < 0.05). These treatments also significantly enhanced plasma antithrombin-III and protein C activities (p < 0.05); and decreased triglyceride content in cardiac tissue and plasma (p < 0.05), in which the hypolipidemic effects of EA were significantly greater than that of CA (p < 0.05). CA or EA significantly lowered cardiac levels of malondialdehyde, reactive oxygen species, interleukin (IL)-beta, IL-6, tumor necrosis factor (TNF)-alpha and monocyte chemoattractant protein (MCP)-1 (p < 0.05); and retained cardiac activity of glutathione peroxidase (GPX), superoxide dismutase (SOD) and catalase (p < 0.05). These compounds also significantly up-regulated cardiac mRNA expression of GPX1, SOD and catalase; and down-regulated IL-1beta, IL-6, TNF-alpha and MCP-1 mRNA expression in diabetic mice (p < 0.05).
Conclusion: These results support that CA and EA could provide triglyceride-lowering,
anti-coagulatory, anti-oxidative, and anti-inflammatory protection in cardiac tissue of diabetic mice. Thus, the supplement of these agents might be helpful for the prevention or attenuation of diabetic cardiomyopathy.
Background
Diabetic cardiomyopathy, one of diabetic complications, remains the major cause of mortality in people with
dia-betes [1]. Lipid disorder, coagulation predomination, oxi-dative stress and inflammatory injury are important factors responsible for the development of diabetic
cardi-Published: 14 August 2009
Nutrition & Metabolism 2009, 6:33 doi:10.1186/1743-7075-6-33
Received: 24 June 2009 Accepted: 14 August 2009
This article is available from: http://www.nutritionandmetabolism.com/content/6/1/33
© 2009 Chao et al; licensee BioMed Central Ltd.
Page 2 of 8
omyopathy because these factors promote the progression of premature atherosclerosis, coronary insufficiency and myocardial infarction [2]. The hypercoagulability occurred in diabetic patients is due to the upregulation of blood coagulation factors such as fibrinogen, and/or downregulation of anticoagulation factors such as anti-thrombin-III (AT-III) [2,3]. Diabetes associated oxidative stress resulted from hyperglycemia-induced overproduc-tion of free radicals and reactive oxygen species (ROS) could cause necrosis and/or apoptosis in cardiomyocytes [4,5]. In addition, disturbed balance between Th1 and Th2 cytokines and overproduced pro-inflammatory cytokines such as interleukin (IL)-1beta, tumor necrosis factor (TNF)-alpha and monocyte chemoattractant pro-tein-1 (MCP-1) enhance systemic inflammatory stress and exacerbate diabetes associated cardiac dysfunctions [6,7]. Thus, any agent(s) with lipid-lowering, anti-coagulatory, anti-oxidative and/or anti-inflammatory activities may potentially prevent or delay the occurrence of diabetic car-diomyopathy.
Caffeic acid and ellagic acid are phenolic acids naturally occurring in many plant foods such as carrot, tomato, strawberry and blueberry [8,9]. It has been documented that these phenolic acids possess anti-oxidative activities such as scavenging free radicals and chelating metal ions [10,11]. Yamada et al. [12] reported that oral administra-tion of caffeic acid resulted in the presence of its intact form in mice liver. However, the information regarding the accumulation of caffeic acid or ellagic acid in cardiac tissue after dietary supplement is lacked. On the other hand, the anti-diabetic effects of caffeic acid have been examined [13,14]; and these authors observed that this compound could decrease blood glucose level. So far, less information is available regarding the anti-diabetic effect of ellagic acid; and it also remains unknown that caffeic acid or ellagic acid could protect cardiac tissue against dia-betes associated dyslipidemia, hypercoagulability, oxida-tive stress and inflammation.
The major purpose of this study was to investigate the lipid-lowering, coagulatory, oxidative and anti-inflammatory effects of caffeic acid and ellagic acid in car-diac tissue of diabetic mice. Also, the impact of these com-pounds on cardiac mRNA expression of antioxidant enzymes and cytokines was examined. These results could elucidate the possible action modes from these com-pounds against diabetic cardiomyopathy.
Materials and methods
Materials
Caffeic acid (CA, 99%), ellagic acid (EA, 99.5%) and other chemicals were purchased from Sigma Chemical Co. (St. Louis, MO, USA). All chemicals used in measurements were of the highest purity commercially available.
Animals
Male Balb/c mice, 3–4 wk old, were obtained from National Laboratory Animal Center (National Science Council, Taipei City, Taiwan). Mice were housed on a 12-h lig12-ht:dark sc12-hedule; water and mouse standard diet were consumed ad libitum. The use of mice was reviewed and approved by China Medical University animal care com-mittee (CMU-97-22-N). To induce diabetes, mice with body weights of 22.9 ± 0.8 g were treated with a single i.v. dose (50 mg/kg) of streptozotocin dissolved in citrate buffer (pH 4.5) into the tail vein of 12-h fasted mice. The blood glucose level was monitored on d 5 and 10 from the tail vein using a one-touch blood glucose meter (Lifescan, Inc. Milpitas, CA, USA). Mice with fasting blood glucose levels ≥ 14.0 mmol/l were used for this study.
Experimental design
CA or EA at 2 g was mixed with 98 g power diet containing (g/100 g): 64 starch, 23 protein, 3.5 fat, 5 fiber, 1 vitamin mixture and 3 salt mixture (PMI Nutrition International LLC, Brentwood, MO, USA). After diabetes was induced, mice were divided into three groups (15 mice per group): diabetic mice with normal diet, diabetic mice with 2% CA treatment, and diabetic mice with 2% EA treatment. One group of non-diabetic mice with normal diet was used for comparison. All mice had free access to food and water at all times. Body weight, consumed water volume and food were recorded. After 12 wk supplementation, mice were sacrificed with carbon dioxide. Blood was collected, and plasma was separated from erythrocytes immediately. Cardiac tissue was removed and perfused for 2 min by phosphate buffer saline (PBS, pH 7.2) to remove the remaining blood. Cardiac tissue at 0.2 g was homoge-nized on ice in 2 ml PBS, and the filtrate was collected. The protein concentration of plasma or cardiac tissue fil-trate was determined by the method of Lowry et al. [15] using bovine serum albumin as a standard. In all experi-ments, the sample was diluted to a final concentration of 1 g protein/l using PBS, pH 7.2.
Content of CA or EA in cardiac tissue
An HPLC method described in Yamada et al. [12] was used to analyze the cardiac content of intact form of CA or EA, in which an octadecylsilica column (4.6 × 250 mm, Wakopak, Wako Pure Chemical Industry, Tokyo, Japan), and a mobile phase consisting of 95.6% H2O, 4.1% ethyl acetate and 0.3% acetic acid were used at 30°C with a flow rate of 0.8 ml/min.
Assay of glucose, insulin, alanine aminotransferase (ALT) and aspartate aminotransferase (AST) activities
Charles, MO, USA). For glucose and insulin, the intra coefficients of variation (CVs) were 7.1 and 5.4%; and the inter CVs were 6.3 and 5.8%. Serum activity of ALT and AST were determined by using commercial assay kits (Randox Laboratories Ltd., Crumlin, UK), their intra and inter CVs were in the range of 2.5–4.6%.
Lipid analyses
Triglyceride (TG) and total cholesterol (TC) levels (g/l) in plasma were determined by triglycerides/GB kit and cho-lesterol/HP kit (Boehringer Mannheim, Germany), respectively. For TG and TC, their intra CVs were 4.3 and 5.0%; and their inter CVs were 3.7 and 4.8%. Total lipids were extracted from cardiac tissue, TG concentration (mg/ g wet tissue) was quantified by a colorimetric assay [16], and total cholesterol (mg/g wet tissue) was measured using o-phthalaldehyde [17].
Measurement of blood coagulation and anticoagulation factors
Blood samples were anticoagulated using sodium citrate according to the protocols provided by the manufacturers of the kits used. Plasma fibrinogen level (g/l) was meas-ured based on the principle of salting out using a commer-cial kit (Iatroset Fbg, Iatron Laboratory, Tokyo, Japan). Plasminogen activator inhibitor-1 (PAI-1) activity (kU/l) was assayed by a commercial kit (Trinity Biotech plc, Co. Wicklow, Ireland). For fibrinogen and PAI-1, the intra and inter CVs ranged from 5.4 to 6.7%. The activity (%) of AT-III and protein C in plasma was determined by chromog-enic assays according to the manufacturer'sinstruction s using commercial AT-III and protein C kits (Sigma Chem-ical Co., St. Louis, MO, USA), and was shown as ratio of those in normal human plasma. For AT-III and protein C, the intra CVs were 3.4 and 4.7%; and the inter CVs were 6.0 and 7.2%.
Determination of oxidative and anti-oxidative status
Glutathione (GSH) and oxidized glutathione (GSSG) concentrations (nmol/mg protein) in cardiac tissue were determined by commercial colorimetric GSH and GSSG assay kits (OxisResearch, Portland, OR, USA). For GSH and GSSG, the intra CVs were 5.0 and 5.8%; and the inter CVs were 4.2 and 6.0%. Glutathione peroxidase (GPX), catalase and superoxide dismutase (SOD) activities (U/ mg protein) in cardiac tissue were determined by com-mercial assay kits (Calbiochem Inc., San Diego, CA, USA). Their intra CVs were in the range of 6.3–7.5%; and inter CVs were in the range of 5.9–7.8%. Lipid oxidation in car-diac tissue was determined by measuring the level of malondialdehyde (MDA, μmol/mg protein) via an HPLC method [18]. The method described in Privratsky et al. [19] was used to determine the amount of ROS in cardiac tissue. Briefly, 10 mg cardiac tissue was homogenized in 1 ml of ice cold 40 mM Tris-HCl buffer (pH 7.4), and
fur-ther diluted to 0.25% with the same buffer. Then, samples were loaded with 10 μmol/l 2', 7'-dichlorofluorescin at 37°C for 30 min. After rinsing, and the fluorescence intensity was measured using a fluorescent microplate reader with excitation wavelength at 480 nm and emis-sion wavelength at 530 nm. Untreated samples were used to determine background fluorescence.
Cardiac inflammatory factors analyses
Cardiac tissue was homogenized in 10 mM Tris-HCl buff-ered solution (pH 7.4) containing
2 M NaCl, 1 mM ethylenediaminetetraacetic acid, 0.01% Tween 80, 1 mM phenylmethylsulfonyl fluoride, and cen-trifuged at 9000 × g for 30 min at 4°C. The resultant supernatant was used for cytokine determination. The lev-els of IL-1beta, IL-6, TNF-alpha, IL-4, IL-10 and MCP-1 were measured by ELISA using cytoscreen immunoassay kits (BioSource International, Camarillo, CA, USA). Sam-ples were assayed in duplicates according to manufac-turer's instructions. The sensitivity of the assay, i.e., the lower limit of detection, was 5 nmol/l for IL-1beta, IL-4, IL-6, IL-10 and 10 nmol/l for TNF-alpha and MCP-1.
Real-time polymerase chain reaction (RT-PCR) for mRNA expression
Page 4 of 8
cycles at 94°C for 20 s and 60°C for 1 min. Generated flu-orescence from each cycle was quantitatively analyzed by using the Taqman system based on real-time sequence detection system (ABI Prism 7700; Perkin-Elmer Inc., Fos-ter City, CA, USA). In this present study, the mRNA level of the control group (without diabetes and with normal diet) was defined as 100%; then, mRNA level of other groups were calculated as percentage of the control group.
Statistical analysis
All data were expressed as mean ± standard deviation (SD). A statistical software package, SAS program (Version 5.1), was used to perform statistical analysis. One-way analysis of variance (ANOVA), followed by Dunnett's t-test was used to assess the significance of any change
between groups. Statistical significance is defined as p < 0.05.
Results
The content of CA or EA in cardiac tissue is shown in Table 1. Dietary supplement of these compounds significantly increased their content in cardiac tissue of diabetic mice. Water intake, food intake, body weight and serum levels of ALT and AST at wks 1 and 12 are presented in Table 2. Compared with diabetic mice with normal diet, mice with CA and EA supplement had significantly lower water intake, lower food intake and higher body weight at wk 12 (p < 0.05). CA or EA treatment did not affect serum activ-ity of ALT and AST in diabetic mice (p > 0.05). Plasma lev-els of glucose and insulin are presented in Figure 1. Compared with diabetic mice with normal diet, CA and EA treatments significantly decreased glucose level and increased insulin level at wk 12 (p < 0.05).
Plasma level of glucose (mmol/l) or insulin (nmol/l) of non-diabetic mice (Non-DM), non-diabetic mice consumed normal diet (DM), 2% caffeic acid (CA) or ellagic acid (EA) at 1 and 12 week
Figure 1
Plasma level of glucose (mmol/l) or insulin (nmol/l) of non-diabetic mice (Non-DM), diabetic mice con-sumed normal diet (DM), 2% caffeic acid (CA) or
ellagic acid (EA) at 1 and 12 week. Data are mean ± SD,
n = 15. a-dMeans among bars without a common letter differ,
p < 0.05.
plasma glucose
a a
d
b
b
b
c
b
0 5 10 15 20 25 30
1 12 wk
mmo
l/
l
Non-DM DM DM+CA DM+EA
plasma insulin
c b
a a
b a
b a
0 2 4 6 8 10 12 14 16 18
1 12 wk
nm
ol
/l Non-DM
DM DM+CA DM+EA
Table 1: Content of caffeic acid (CA) and ellagic acid (EA) in cardiac tissue from diabetic mice consumed normal diet (DM), 2% CA or EA at 12 week.
Cardiac tissue (mg/100 g wet tissue)
DM DM+CA DM+EA
Caffeic acid -a 24.7 ± 2.3
-Ellagic acid - - 29.5 ± 3.5
ameans too low to be detected. Data are mean ± SD, n = 15.
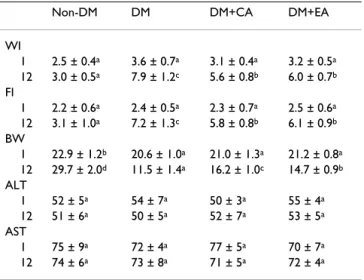
Table 2: Water intake (WI, ml/mouse/d), food intake (FI, g/ mouse/d), body weight (BW, g/mouse), serum alanine aminotransferase activity (ALT, U/l), aspartate
aminotransferase activity (AST, U/l) of non-diabetic mice (Non-DM), diabetic mice consumed normal diet ((Non-DM), 2% caffeic acid (CA) or ellagic acid (EA) at 1 and 12 week.
Non-DM DM DM+CA DM+EA
WI
1 2.5 ± 0.4a 3.6 ± 0.7a 3.1 ± 0.4a 3.2 ± 0.5a 12 3.0 ± 0.5a 7.9 ± 1.2c 5.6 ± 0.8b 6.0 ± 0.7b FI
1 2.2 ± 0.6a 2.4 ± 0.5a 2.3 ± 0.7a 2.5 ± 0.6a 12 3.1 ± 1.0a 7.2 ± 1.3c 5.8 ± 0.8b 6.1 ± 0.9b BW
1 22.9 ± 1.2b 20.6 ± 1.0a 21.0 ± 1.3a 21.2 ± 0.8a 12 29.7 ± 2.0d 11.5 ± 1.4a 16.2 ± 1.0c 14.7 ± 0.9b ALT
1 52 ± 5a 54 ± 7a 50 ± 3a 55 ± 4a 12 51 ± 6a 50 ± 5a 52 ± 7a 53 ± 5a AST
1 75 ± 9a 72 ± 4a 77 ± 5a 70 ± 7a 12 74 ± 6a 73 ± 8a 71 ± 5a 72 ± 4a
Data are mean ± SD, n = 15.
TG and TC content in cardiac tissue and plasma at wk 12 are shown in Table 3. CA and EA treatments significantly lowered cardiac and plasma TG content (p < 0.05), in which the effect of EA was greater than that of CA (p < 0.05). Both CA and EA failed to affect TC content in car-diac tissue and plasma (p > 0.05). Plasma levels of coagu-lation and anti-coagucoagu-lation factors at wk 12 are shown in Table 4. CA and EA treatments significantly elevated AT-III and protein C activities (p < 0.05); but failed to affect PAI-1 activity and fibrinogen level in diabetic mice (p > 0.05).
As shown in Table 5, CA or EA treatment significantly decreased cardiac levels of MDA, ROS and GSSG in dia-betic mice (p < 0.05); these supplements also significantly increased cardiac GSH level and retained activity of GPX, SOD and catalase (p < 0.05). Cardiac levels of cytokines are presented in Table 6. CA or EA supplement signifi-cantly reduced IL-1beta, IL-6, TNF-alpha and MCP-1 lev-els (p < 0.05); but these compounds failed to affect cardiac IL-4 and IL-10 levels (p > 0.05). The effects of CA or EA on mRNA expression of cardiac catalase, SOD, GPX1, IL-1beta, IL-6, TNF-alpha and MCP-1 are shown in Figure 2. CA or EA treatment significantly up-regulated mRNA expression of catalase, SOD and GPX1; and down-regu-lated IL-1beta, IL-6, TNF-alpha and MCP-1 mRNA expres-sion in cardiac tissue of diabetic mice (p < 0.05).
Discussion
Our present study revealed that the dietary supplement of caffeic acid and ellagic acid increased cardiac content of
these compounds in their intact forms; and these treat-ments effectively elevated insulin secretion, improved gly-cemic control, decreased plasma and cardiac triglyceride levels, diminished cardiac oxidative and inflammatory stresses, and attenuated coagulation risk in diabetic mice. These findings support that these agents could protect car-diac tissue against the progression of diabetic cardiomy-opathy via these triglyceride-lowering, anti-oxidative, anti-coagulatory and anti-inflammatory effects.
We found that these compounds substantially elevated insulin secretion, which might subsequently attenuate dyslipidemia in CA or EA treated diabetic mice via improving lipid metabolism. Thus, the observed lower triglyceride accumulation in cardiac tissue and plasma could be explained. Diabetes is a thrombosis-prone con-dition because hyperglycemia-induced ROS causes plate-let dysfunction, and insulin deficiency reduces the release of thrombolytic enzymes such as tissue plasminogen acti-vators [20]. Activated AT-III and protein C are important anticoagulants because AT-III inhibits the activity of a number of proteases in the coagulation cascade, and pro-tein C inactivates coagulation factors such as factors Va and VIIIa [21]. The results of our present study indicated that caffeic acid or ellagic acid treatment markedly ele-vated AT-III and protein C activities, which might conse-quently enhance anticoagulatory activity and alleviate diabetes associated hypercoagulability. These findings support that these compounds could improve hemostatic disorder and reduce the risk of diabetes associated
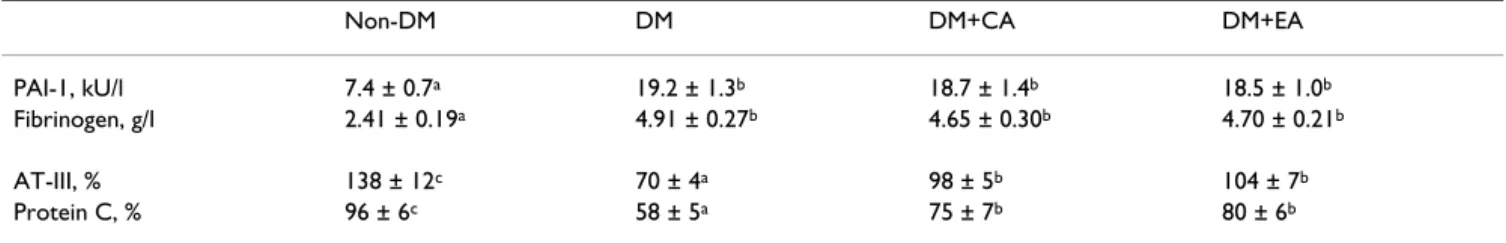
athero-Table 4: Coagulatory factors, PAI-1 activity and fibrinogen level; anti-coagulatory factors, AT-III and protein C in plasma from non-diabetic mice (Non-DM), non-diabetic mice consumed normal diet (DM), 2% caffeic acid (CA) or ellagic acid (EA) at 12 week.
Non-DM DM DM+CA DM+EA
PAI-1, kU/l 7.4 ± 0.7a 19.2 ± 1.3b 18.7 ± 1.4b 18.5 ± 1.0b
Fibrinogen, g/l 2.41 ± 0.19a 4.91 ± 0.27b 4.65 ± 0.30b 4.70 ± 0.21b
AT-III, % 138 ± 12c 70 ± 4a 98 ± 5b 104 ± 7b
Protein C, % 96 ± 6c 58 ± 5a 75 ± 7b 80 ± 6b
a-cMeans in a row without a common letter differ, p < 0.05. Data are mean ± SD, n = 15.
Table 3: Level of triglyceride (TG) and total cholesterol (TC) in cardiac tissue and plasma from non-diabetic mice (Non-DM), diabetic mice consumed normal diet (DM), 2% caffeic acid (CA) or ellagic acid (EA) at 12 week.
Non-DM DM DM+CA DM+EA
Cardiac tissue
TG, mg/g wet tissue 25.4 ± 1.8a 41.7 ± 2.3d 36.8 ± 1.7c 32.4 ± 2.0b
TC, mg/g wet tissue 2.9 ± 0.8a 4.2 ± 0.8b 4.0 ± 0.9b 3.9 ± 0.7b
Plasma
TG, g/l 2.24 ± 0.18a 4.16 ± 0.34d 3.51 ± 0.15c 3.04 ± 0.21b
TC, g/l 1.34 ± 0.23a 3.67 ± 0.31b 3.56 ± 0.26b 3.61 ± 0.23b
Page 6 of 8
genesis and thrombosis via decreasing triglyceride level in circulation and cardiac tissue as well as enhancing activity of fibrinolytic factors such as AT-III and protein C. On the other hand, fibrinogen is a precursor in fibrin formation and a cofactor in platelet aggregation; PAI-1 is the primary physiologic inhibitor of fibrinolysis [22]. Our present study found that test compounds failed to affect
fibrino-gen level and PAI-1 activity in diabetic mice. Obviously, these compounds could not attenuate hypercoagulability via suppressing coagulatory factors such as fibrinogen and PAI-1.
Diabetes is also an inflammation-prone condition because hyperglycemia-induced ROS stimulates signal transduction to elaborate inflammatory cytokines, e.g. TNF-alpha, IL-1beta and IL-6 [23], which facilitates inflammation, endothelial dysfunction, coagulation and exacerbated the severity of diabetes [24,25]. Our present study observed that caffeic acid or ellagic acid supplement effectively suppressed cardiac mRNA expression of these inflammatory cytokines, which contributed to diminish cardiac inflammatory reactions in diabetic mice. These results supported that these compounds were potent agents against diabetes-associated cardiac inflammation. We also notified that these compounds did not affect car-diac levels of IL-4 and IL-10, anti-inflammatory and immunosuppressive cytokines. Thus, the diminished dia-betic cardiac inflammation from these agents was not due to their stimulation on the production of anti-inflamma-tory cytokines. It has been reported that elevated serum MCP-1 level could serve as an inflammatory marker in patients at risk for atherosclerotic vascular diseases because MCP-1 is a chemotactic factor for activating monocytes and macrophages, and could recruit mono-cytes to the sites of injury [26,27]. In our present study, the increased cardiac MCP-1 level indicated that these dia-betic mice were at risk for cardio-vascular complications. Meanwhile, we also found that the supplement of caffeic acid and ellagic acid markedly lowered cardiac MCP-1 protein production in diabetic mice. These results indi-cated that these compounds could protect cardiac tissue against inflammation via decreasing the activation of monocytes and macrophages, and lowering the recruit-ment of monocytes.
It has been documented that caffeic acid and ellagic acid possess non-enzymatic antioxidant activity such as scav-enging free radicals, and enzymatic antioxidant activity
Table 5: Level of MDA, ROS, GSSG, GSH and activity of catalase, GPX, SOD in cardiac tissue from non-diabetic mice (Non-DM), diabetic mice consumed normal diet (DM), 2% caffeic acid (CA) or ellagic acid (EA) at 12 week.
Non-DM DM DM+CA DM+EA
MDA, μmol/mg protein 0.63 ± 0.09a 3.17 ± 0.26d 1.45 ± 0.13b 1.97 ± 0.15c ROS, nmol/mg protein 0.31 ± 0.09a 1.08 ± 0.13c 0.83 ± 0.07b 0.72 ± 0.10b GSSG, nmol/mg protein 0.27 ± 0.07a 1.32 ± 0.12d 0.56 ± 0.07b 0.83 ± 0.05c
GSH, nmol/mg protein 18.9 ± 1.8d 10.6 ± 1.0a 14.6 ± 1.2c 12.0 ± 1.5b
GPX, U/mg protein 35.4 ± 2.6c 17.6 ± 1.2a 21.2 ± 2.0b 22.6 ± 2.3b
Catalase, U/mg protein 27.3 ± 2.0d 14.0 ± 0.9a 21.6 ± 1.8c 18.7 ± 1.5b
SOD, U/mg protein 30.7 ± 2.3d 16.9 ± 1.0a 23.1 ± 1.6c 19.1 ± 1.2b
a-dMeans in a row without a common letter differ, p < 0.05. Data are mean ± SD, n = 15.
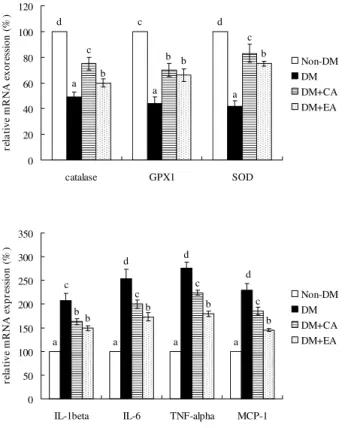
Cardiac mRNA expression of catalase, GPX1, SOD, IL-1beta, IL-6, TNF-alpha and MCP-1 in mice without diabetes (Non-DM), diabetic mice consumed normal diet ((Non-DM), 2% caffeic acid (CA) or ellagic acid (EA) at 12 week
Figure 2
Cardiac mRNA expression of catalase, GPX1, SOD, IL-1beta, IL-6, TNF-alpha and MCP-1 in mice without diabetes (Non-DM), diabetic mice consumed normal diet (DM), 2% caffeic acid (CA) or ellagic acid (EA) at 12 week. Data are mean ± SD, n = 15. a-dMeans among bars without a common letter differ, p < 0.05.
d c d
a a a c b c b b b 0 20 40 60 80 100 120
catalase GPX1 SOD
re la ti ve m R N A e xor es si on ( % ) Non-DM DM DM+CA DM+EA a a a a d d c d c c c b b b b b 0 50 100 150 200 250 300 350
IL-1beta IL-6 TNF-alpha MCP-1
such as increasing protein level of antioxidant enzymes [10,28]. Our present study also observed that these com-pounds could alleviate cardiac oxidative stress via reduc-ing the formation of MDA and ROS; and enhance antioxidant defense via increasing GSH retention and restoring the activity of three antioxidant enzymes as well as up-regulating cardiac mRNA expression of these anti-oxidant enzymes. Therefore, it is highly possible that the intake of these agents resulted in their accumulation in cardiac tissue, which subsequently decreased cardiac oxi-dative damage via their anti-oxioxi-dative activities. Then, both inflammatory and coagulatory stresses in cardiac tis-sue were alleviated because the available oxidants such as ROS as inflammation and/or coagulation stimulators were lowered.
Tasaki et al. [29] reported that dietary supplement of ellagic acid up to 5% was safe in rats. Ellagic acid or caffeic acid at 2% was sued in our present study, and we found these compounds at this dose exhibited marked cardiac protective effects and did not cause liver injury. Thus, these agents at this dose might be safe for diabetic appli-cation. Further study is necessary to verify the efficiency and safety of these compounds before they are used for human. It is interesting to find that caffeic acid was more effective in increasing GSH content and enhancing cata-lase and SOD activities; but ellagic acid was more effective in lowering IL-6, TNF-alpha and MCP-1 levels in cardiac tissue. Apparently, the cardiac protective action modes of these two compounds were not identical.
Conclusion
Dietary supplement of caffeic acid and ellagic acid improved glycemic control and lipid metabolism in dia-betic mice. These compounds provided triglyceride-lower-ing, coagulatory, oxidative and anti-inflammatory protection for cardiac tissue of diabetic mice. The impact of these agents on cardiac mRNA expres-sion of antioxidant enzymes and cytokines revealed that
their protective effects occurred at transcription level. Therefore, the supplement of these compounds might be helpful for the prevention or alleviation of diabetic cardi-omyopathy.
List of abbreviations used
AT-III: antithrombin-III; GPX: glutathione peroxidase; GSH: glutathione; GSSG: oxidized glutathione; IL-1beta: interleukin-1beta; MCP-1: monocyte chemoattractant protein-1; MDA: malondialdehyde; PAI-1: plasminogen activator inhibitor-1; ROS: reactive oxygen species; RT-PCR: real-time polymerase chain reaction; SOD: superox-ide dismutase; TC: total cholesterol; TG: triglycersuperox-ide; TNF-alpha: tumor necrosis factor-alpha.
Competing interests
The authors declare that they have no competing interests.
Authors' contributions
All authors were involved in the design of this study; and performed laboratory analyses and statistics. The manu-script was written by Yin MC.
References
1. Tziakas DN, Chalikias GK, Kaski JC: Epidemiology of the diabetic heart. Coron Artery Dis 2005:S3-S10.
2. Reasner CA: Reducing cardiovascular complications of type 2 diabetes by targeting multiple risk factors. J Cardiovasc Pharma-col 2008, 52:136-144.
3. Sowers JR, Epstein M, Frohlich ED: Diabetes, hypertension and cardiovascular disease: an update. Hypertension 2001,
37:1053-1059.
4. Ye G, Metreveli NS, Donthi RV, Xia S, Xu M, Carlson EC, Epstein PN:
Catalase protect cardiomyocyte function in models of type 1 and 2 diabetes. Diabetes 2004, 53:1336-1343.
5. Zhou G, Li X, Hein DW, Xiang X, Marshall JP, Prabhu SD, Cai L: Met-allothionein suppresses angiotensin II-induced nicotinamide adenine dinucleotide phosphate oxidase activation, nitrosa-tive stress, apoptosis, and pathological remodeling in the diabetic heart. J Am Coll Cardio 2008, 52:655-666.
6. Geerlings SE, Brouwer EC, van Kessel KC, Gaastra W, Stolk RP, Hoepelman AL: Cytokine secretion is impaired in women with diabetes mellitus. Euro J Clin Invest 2000, 30:995-1001.
7. Drimal J, Knezl V, Navarova J, Nedelcevova J, Paulovicova E, Sotnik-ova VR, Snirc V, Drimal D: Role of inflammatory cytokines and chemoattractants in rat model of streptozotocin-induced diabetic heart failure. Endo Regul 2008, 42:129-135.
8. Sellappan S, Akoh CC, Krewer G: Phenolic compounds and anti-oxidant capacity of Georgia-grown blueberries and blackber-ries. J Agric Food Chem 2002, 50:2432-2438.
9. Mattila P, Kumpulainen J: Determination of free and total phe-nolic acids in plant-derived foods by HPLC with diode-array detection. J Agric Food Chem 2002, 50:3660-3667.
10. Makena PS, Chung KT: Effects of various plant polyphenols on bladder carcinogen benzidine-induced mutagenicity. Food
Chem Toxicol 2007, 45:1899-1909.
11. Prakash D, Suri S, Upadhyay G, Singh BN: Total phenol, antioxi-dant and free radical scavenging activities of some medicinal plants. Int J Food Sci Nutr 2007, 58:18-28.
12. Yamada Y, Yasui H, Sakurai H: Suppressive effect of caffeic acid and its derivatives on the generation of UVA-induced reac-tive oxygen species in the skin of hairless mice and pharma-cokinetic analysis on organ distribution of caffeic acid in ddY mice. Photochem Photobiol 2006, 82:1668-1676.
13. Cheng JT, Liu IM, Tzeng TF, Chen WC, Hayakawa S, Yamamoto T:
Release of beta-endorphin by caffeic acid to lower plasma Table 6: Cardiac level (pg/mg protein) of inflammatory cytokine
(IL-1beta, IL-6, TNF-alpha and MCP-1), and anti-inflammatory cytokine (IL-4 and IL-10) in non-diabetic (Non-DM), diabetic mice consumed normal diet (DM), 2% caffeic acid (CA) or ellagic acid (EA) at 12 week.
Non-DM DM DM+CA DM+EA
IL-1beta 15 ± 2a 331 ± 26c 234 ± 25b 227 ± 23b IL-6 18 ± 3a 411 ± 30d 323 ± 28c 226 ± 26b TNF-alpha 19 ± 4a 386 ± 21d 305 ± 25c 245 ± 19b MCP-1 16 ± 3a 278 ± 22d 225 ± 16c 192 ± 14b
IL-4 14 ± 4a 230 ± 24b 227 ± 21b 219 ± 26b IL-10 17 ± 3a 209 ± 30b 198 ± 19b 204 ± 29b
Publish with BioMed Central and every scientist can read your work free of charge
"BioMed Central will be the most significant development for disseminating the results of biomedical researc h in our lifetime."
Sir Paul Nurse, Cancer Research UK
Your research papers will be:
available free of charge to the entire biomedical community
peer reviewed and published immediately upon acceptance
cited in PubMed and archived on PubMed Central
yours — you keep the copyright
Submit your manuscript here:
http://www.biomedcentral.com/info/publishing_adv.asp
BioMedcentral
Page 8 of 8
glucose in streptozotocin-induced diabetic rats. Horm Metab Res 2003, 35:251-258.
14. Jung UJ, Lee MK, Park YB, Jeon SM, Choi MS: Antihyperglycemic and antioxidant properties of caffeic acid in db/db mice. J
Pharmacol Exp Ther 2006, 318:476-483.
15. Lowry OH, Rosebrough NJ, Farr AL: Protein determination with the Folin phenol reagent. J Biol Chem 1951, 193:265-275. 16. Biggs HG, Erikson JM, Moorehead WR: A manual colorimetric
assay of triglycerides in serum. Clin Chem 1975, 21:437-441. 17. Rudel LL, Morris MD: Determination of cholesterol using
o-phthalaldehyde. J Lipid Res 1973, 14:164-166.
18. Jain SK, Palmer M: The effect of oxygen radical metabolites and vitamin E on glycosylation or proteins. Free Rad Biol Med 1997,
22:593-596.
19. Privratsky JR, Wold LE, Sowers JR, Quinn MT, Ren J: AT1 blockade prevents glucose-induced cardiac dysfunction in ventricular myocytes: role of the AT1 receptor and NADPH oxidase.
Hypertension 2003, 42:206-212.
20. Yamada T, Sato A, Nishimori T, Mitsuhashi T, Terao A, Sagai H, Komatsu M, Aizawa T, Hashizume K: Importance of hypercoagu-lability over hyperglycemia for vascular complication in type 2 diabetes. Diabetes Res Clin Prac 2000, 49:23-31.
21. Shen L, He X, Dahlback B: Synergistic cofactor function of factor V and protein S to activate protein C in the inactivation of the factor VIIIafactor IXa complex – species specific interac-tions of components of the protein C anticoagulant system.
Thromb Haemost 1997, 78:1030-1036.
22. Urano T, Ihara H, Suzuki Y, Takada Y, Takada A: Coagulation-asso-ciated enhancement of fibrinolytic activity via a neutraliza-tion of PAI-1 activity. Semin Thromb Hemost 2000, 26:39-42. 23. Hori M, Nishida K: Oxidative stress and left ventricular
remod-eling after myocardial infarction. Cardiovasc Res 2009,
81:457-464.
24. Mohamed-Ali V, Armstrong L, Vlark D, Bolton CH, Pinkney JH: Evi-dence for the regulation of levels of plasma adhesion mole-cules by inflammatory cytokines and their soluble receptors in type 1 diabetes. J Inter Med 2001, 250:415-421.
25. Aso Y, Okumura K, Yoshida N, Tayama K, Kanda T, Kobayashi I, Takemura Y, Inukai T: Plasma interleukin-6 is associated with coagulation in poorly controlled patients with Type 2
diabe-tes. Diabetic Med 2003, 20:930-934.
26. Takahashi K, Mizuarai S, Araki H, Mashiko S, Ishihara A, Kanatani A, Itadani H, Kotani H: Adiposity elevates plasma MCP-1 levels leading to the increased CD11b-positive monocytes in mice.
J Biol Chem 2003, 278:46654-46660.
27. Martinovic I, Abegunewardene N, Seul M, Vosseler M, Horstick G, Buerke M, Darius H, Lindemann S: Elevated monocyte chemoat-tractant protein-1 serum levels in patients at risk for coro-nary artery disease. Circulation J 2005, 69:1484-1489.
28. Han DH, Lee MJ, Kim JH: Antioxidant and apoptosis-inducing activities of ellagic acid. Anticancer Res 2006, 26:3601-3606. 29. Tasaki M, Umemura T, Maeda M, Ishii Y, Okamura T, Inoue T,