Time Trends of Gastro-esophageal Reflux Disease
(GERD) and Peptic Ulcer Disease (PUD) in Iran
ABSTRACT
BACkgRoundEpidemiology of diseases changes over time with changes in socio-economic status, culture and health care systems. Gas-troesophageal reflux disease (GERD) and peptic ulcer disease (PUD) are among the diseases whose epidemiology has changed over the past few decades in the west. Studies addressing the trend of GERD and PUD occurrence in Iran are lacking. We aimed to look at the time trends of GERD and PUD in a referral endoscopy clinic in Tehran, Iran.
MeThodS
All patients with dyspeptic symptoms who underwent upper GI endoscopy from 1993 to 2005 (inclusive) in a tertiary outpatient GI referral center in Tehran were enrolled. Erosive esophagitis (EE, used as a proxy for GERD as a whole), PUD, rapid urease test (RUT) status and demographic characteristics were recorded from the endoscopy reports according to the year the endoscopy was performed.
ReSulTS
Over a period of 13 years, 8,029 endoscopic examinations were performed. The most common endoscopic diagnosis was EE that occurred in 4,808 patients (59.8%) followed by duodenal ulcer in 2,188 (27.3%) and gastric ulcer in 88 (1.1%). Over 13 years (1995-2005), the proportion of EE increased from 14.1% in 1993 to 75.1% in 2005 among dyspeptic patients in this refer-ral clinic. The proportion of each grade of GERD according to the Los Angeles classification was as follows: GERD-A 76.0%, GERD-B 20.9%, GERD-C 2.8% and GERD-D 0.3%. RUT posi-tivity decreased from 71.4% to 9.5% during the study period. ConCluSion
This study shows a remarkable increase in EE with a concomitant de-crease in PUD and RUT positivity among dyspeptic patients in Tehran over a decade. This change in trend is important for future health care planning.
keywoRdS
Gastroesophageal reflux; Peptic ulcer disease; Endoscopy; Time Trend; Iran
Digestive Diseases Research Center, Tehran University of Medical Sciences, Tehran, Iran,
Sasan Alborz Biomedical Research Institute, Unit of Clinical Research, Tehran, Iran
1.
2.
SG Sepanlou
1, H Khademi
1, N Abdollahzadeh
1, F Noori
1, F Malekzadeh
1, R Malekzadeh
1,2**Corresponding Author:
Reza Malekzadeh, MD
Professor of Digestive Disease Research Center, Shariati Hospital, North Kargar St., Tehran 14144, Iran.
Tel: +98 21 84902434 Fax: + 98 21 82415000 E-mail: malek@ams.ac.ir Recieved: 10 May 2010 Accepted: 29 August 2010
inTRoduCTion
Gastro-esophageal reflux disease (GERD) is one of the most prevalent diseases worldwide. 1-4 Clinical manifestations of GERD are diverse
and include heartburn, acid regurgitation, dys-phagia, non-cardiac chest pain and a variety of the so-called minor symptoms such as water brash, nausea, epigastric pain centered below the xiphoid process (subxiphoid pain) and other less well-established ones.5 Incompetence and/
or transient relaxation of the lower esophageal sphincter (LES) are important pathophysiologi-cal factors of GERD.6,7 Unhealthy lifestyle,
including high-energy diets and fast foods, in-activity and obesity are among plausible risk factors for GERD.4, 8 Recent animal studies as
well as ecological studies on humans have im-plied that dietary nitrates may be important in the pathogenesis of GERD. 9-11
The cost of GERD, including direct medical costs as well as absenteeism from work is sub-stantial.12 The annual direct and indirect costs
of GERD in the United States are estimated to be more than 10 billion US dollars as compared to that of peptic ulcer disease (PUD), which is estimated to be about 5 billion US dollars.12
Long-term consequences of GERD are also no-table. Adenocarcinoma of the distal esophagus arising in Barrett’s epithelium is a related com-plication, the prevalence of which is rising.13-15
Despite these epidemiological links, the ma-jority of patients with GERD will never suffer from a malignant transformation; therefore, this should be addressed when taking care of GERD patients to avoid unnecessary anxiety.
Diagnosis of GERD mostly relies on clinical symptoms. However, endoscopy is commonly performed to look for erosive esophagitis (EE), other concomitant upper GI disorders (e.g., PUD), and columnar metaplasia in the distal esophagus. Western studies have shown a de-cline in the prevalence and incidence of PUD in the past three decades16, 17, whereas GERD has
increased. This may be partly due to decreasing
prevalence of Helicobacter pylori in developed countries.18-21 Surveys in Asian countries have
also shown a similar trend, albeit at a lower pace22-27, but large scale studies in our region are
scarce. Hence, long-term studies to monitor lon-gitudinal changes in the pattern of GERD and PUD among different generations are needed.
In the current study we have analyzed time trends of gastric and duodenal ulcers (GU and DU) and have compared them with concomi-tant time trends of EE as a proxy for GERD as a whole in a large dyspeptic population who re-ferred to a tertiary outpatient GI referral center in Tehran.
MATeRiAlS And MeThodS
All patients who underwent upper gastrointes-tinal endoscopy in a referral GI center in Teh-ran, Iran from 1993 to the end of the year 2005 were enrolled in the present study. Patients came from both rural and urban areas.
All endoscopy reports were reviewed and their final diagnoses were recorded using the Los Angeles classification.28 The endoscopies
were performed by a single gastroenterologist. Thus, there was no inter-observer variability in the diagnosis of EE.29, 30
Additional data recorded included age, sex, final diagnosis and rapid urease test results.
The prevalence of endoscopic findings was expressed as percentages. Between group dif-ferences were assessed using chi-square or student t-test. Binary logistic regression was used to determine the independent predictors of EE detected in endoscopy. Odds ratios (OR) and 95% confidence intervals (95% CI) were calculated, and p-values <0.05 were consid-ered as significant. All variables with a p-value <0.05 in univariate analysis were included in the multivariate model. All data was analyzed using the Statistical Package for the Social Sciences for Windows (SPSS, Chicago, IL) version 16.00.
ReSulTS
A total of 8,029 patients fulfilled the inclusion criteria. Among them, 3, 942 (49.1%) were fe-male. Mean age at presentation was 41.1 ± 14.9 years (range of 15 to 97 years). A total of 4,934 patients (61.5%) were found to have EE, 2,188 (27.3%) had DU and 88 (1.1%) had GU. Table 1 demonstrates demographic characteristics of the study population and the endoscopic find-ings according to the year of endoscopy. Figure 1 shows the time trends of EE, GU, DU, normal findings and positive urease test from 1993 to 2005.
EE shows a significant rise during 13 years of follow-up (p<0.001), while both types of PUD (GU and DU) show a significant decline (p<0.001). It seems that the decline in DU prev-alence is greater than GU, but this could not be shown statistically, because of the low preva-lence of GU. The proportion of positive ure-ase test results also shows a significant decline (p<0.001).
We also found that positive rapid urease test results were more prevalent among patients suffering from PUD (82.4% versus 58.5%,
p<0.001). On the other hand, patients having EE
were slightly less likely to have a positive rapid urease test (62.7% versus 69.5%, p<0.001).
There was no significant difference in mean age between the three categories of EE, GU, and DU. Figure 2 shows the distribution of EE severity according to the LA classification over different years. The trend has been depicted from 2000 to 2005, e.g., the era when the LA classification was introduced and gained popu-larity. As shown in Figure 2, there is no differ-ence in the percentage of the three EE catego-ries from 2000 to 2005.
Table 1:The demographic characteristics of the study population, prevalence of ee, gu, du and positive urease test, the proportion of males among ee and Pud patients, according to the year of endoscopy.
year n Age (Mean ± Sd) Male ee gu du normal Positive ee Pud in years n (%) n (%) n (%) n (%) n (%) urease test Males (%) Males (%)
1993 106 39.6 ± 14.5 56 (52.8%) 15 (14.1%) 2 (1.8%) 44 (41.5%) 90 (84.9%) 71.4% 69.2% 65.9% 1994 453 39.8 ± 14.9 237 (52.3%) 116 (25.6%) 9 (2.0%) 151 (33.3%) 252 (55.6%) 79.9% 60.3% 62.3% 1995 629 39.7 ± 13.5 340 (54.1%) 241 (38.3%) 10 (1.6%) 223 (35.5%) 337 (53.6%) 75.4% 57.7% 66.8% 1996 832 39.9 ± 14.4 459 (55.2%) 338 (40.6%) 16 (1.9%) 318 (38.2%) 327 (39.3%) 74.9% 58.9% 65.7% 1997 971 40.2 ± 14.4 471 (48.5%) 345 (35.5%) 12 (1.2%) 303 (31.2%) 377 (38.8%) 70.0% 54.5% 60.7% 1998 905 41.5 ± 15.9 446 (49.3%) 582 (64.3%) 9 (1.0%) 303 (33.5%) 236 (26.1%) 63.9% 49.7% 57.8% 1999 800 40.1 ± 15.1 426 (53.2%) 641 (80.1%) 2 (0.3%) 242 (30.3%) 124 (15.5%) 64.3% 54.5% 64.5% 2000 660 41.0 ± 14.9 341 (51.7%) 494 (74.8%) 1 (0.2%) 185 (28.0%) 129 (19.5%) 62.7% 53.6% 68.0% 2001 521 41.9 ± 14.8 262 (50.3%) 397 (76.2%) 2 (0.4%) 134 (25.7%) 126 (24.2%) 65.1% 51.3% 69.8% 2002 380 42.8 ± 14.6 186 (48.9%) 296 (77.9%) 1 (0.3%) 70 (18.4%) 99 (26.1%) 68.4% 51.0% 67.2% 2003 634 41.9 ± 14.8 296 (46.7%) 507 (80.0%) 10 (1.6%) 70 (11.1%) 109 (17.2%) 62.0% 47.4% 71.4% 2004 668 42.4 ± 15.5 341 (51.0%) 498 (74.6%) 10 (1.5%) 87 (13.0%) 146 (21.9%) 44.0% 55.8% 69.1% 2005 470 44.2 ± 14.4 226 (48.1%) 353 (75.1%) 4 (0.9%) 58 (12.3%) 98 (20.8%) 49.5% 49.3% 70.1%
Total 8029 41.1 ± 14.9 4078 (50.9%) 4808 (59.8%) 88 (1.1%) 2188 (27.3%) 2450 (30.5%) 65.3% 53.1% 63.0%
Per
centage
Percentage of geRd, du, gu, Positive urease test, and normal subjects in each year of endoscopy
GERD
GU
DU
Normal
Positive Urease Test
Fig 1:Prevalence rates of endoscopic findings and positive urease test results by year of endoscopy.
1993 1994 1995 1996 1997 1998 1999 2000 2001 2002 2003 2004 2005
year of endoscopy 90.0%
80.0% 70.0% 60.0% 50.0% 40.0% 30.0% 20.0% 10.0% 0.0%
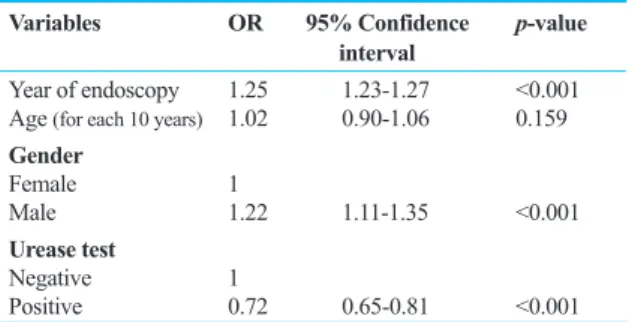
Table 2 shows the relation between EE preva-lence and year of endoscopy, age, gender and results of the rapid urease test.
As noticed in the table, the OR is significant for year of endoscopy, male gender and posi-tive urease test. However, in the final multivari-ate logistic regression demonstrmultivari-ated in Table 3, only the year of endoscopy and gender remain in the model. A similar analysis was done for PUD and as shown in Tables 4 and 5, the OR for the year of the endoscopy, age, male gender and positive urease test was significant in both univariate and multivariate regression.
diSCuSSion
This study shows two distinct and opposing patterns for common diseases that affect the gastro-duodenum and esophagus. PUD preva-lence has decreased continuously during re-cent years; on the other hand, EE has increased over the same period of time. Both types of PUD are strongly correlated with gastric infec-tion by H. pylori.31 H. pylori seems to play an
essential role in the pathogenesis of PUD and the general decline in its prevalence rate pro-vides the most likely explanation for the time trends of these three diseases. Although the prevalence of H. pylori is very high in Iran32,
its prevalence is declining. Resolution of H. pylori-induced atrophic change in the gastric corpus results in restoration of acid secretion. This in turn may be responsible for develop-ment or worsening EE.33, 34
Due to the limitation of this study regarding its retrospective nature that reflects the experi-ence of a single center, the results cannot be extrapolated to the general population. But we believe that the merits of this study lie in the
Table 2:univariate logistic regression of geRd on year of endoscopy, age, gender and results of the urease test. Variables oR 95% Confidence p-value
interval
Year of endoscopy 1.25 1.23-1.27 <0.001
Age (for each 10 years) 1.02 0.90-1.06 0.159
gender
Female 1
Male 1.22 1.11-1.35 <0.001
urease test
Negative 1
Positive 0.72 0.65-0.81 <0.001
Table 3:Multivariate logistic regression of geRd on inde-pendent variables using backward wald method. Variables oR 95% Confidence p-value
interval
Year of endoscopy 1.26 1.24-1.28 <0.001
gender
Female 1
Male 1.45 1.29-1.62 <0.001
Table 4: univariate logistic regression of Pud on year of copy, age, gender and results of the urease test. Variables tested oR 95% Confidence p-value
interval
Year of endoscopy 0.86 0.85-0.88 <0.001
Age (for each 10 years) 1.06 1.02-1.09 0.002
gender
Female 1
Male 1.99 1.79-2.22 <0.001
urease test
Negative 1
positive 3.33 2.90-3.82 <0.001
Table 5: Multivariate logistic regression of Pud on dent variables using backward wald method.
Variables in the oR 95% Confidence p-value equation interval
Year of endoscopy 0.86 0.85-0.88 <0.001
Age (for each 10 years) 1.07 1.03-1.12 0.001
gender
Female 1
Male 1.99 1.77-2.25 <0.001
urease test
Negative 1
Positive 2.81 2.44-3.24 <0.001
Per
centage of
ge
R
d
subtypes
GERD-A GERD-B GERD-C GERD-D
2000 2001 2002 2003 2004 2005
year of endoscopy
Fig 2:Percentages of geRd subtypes by year of endoscopy. 90.0%
80.0% 70.0% 60.0% 50.0% 40.0% 30.0% 20.0% 10.0% 0.0%
large number of patients involved and relatively high diagnostic accuracy.
We found that EE is becoming more prev-alent in the Iranian population, which sup-ports previous studies in Iran.35, 36 GERD-A
is the most common type encountered and this is also similarly reported by others. 37-39 GERD-B and GERD-C also show a rising
pattern, especially in male patients. There was a slight male preponderance in the study patients which is in accordance with previous studies.26, 38
Based on logistic regression, year of the endoscopy and male gender are independent predictors of EE, which is congruent with pre-vious studies.40 Year of the endoscopy is
in-versely associated with PUD, while age, male gender and positive urease test are all predic-tors of PUD. Also, we have observed that time trends of PUD and EE are in opposing direc-tions which may be due to the decline in H. pylori infection. We believe that careful popu-lation-based studies should be carried out to elucidate the true prevalence rates of different forms of GERD in the general population.
ConFliCT oF inTeReST
The author declare no conflict of interest related to this work.
ReFeRenCeS
Spechler SJ. Epidemiology and natural history of gastro-oesophageal reflux disease. Digestion 1992;51:24-9. Johansson KE and Tibbling L. Esophageal body motor disturbances in gastroesophageal reflux and the effects of fundoplication. Scand J Gastroenterol Suppl 1988; 155:82-8.
Fujiwara Y , Arakawa T. Epidemiology and clinical char-acteristics of GERD in the Japanese population. J
Gastro-enterol 2009;44:518-34.
Bonatti H, Achem SR, Hinder RA. Impact of changing epidemiology of gastroesophageal reflux disease on its diagnosis and treatment. J Gastrointest Surg 2008;12:373-81. Sonnenberg A, Townsend WF, Muller AD. Evaluation of dyspepsia and functional gastrointestinal disorders: a cost-benefit analysis of different approaches. Eur J
Gas-troenterol Hepatol 1995;7:655-9.
1. 2.
3. 4. 5.
Dent J, Dodds WJ, Friedman RH, Sekiguchi T, Hogan WJ, Arndorfer RC, et al. Mechanism of gastroesophageal reflux in recumbent asymptomatic human subjects. J Clin
Invest 1980;65:256-67.
Castell DO. The lower esophageal sphincter. Physiologic and clinical aspects. Ann Intern Med 1975;83:390-401. Festi D, Scaioli E, Baldi F, Vestito A, Pasqui F, Di Biase AR, et al. Body weight, lifestyle, dietary habits and gas-troesophageal reflux disease. World J Gastroenterol 2009; 15:1690-1701.
Endo H, Iijima K, Asanuma K, Ara N, Ito H, Asano N,et al. Exogenous luminal nitric oxide exposure accelerates columnar transformation of rat esophagus. Int J Cancer
2010;127:2009-19.
Ishiyama F, Iijima K, Asanuma K, Ara N, Yoshitake J, Abe Y,et al. Exogenous luminal nitric oxide exacerbates esophagus tissue damage in a reflux esophagitis model of rats. Scand J Gastroenterol 2009;44:527-37.
Suzuki H, Iijima K, Moriya A, McElroy K, Scobie G, Fyfe V, et al. Conditions for acid catalysed luminal nitrosation are maximal at the gastric cardia. Gut 2003;52:1095-101. Veldhuyzen van Zanten SJ , Sherman PM. Indications for treatment of Helicobacter pylori infection: a systematic overview. CMAJ 1994;150:189-98.
Malekzadeh R, Derakhshan MH, Malekzadeh Z.Gastric cancer in Iran: epidemiology and risk factors. Arch Iran Med 2009;12:576-3.
Crane SJ, Locke GR, 3rd, Harmsen WS, Diehl NN, Zins-meister AR, Melton LJ, 3rd, et al. Subsite-specific risk factors for esophageal and gastric adenocarcinoma. Am J
Gastroenterol 2007;102:1596-1602.
Haghdoost AA, Hosseini H, Chamani G, Zarei MR, Rad M, Hashemipoor M, et al. Rising incidence of adenocar-cinoma of the esophagus in Kerman, Iran. Arch Iran Med
2008;11:364-70.
Sonnenberg A. Temporal trends and geographical varia-tions of peptic ulcer disease. Aliment Pharmacol Ther
1995;9:3-12.
Boring CC, Squires TS, and Tong T. Cancer statistics 1992. CA Cancer J Clin 1992;42:19-38.
Schutze K, Hentschel E, Dragosics B, and Hirschl AM. Helicobacter pylori reinfection with identical organisms: transmission by the patients’ spouses. Gut 1995;36:831-3. Labenz J, Blum AL, Bayerdorffer E, Meining A, Stolte M, Borsch G.Curing Helicobacter pylori infection in patients with duodenal ulcer may provoke reflux esophagitis.
Gas-troenterology 1997;112:1442-7.
Holtmann G. Reflux disease: the disorder of the third mil-lennium. Eur J Gastroenterol Hepatol 2001;13:S5-11. Gisbert JP, Pajares JM, Losa C.Helicobacter pylori and gastroesophageal reflux disease: friends or foes?
Hepato-gastroenterology 1999;46:1023-9.
Yeom JS, Park HJ, Cho JS, Lee SI, Park IS. Reflux esoph-agitis and its relationship to hiatal hernia. J Korean Med Sci 1999;14:253-6.
6.
7. 8.
9.
10.
11. 12. 13. 14.
15.
16. 17. 18. 19.
20. 21. 22.
Rhee PL. Association between Helicobacter pylori and gastro-esophageal reflux disease. Korean J Gastroenterol
2003;42:179-82.
Rajendra S, Kutty K, Karim N.Ethnic differences in the prevalence of endoscopic esophagitis and Barrett’s esoph-agus: the long and short of it all. Dig Dis Sci 2004;49: 237-42.
Khoshbaten M. Gastro-esophageal reflux disease in north-western Tabriz, Iran. Indian J Gastroenterol 2003;22:138-9. Heading RC. Epidemiology of oesophageal reflux dis-ease. Scand J Gastroenterol Suppl 1989;24:33-7. Li YM, Du J, Zhang H, Yu CH. Epidemiological investi-gation in outpatients with symptomatic gastroesophageal reflux from the Department of Medicine in Zhejiang Prov-ince, east China. J Gastroenterol Hepatol 2008;23:283-9. Lundell LR, Dent J, Bennett JR, Blum AL, Armstrong D, Galmiche JP, et al. Endoscopic assessment of oesophagi-tis: clinical and functional correlates and further validation of the Los Angeles classification.Gut 1999;45:172-80. Nasseri-Moghaddam S, Razjouyan H, Nouraei M, Alimo-hammadi M, Mamarabadi M, Vahedi H, et al. Inter- and intra-observer variability of the Los Angeles classifica-tion: a reassessment. Arch Iran Med 2007;10:48-53. Dent J. Endoscopic grading of reflux oesophagitis: the past, present and future. Best Pract Res Clin
Gastroen-terol 2008;22:585-99.
Nomura A, Stemmermann GN, Chyou PH, Perez-Perez GI, Blaser MJ. Helicobacter pylori infection and the risk for duodenal and gastric ulceration. Ann Intern Med
1994;120:.977-81.
Malekzadeh R, Sotoudeh M, Derakhshan MH, Mikaeli J, Yazdanbod A, Merat S, et al. Prevalence of gastric precan-cerous lesions in Ardabil, a high incidence province for gastric adenocarcinoma in the northwest of Iran. J Clin
Pathol 2004;57:37-42.
23. 24.
25. 26. 27.
28.
29.
30. 31.
32.
Sipponen P, Seppala K, Aarynen M, Helske T, Kettunen P.Chronic gastritis and gastroduodenal ulcer: a case con-trol study on risk of coexisting duodenal or gastric ulcer in patients with gastritis. Gut 1989;30:922-9.
Sipponen P , Hyvarinen H. Role of Helicobacter pylori in the pathogenesis of gastritis, peptic ulcer and gastric cancer. Scand J Gastroenterol Suppl 1993;196:3-6. Nouraie M, Razjouyan H, Assady M, Malekzadeh R, Nas-seri-Moghaddam S.Epidemiology of gastroesophageal reflux symptoms in Tehran, Iran: a population-based tele-phone survey. Arch Iran Med 2007;10:289-94.
Ehsani MJ, Maleki I, Mohammadzadeh F, Mashayekh A. Epidemiology of gastroesophageal reflux disease in Teh-ran, Iran. J Gastroenterol Hepatol 2007;22:1419-22. Fujimoto K, Iwakiri R, Okamoto K, Oda K, Tanaka A, Tsunada S, et al. Characteristics of gastroesophageal reflux disease in Japan: increased prevalence in elderly women. J Gastroenterol 2003;38:3-6.
el-Serag HB ,Sonnenberg A. Associations between dif-ferent forms of gastro-oesophageal reflux disease. Gut
1997;41:594-9.
Borsch G ,Gude C. Diagnostic yield of upper gastrointes-tinal endoscopy in relation to age: retrospective analysis of 8,043 patients. Hepatogastroenterology 1989;36:113-9. Ho KY, Chan YH, Kang JY.Increasing trend of reflux esophagitis and decreasing trend of Helicobacter pylori infection in patients from a multiethnic Asian country. Am
J Gastroenterol 2005;100:1923-8.
33.
34. 35.
36. 37.
38. 39. 40.