Int. J. Food System Dynamics 2(4), 2011, 357‐375
Perceived Traceability Costs and Benefits in the Italian
Fisheries Supply Chain
Daniele
Asioli
1,
Andreas
Boecker
2,
and
Maurizio
Canavari
11
University of Bologna, Italy, 2University of Guelph, Canada
Daniele.asioli@unibo.it; aboecker@uoguelph.ca; Maurizio.canavari@unibo.it Received March 2010, accepted September 2010, available online March 2012
ABSTRACT
The paper proposes a model in which it is hypothesized that firm characteristics influence both costs and benefits
of traceability. The proposed model differentiates between aggregate measures and specific categories, as well as
between expected costs and benefits on the one hand and perceived actual outcomes on the other, and is tested in
a series of regression analyses based on a survey sample of 60 Italian fish processors. The findings indicate that firm
characteristics are not strongly associated with any specific cost or benefit measure. However, expected overall
benefits are highly significantly impacted by firm size and the number of quality management systems certified,
while actual overall benefits only by firm size. Finally, the study also finds considerable discrepancies between
expected and actual costs and benefits. The managerial implications of the findings are discussed.
Keywords: Traceability, firm characteristics, costs, benefits, Italy, fishery processors
1
Introduction
and
Objectives
of
the
Study
Traceability is not a new concept, but it is a management practice that European food operators need to
implement to comply with the “European General Food Law” (EGFL, Regulation (EC) No 178/2002) (2002).
The EGFL defines traceability as “the ability to trace and follow a food, feed, food‐producing animal or
substance through all stages of production and distribution”. According to Golan et al. (2004) the
definition of traceability is necessarily broad because the food industry is complex due to the variety of
food products available for consumers and to the range of inputs and ingredients used. Thus, the EGFL
does not state any specific methods or techniques that food business operators have to follow to
establish a traceability system (Canavari et al. 2010). As firms can customize the most appropriate
approach (Folinas et al. 2006), a plethora of traceability initiatives, guidelines and standards is currently
evolving. As a result, most specific traceability definitions or levels differ between operators depending on
the business activity, stage in the supply chain and applicable legislation (ECR Europe 2004).
The level of traceability capacity may be described using three dimensions (Golan et al. 2004):
precision, reflecting the size of a traceable lot or batch that is uniquely identified. It can range from a
single product package to a whole day of production.
breadth, describing the amount of information collected that can be connected with the lot.
depth, describing how far back or forward the system regularly traces the relevant information.
According to Golan et al. (2003) firm’s resources and objectives, as summarized as firms characteristics,
influence costs and benefits associated with traceability system implementation. Firm characteristics,
such as size (Mora and Menozzi 2003; Bulut and Lawrence 2007), adopted quality management systems
(QMS) (Mora and Menozzi 2005), technological sophistication or strategic orientation of the firm, the type
firm’s investments in a traceability system will vary in costs and benefits. That is not an indicator of
inadequacy, but of efficiency as a result of careful balancing of costs and benefits (Golan et al. 2004).
Thus, firms balance costs and benefits of traceability and tend to efficiently allocate resources to build
and maintain the traceability system only when the benefits outweigh the costs (Golan et al. 2004).
To date, few empirical studies are available that have investigated in‐depth traceability costs and benefits
(Pouliot 2008; Stuller and Rickard 2008; Chryssochoidis et al. 2009; Mejia et al. 2010) or firms’ incentives
for implementing tracking and tracing technologies (Hobbs 2004). While it is rather straightforward to
assess costs, many benefits are difficult to assess due to low probability, difficulty in isolating them from
other causes or due to their intangible nature. This is one reason why adoption of traceability has been
slow in the food sector (Verdenius 2006) and few studies analyse benefits at the firm level.
Thus, this paper aims at contributing to fill this knowledge gap through an empirical analysis to provide
answers to specific questions:
Are firm characteristics linked to costs and benefits associated with traceability, as observed by
management in the food industry?
Are there discrepancies between ex‐ante (expected) and ex‐post (actual) specific cost and benefit
categories associated with traceability system implementation reported by managers in the food
industry?
By differentiating between expected and actual costs and benefits, our study addresses the issue of
investment under uncertainty, which has so far received little attention in the literature. Hence, our
survey approach allows identifying particularly stark discrepancies between expectations and outcomes to
inform policy and business decision makers.
2
Background
2.1 Costs of Traceability
Amongst others, costs of traceability can depend on the regulatory environment, firm size, firm strategy,
the technology adopted by the firm, characteristics of products and production processes, structure and
complexity of the supply chain and the amount of information required to be stored (FSA 2002).
Moreover, the presence of small‐scale production systems and spot‐market transactions are obstacles to
tracking and tracing products and result in high costs to improve traceability (Theuvsen and Hollman‐
Hespos 2005).
Table 1 divides traceability costs into implementation and maintenance/operation costs. ‘Time and effort’,
which includes production line, supervisory staff, managerial/administrative staff time and disruption of
production, is an important traceability cost both for implementation and maintenance (Meuwissen et al.
2003). Such costs depend on the specialized skills and knowledge of human resources necessary for
system implementation and use (Theuvsen and Hollman‐Hespos 2005). In a study conducted by Mora and
Menozzi (2003) on a sample of 15 firms representing 20% of Italian beef processing, the medium and large
companies had to hire additional personnel to comply with regulatory traceability requirements. The
disruption of operations is an important cost that may also be linked to reluctant workforce, because
additional effort is required for strictly separating each lot, inputting data and printing different labels,
etc. ‘Equipment and software’ are fundamental for the management of traceability systems (Meuwissen
et al. 2003). Such costs could be very important depending upon whether such equipments (e.g.
computers, palmtops, barcode systems, printers, etc.) or software are already installed in the plant and
Table 1.
Categories of traceability costs
CATEGORY IMPLEMENTATION OPERATION/MAINTENANCE
TIME AND EFFORT
(of workforce, administration
and management)
Information search/processing Change management
Test runs/interruptions
Slow down/interruption of
operations
Additional reporting/mock recalls
EQUIPMENT AND SOFTWARE New purchases/installation Upgrades and service contracts
TRAINING Extensive, comprehensive Ongoing, for new staff
EXTERNAL CONSULTANTS For system choice/design For specific challenges
MATERIALS Switch to new materials
“system” Labels/Packaging
CERTIFICATION AND AUDITS Initial audits/certification Repeat audits/certification
Source: adapted and expanded from Meuwissen et al. (2003) and Mora and Menozzi (2003)
‘Training’ of staff and management is an important traceability cost. Basically, it is a cost of
implementation, but it also could be an operation cost when, for instance, there is an upgrading of the
traceability software, new software functions are added or new staff is hired. The cost of ‘External
consultants’ is particularly important for firms that do not have specialized personnel and expertise within
the firm. The external consultants primarily deal with the design and implementation of the traceability
software (e.g. IT – engineer), understanding and complying with traceability, labeling and hygiene
regulations and assistance for certification and audits and, to a lesser extent, with tasks after
implementation. The cost of ‘Materials’ is associated with using pallets, boxes or labels (Stuller and
Rickard 2008) required to conduct physical handling of traceability. For instance, a high level of precision
requires lots to be kept separate using different pallets and/or boxes as well as unique identification
through labels. Finally, ‘Certification and audit’ costs are associated with the adoption of traceability
certification standards (e.g. ISO 22005:2007) by food operators.
2.2 Benefits of Traceability
Traceability produces various benefits in the food supply chain.
In
accordance
with
Sparling
and
Sterling (2004) we divide benefits into four groups (Table 2). Table 2.
Main categories of traceability benefits
CATEGORY DESCRIPTION/EXAMPLES
REGULATORY Avoiding penalties for non‐compliance
No legal barriers to market access
RECALL AND RISK
MANAGEMENT
More targeted, quicker recall reduces cost
Reduced cost of liability insurance
MARKET AND CUSTOMER
RESPONSE
Reputation (build‐up or regain after crisis)
New customers and easier market access
Real‐time information for sales calls
Increased demand/price for output
SUPPLY CHAIN OPERATIONS Improved inventory management
More efficient communication with customers and/or suppliers
‘Regulatory benefits’ constitute the first category, as compliance with regulation is a main driver (FSA
2002). Regulatory compliance is a fundamental prerequisite to having access to different food markets.
Furthermore, traceability satisfies the legislation requirements of labeling regulations with reference to
the potential development of a brand (Verbeke 2001).
‘Recall and risk management benefits’ constitute the second category, as also pointed out by Folinas et al.
(2006) and Gellynck et al. (2007) because enhanced traceability can significantly reduce recall scopes or
the amount of product which must be destroyed in response to a food safety issue. According to Theuvsen
and Hollman‐Hespos (2005) risk management in agriculture and food industry aims at lowering losses due
to product recalls. The amount of losses is influenced by the likelihood as well as the short‐term (e.g.
logistic costs of recalls, etc.) and long‐term damages of recalls (e.g. firm reputation and brand value). The
third category of benefits are ‘Market and customer response benefits’. Benefits are generated when
traceability allows business partners to meet the specific needs requested by customers. In addition to a
direct demand of traceability, traceability can also provide market benefits through product
differentiation based on credence attributes and through increasing consumer trust (Meuwissen et al.
2003). The last category of benefits include ‘Supply chain benefits’ as traceability assists supply chain
partners to eliminate inefficient practices without value to consumers. According to (Sodano and Verneau
2003), traceability can reduce transaction costs: this is particularly important for small to medium sized
firms to gain market access and a higher market share with reduced investment in quality control systems
and processes innovation. Furthermore, supply chain management benefits include the improvement of
inventory management, which in turn reduces product waste as well as ensuring a more consistent quality
delivery to supply chain end users (Sparling and Sterling 2004).
2.3 Firm Characteristics
As mentioned above, firm characteristics may influence costs and benefits associated with traceability
system implementation. For example, quality management systems (QMS) adopted by firms may affect
the costs and benefits. Mora and Menozzi (2005) mention that the cost of traceability is lower when firms
already have a QMS in place (e.g. a QMS complying with the ISO 9001:2008 standards). This is because,
quality management systems usually include elements of traceability. On the other hand, firms without
QMS could benefit very much and more than firms that have a certain level of QMS, simply because they
start from zero benefits.
An in‐depth study conducted by the Institute of Food Technologists (Mejia et al. 2010) in 58 food
companies in seven sectors covering all supply chain stages found that firm size could affect costs and
benefits of traceability. Variable costs of traceability practices may increase with firm size, as large firms
have larger and more complicated operations than small firms which in turn request more arrangements
to comply with these standards thus increasing the cost. At the same time, Bulut and Lawrence (2007)
found that the average fixed costs of implementing traceability decrease with the production or
processing volume, but they also point out another advantage of small and mid‐size firms in implementing
traceability: large firms that have a higher number of suppliers may not be able to always fill a single
batch with input from one supplier only. This complication of traceability practices may require more
sophisticated technologies and managerial efforts and thus increase costs. Operations complexity
captures differences between firms relating to the nature of the products including harvest and packaging
location, how the product is packaged and shipped. Traceability practices consist of data collection
through the food chain (Mejia et al. 2010). Thus, when operations are more complicated, the cost of data
collection and data management increases. The diversity of food processing operations means that the
way in which traceability records are kept by any business is practically unique and businesses make
individual and widely varying decisions with regard to the size of batches that are produced and hence the
size of any recall (FSA 2002).
Complexity of customer requirements could affect costs and benefits by traceability practices. Traceability
costs are multiplied and margins lowered even further if multiple customers require different standards
for their own traceability initiatives (Mejia et al. 2010). De Souza Monteiro and Caswell (2004) points this
out for beef exports to different countries, as, for example, beef export supply chains to Japan and the EU
3
Conceptual
and
Empirical
Model
The theoretical model for this study proposes that a firm’s resources and objectives, as captured by its key
firm characteristics:
determine ex‐ante (or expected) costs and benefits of traceability implementation;
and due to uncertainties at the time of decision making, ex‐post (or actual) costs and benefits can
differ from ex‐ante (or expected) costs and benefits of traceability implementation.
While ex ante, expected costs and benefits are a function of the firm’s resources and objectives,
summarized as firm characteristics, the ex‐post cost and benefits are function of a certain level of
traceability chosen by firms. Thus, ex‐post costs and benefits of traceability would be directly influenced
by the level of traceability and indirectly through firm characteristics, as could be modelled in a structural
equation model approach.
However, while the theoretical analysis is straightforward, in a survey‐based empirical analysis as
proposed for this study, a valid measurement of the level of traceability adopted has proven to be difficult
to obtain. First, the literature reviews only found a few studies that measure the level of traceability.
Bulut and Lawrence (2007) measure the depth of traceability (backward and forward). No literature at all
informs us about how to quantify the levels of traceability dimensions. Second, the level of traceability
adopted at the time of system implementation may not be observable any more, as it might have been
adjusted in response to changes in the business environment and because of technological upgrading.
Third, it would also be complicated to assess a unique level of traceability for firms, because they may
adopt many levels of traceability depending on types and suppliers of raw materials, or types of
customers. Breadth, depth and precision within firms may also vary depending on products; for example,
a certain level of precision may be required at input stage and a different level may be adopted at output
stage.
Due to these challenges, the analysis will focus on the relationship between firm characteristics and
expected and actual perceived costs and benefits. In other words, we hypothesize that firm characteristics
affect expected and actual costs and benefits, leaving out the intermediate variable ‘level of traceability’.
The conceptual model thus proposes that expected and actual costs and benefits are a function of the
firm characteristics:
Cost implement = f (firm size; operation complexity; complexity of customer requirements; number of QMS
adopted) (1)
Cost maintenance = f (firm size; operation complexity; complexity of customer requirements; number of QMS
adopted) (2)
Benefit trace = f (firm size; operation complexity; complexity of customer requirements; number of QMS
adopted) (3)
Accordingly, for empirical estimation we specify a linear OLS regression model for each of the dependent
cost and benefit variables for firm i:
Costimplement, i = 0 + 1Si+2Oi+3Ci+4Qi+e (4) Costmaintenance, i = 0 + 1Si+2Oi+3Ci+4Qi+e (5)
Benefittrace, i = 0 + 1Si+2Oi+3Ci+4Qi+e (6)
In all the equations 0 stands for the constant, 1 for the regression coefficient of firm size Si, 2 for the
coefficient of operation complexity Oi, 3 for the coefficient of complexity of customer requirements Ci,
4
Methodology
Data analysis is based on a questionnaire that was pre‐tested in spring 2008 and then administered
among a sample of 60 Italian fish processors through a phone survey in summer 2008. The sample frame
has been produced by cross‐checking the entire population of fish processors listed in the most recent
Italian Census of Industry and Service of Istat (2001)* and a list provided in the Yearbook of Fishery and
Fishing (2007/2008, n.18)†. The overall population was composed of 415 firms, of which 303 were
contacted so that the resulting response rate of usable questionnaires was 20%. Although no data is
available that would allow assessing the representativeness of the sample, it is reasonable to assume that
larger firms are overrepresented. In fact, the Italian fish processing industry mainly consists of very small,
locally operating firms, but their manager‐owners tend to be reluctant to participate in surveys. The
following tables 3, 4 and 5 present how the variables that enter the analysis to represent firm
characteristics and cost and benefit indicators were measured and, where applicable, recoded into
indices‡.
Firm characteristics (Table 3) that were elicited in the survey do not include any measurement of strategic
orientation or firm objectives, as this was deemed to considerably increase the risk of overburdening the
respondents. However, some of the variables included are reflective of strategy components that are
certainly relevant for costs and benefits of traceability. E.g., the number of sales destination regions can
be expected to be positively related with both the cost and the benefits of traceability.
*
Istat, 2001. Website: http://dwcis.istat.it/cis/index.htm
†
The Yearbook is published by Edizioni Pubblicità Italia s.r.l. (http://www.pubblicitaitalia.com) that is largely considered by the Italian fishery operators as the most important professional Italian publishing house in the fishery supply chain.
‡
Table 3.
Firm characteristics indices
VARIABLE CODING RANGE OF
SCORES
SIZE
Equally weighted cumulative score of labor force size index (Scores
between 0.5 and 8) and revenue categories (1: below EURO 250,000; 8:
above EURO 25 million).
Min score: 1.5 Max score: 16
OPERATIONS
COMPLEXITY
Number of different raw material types that are used in operation:
seafood; freshwater fish; shellfish; crustaceous (Scores assigned: 1 for
each type of raw material). Min score: 2
Max score: 12
Number of different product categories that are produced at facility:
fresh; frozen; deep‐frozen; other (Scores assigned: 1 for each type of
product categories) and preserved/pickled; dried/salted/smoked (Scores
assigned: 2 for each type of product categories).
COMPLEXITY OF
CUSTOMER
REQUIREMENTS
Number of different customer types to which output is sold:
Regional/local retailer; Local fishery shop; Pitchman; Wholesaler;
Wholesale market; Other Food service operator; Direct to the final
consumer; Other processors; Other (Scores assigned: 1 for each type of
customers). International/national retailer; Food service chain; Institution
(Scores assigned: 2 for each type of customer).
Min value: 2
Max value: 23
Number of different regions to which output is sold: Italy; other EU
countries; other European countries; North America; South America;
Africa; Asia; others (Scores assigned: 2 for each type of customers).
QMS
Number of food quality or safety assurance/management standard to
which the firm is certified: ISO 9000:2000; HACCP, ISO22000:2005; MSC,
ISO14001; IFS; BRC; EUREPGAP; others (Scores assigned: 1 for each type
of QMS).
Min score: 0
Max score: 9
As shown in table 4, 5 and 6 costs and benefits were measured at two levels. In the first level, we
measured overall costs and benefits using 9‐point rating scales as described in the table 4.
Table 4.
Indicators of overall expected and actual cost and benefits and discrepancies
INDEX EXPLANATION RESPONSE SCALE RANGE OF
SCORES
EXPECTED COST OF
IMPLEMENTATION
Magnitude of expected
implementation costs
Rating scale: from 1 (Very low)
to 9 (Very high)
Min score: 1 Max score: 9
ACTUAL COST OF
IMPLEMENTATION
Magnitude of actual
implementation costs
Rating scale: from 1 (Very low)
to 9 (Very high)
Min score: 1 Max score: 9
IMPLEMENTATION COST
DISCREPANCY
Discrepancy between
expected and actual
implementation costs
Actual implementation cost –
Expected implementation cost
Min score: ‐
8
Max score:
+8
EXPECTED OPERATING
COSTS
Magnitude of expected
operating costs
Rating scale: from 1 (Very low)
to 9 (Very high)
Min score: 1 Max score: 9
ACTUAL OPERATING
COSTS
Magnitude of actual
operating costs
Rating scale: from 1 (Very low)
to 9 (Very high)
Min score: 1 Max score: 9
OPERATING COSTS
DISCREPANCY
Discrepancy between
expected and actual
operation costs
Actual operating cost –
expected operating cost
Min score: ‐
8
Max score:
+8
EXPECTED BENEFITS Magnitude of expected
overall benefits
Rating scale: from 1 (Very low)
to 9 (Very high)
Min score: 1 Max score: 9
ACTUAL BENEFITS Magnitude of actual overall
benefits
Rating scale: from 1 (Very low)
to 9 (Very high)
Min score: 1 Max score: 9
BENEFITS DISCREPANCY Discrepancy between
expected and actual benefits
Actual benefits – expected
benefits
Min score: ‐
8
Max score:
+8
At the second level, specific cost and benefit categories were reported using constant sum scales of 100
Table 5.
Indicators of specifics benefits
INDEX RESPONSE SCALE*
MEETING CURRENT AND ANTICIPATED FUTURE REGULATORY REQUIREMENTS 0 to100
MEETING CUSTOMER'S REQUIREMENTS AND INCREASING HIS TRUST 0 to100
INCREASING CONSUMER TRUST 0 to100
INCREASING MARKET SHARE OR ACCESSING NEW MARKETS AND OBTAIN A PRICE
PREMIUM 0 to100
REDUCING CUSTOMER COMPLAINTS, RECALLS, RISK AND PRODUCT LIABILITY 0 to100
IMPROVING MANAGEMENT WITHIN THE COMPANY AND REDUCING THE POSSIBILITY
OF ERRORS FOR DATA INPUT AND DATA MANAGEMENT 0 to100
IMPROVING SUPPLY CHAIN MANAGEMENT 0 to100 * All items were rated on a 100 point constant sum scale.
Table 6.
Indicators of specifics costs
INDEX RESPONSE SCALE*
PURCHASE NEW EQUIPMENT AND SOFTWARE 0 to100
PRODUCTION LINE, SUPERVISORY STAFF AND MANAGERIAL ADMINISTRATIVE TIME 0 to100
CERTIFICATION AND AUDIT AND EXTERNAL CONSULTANTS 0 to100
TRAINING COURSE 0 to100
MATERIALS 0 to100
* All items were rated on a 100 point constant sum scale.
These measurements will be addressed in more detail when the importance of ex‐ante and ex‐post
specific costs and benefits are discussed in the descriptive analysis. Although the collected data does not
allow to put a dollar value to costs and benefits of traceability, nor to calculate a net benefit, the scale
level of the measurement facilitates an assessment of the impact of the firms characteristics on costs and
5
Results
5.1 Describing 1: Firm characteristics
Starting with the descriptive statistics of the firms characteristics, it is confirmed that the larger firm sizes
are overrepresented in the sample as 45% of the sample reported operating revenues above 10 million
Euro in 2007 (Table 7).
Table 7.
Describing the sample: firms’ characteristics
VARIABLE PERCENTAGE
RESPONDENTS Quality Managers (45%), CEOs (23%)
REVENUE > EURO 10 MILLION 45%
RAW MATERIALS Seafood (90%), Shellfish (77%), Crustaceous (67%)
AREAS OF SUPPLIER Italy (85%), EU (78%)
AREAS OF SALES Italy (100%), EU (55%)
TYPES OF PRODUCTS MANUFACTURED Frozen (62%), Fresh (53%), Preserved and semi‐preserved (42%)
CUSTOMERS Wholesaler (83%), International/National chain (77%)
HACCP 88%
ISO 9001:2000 CERTIFIED 42%
TRACEABILITY CERTIFIED 12%
Italy (85%) and EU (78%) are the main suppliers of raw materials which are used in the operations,
whereas the sample is quite homogenous in terms of fish types being used as input (seafood, shellfish and
crustaceous), with seafood (90% usage rate) being the main category. All the firms interviewed sell
finished products to Italy and 55% to EU markets, while the most important typologies of customers are
wholesalers (83%) and international/national retail chain (77%). With regard to the quality management
systems, almost all the firms interviewed had adopted a HACCP system while 42% were ISO 9001:2000
certified. Seven out of sixty firms have been certified according to UNI 10939:2001, UNI 11020:2002 and
ISO 22005:2007. Given that traceability certification has only become available in 2001, a share of more
than 10% traceability certified firms in the sample is rather high. This might indicate that the sample is
above industry average with regard to the level of traceability practices.
Next, table 8 provides the measures of central tendency and dispersion for the firm characteristics indices
and expected and actual costs and benefits. The results show that scores span large parts of the index
scales for firm size, operations complexity and complexity of customer requirements. Given that the
industry predominantly consists of (very) small businesses, an average of two QMS certifications appears
to be high, lending further support to the suspicion that the sample is above average with regard to
managerial sophistication.
Table 8.
Descriptive statistics of firms’ characteristics
INDEX SCALE MEAN S.D. MIN MAX
FIRM SIZE 1.5 16 8.52 2.92 2 14
OPERATIONS COMPLEXITY 2 12 5.63 2.12 2 11
COMPLEXITY OF CUSTOMER REQUIREMENTS 2 23 7.98 2.95 3 15
QMS 0 9 2.07 1.23 0 5
5.2 Descriptives 2: Expected versus actual benefits and costs of traceability
As shown in table 9, respondents were, on average, optimistic on operation costs ex‐ante traceability
system implementation. With a mean discrepancy score of + 0.20, actual operating costs ex post were
slightly higher than expected (or ex ante). On average, respondents were also optimistic about benefits
from traceability: the score of actual benefits was less than that of expected ones (Discrepancy = ‐ 0.35).
Opposite to that, actual implementation costs were, on average, reported to be less than expected
(Discrepancy = ‐ 0.39). For all three business performance measures, discrepancies could be quite
substantial in both directions for an individual firm, as is apparent from the minimum and maximum
scores.
Table 9.
Descriptive statistics of overall cost and benefit indicators
INDEX N SCALE MEAN S.D. MIN MAX
EXPECTED IMPLEMENTATION COST 57 1 9 5.81 1.97 1 9
ACTUAL IMPLEMENTATION COST 57 1 9 5.41 2.58 1 9
DISCREPANCY IMPLEMENTATION COST (a) 57 ‐8 +8 ‐0.39 2.33 ‐8 4
EXPECTED OPERATING COST 56 1 9 5.03 2.18 1 9
ACTUAL OPERATING COST 56 1 9 5.23 2.46 1 9
DISCREPANCY OPERATING COST (a) 56 ‐8 +8 0.20 1.72 ‐3 5
EXPECTED BENEFITS 57 1 9 6.67 2.01 1 9
ACTUAL BENEFITS 57 1 9 6.32 2.07 1 9
DISCREPANCY BENEFITS (a) 57 ‐8 +8 ‐0.35 1.80 ‐7 5 DISCREPANCY = ACTUAL Costs (OR Benefits) – EXPECTED Costs (OR Benefits).
As shown in table 10, descriptive statistics of the scores from the 100 point constant sum scale, indicate
that the three most important specific benefits are: ‘Meeting current and anticipated future regulatory
requirements’, ‘Meeting customer's requirements and increasing his trust’ and ‘Increasing consumer
trust’. One interpretation is that the adoption of traceability system is mainly driven by external requests,
rather than by improvements in processes and efficiencies. However, the low score for market driven
incentives may point to a disconnect between these external requests and a tangible reward in market
performance. This is further accentuated by the fact ‘Increasing market share, accessing new markets or
obtaining a price premium’ is also characterized by the sharpest drop from ex ante to ex post score among
all items, ‐ 2.69 absolute or ‐ 24%.
Similarly but not as pronounced, firms have overestimated the benefits of ‘Increasing consumer trust’ and
‘Improving supply chain management’. Opposite to that, firms have underestimated benefits from
‘Improving management within the company and reducing the possibility of errors for data input and data
management’, ‘Reducing customer complaints, recalls, risk and product liability’, ‘Meeting customers’
requirements and increasing their trust’ and ‘Meeting current and anticipated future regulatory
Table 10.
Descriptive statistics of specific benefits
SPECIFIC BENEFITS Min Max Mean S.D.
EXPECTED “Meeting current and anticipated future regulatory
requirements” 0 70 21.77 15.96
ACTUAL “Meeting current and anticipated future regulatory requirements” 4 70 23.04 16.07
EXPECTED “Meeting customer's requirements and increasing his trust” 0 50 16.18 10.75
ACTUAL “Meeting customer's requirements and increasing his trust” 0 50 17.29 9.85
EXPECTED “Increasing consumer trust” 0 40 15.67 8.80
ACTUAL “Increasing consumer trust” 0 40 14.96 9.72
EXPECTED “Improving management within the company and reducing the
possibility of errors for data input and data management” 0 50 12.91 9.22
ACTUAL “Improving management within the company and reducing the
possibility of errors for data input and data management” 0 40 14.52 9.51
EXPECTED “Reducing customer complaints, recalls, risk and product
liability” 0 30 10.68 7.41
ACTUAL “Reducing customer complaints, recalls, risk and product liability” 0 30 12.46 8.62
EXPECTED “Improving supply chain management” 0 50 11.67 11.17
ACTUAL “Improving supply chain management” 0 40 11.58 10.65
EXPECTED “Increasing market share, accessing new markets or obtaining a
price premium” 0 40 11.12 8.84
ACTUAL “Increasing market share, accessing new markets or obtaining a
price premium” 0 25 8.43 7.70
As shown in table 11, the three most important specific costs are: ‘Purchase new equipment and
software’, ‘Production line, supervisory staff and managerial administrative time’ and ‘Certification and
audit and external consultants’. In addition, when comparing expectations with actual outcomes, firms
have overestimated the costs of ‘Purchase new equipment and software’ and ‘Training course’, while they
have underestimated the ‘Production line, supervisory staff and managerial administrative time’ and
Table 11
Descriptive statistics specific costs
SPECIFIC COSTS Min Max Mean S.D.
EXPECTED “Purchase new equipment and software” 0 90 32.64 21.69
ACTUAL “Purchase new equipment and software” 0 70 30.74 20.21
EXPECTED “Production line, supervisory staff and managerial administrative
time” 0 50 21.97 11.74
ACTUAL “Production line, supervisory staff and managerial administrative
time” 0 70 24.26 13.94
EXPECTED “Certification and audit and external consultants” 0 50 18.17 12.83
ACTUAL “Certification and audit and external consultants” 0 60 20.14 14.15
EXPECTED “Training course” 0 70 13.00 9.53
ACTUAL “Training course” 0 50 11.67 8.93
EXPECTED “Materials” 0 30 12.50 9.81
ACTUAL “Materials” 0 50 12.75 11.23
Thus, it seems that while firms have underestimated costs related to labour, they overestimated costs of
purchasing new equipment and the training for its use.
5.3 Regression Analysis
The expected (ex ante) and actual (ex post) measures of overall and specific costs and benefits were
treated as dependent variables in a series of regression analyses in which the four firm characteristics
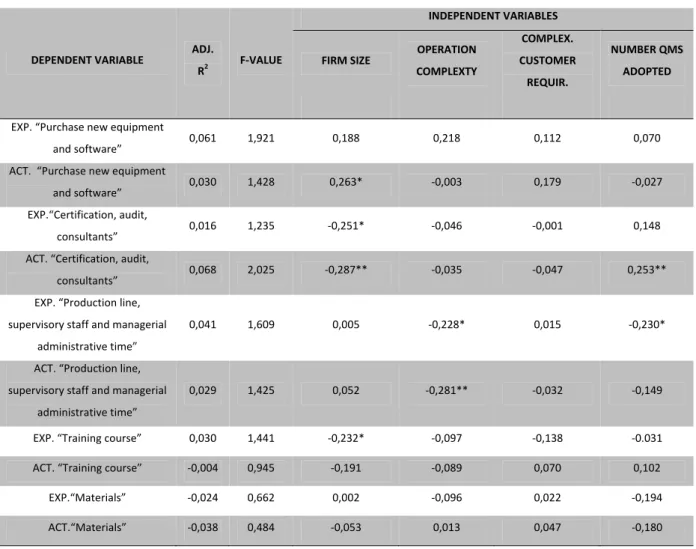
described earlier were entered as independent variables. None of the regressions for the 24 specific cost
and benefit measures was found to be significant at the 5% significance level and only one at the 10%
level (see Appendix). The goodness of fit was similarly low: all regressions had adjusted R2 values below
0.1 and sometimes negative. Of the 96 regression coefficients in total, four were found to be significant at
the 5% level and six more at the 10% level. This overall regression outcome for the specific benefit and
cost measures is well in the range of a purely chance outcome, from which we can infer that specific
benefits or costs are not significantly correlated with the proposed measures of firm characteristics. This
finding would lead us to argue that the diversity of food processing operations leads to unique traceability
benefits and costs that cannot be linked with firm characteristics in a systematic way. We therefore do
not provide the results here or any attempt of interpreting the results, i.e. the signs of significant
coefficients. However, we would like to point out two observations at the aggregate level of significant
coefficients. With two coefficients significant at the 5% and three at the 10% level, ‘Firm size’ does seem
to matter, and more so for cost than for benefits. Further, firm characteristics were found to be more
often associated with actual outcomes than with expected ones. Of the ten coefficients that were found
to be significant, seven, including all four that are significant at the 5% level are found in regressions for
actual costs and benefits. At the level of overall costs and benefits, this is exactly the opposite, as will be
discussed next.
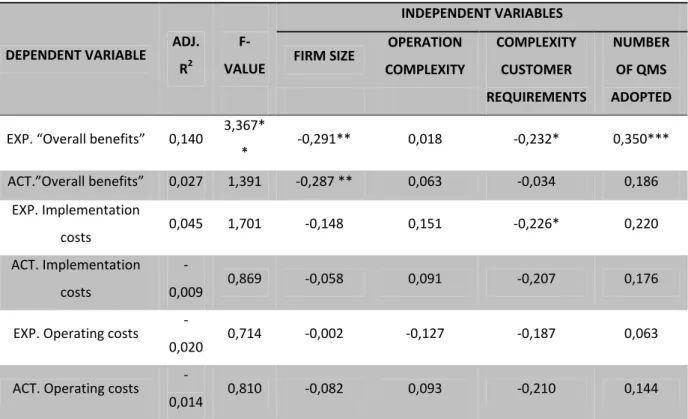
Table 12 reports the results of the model estimations regressing overall benefit scores, as well as overall
implementation and operating costs on firm characteristics.
Table 12.
Regression analysis results for perceived expected and actual benefits and costs
DEPENDENT VARIABLE ADJ.
R2
F‐
VALUE
INDEPENDENT VARIABLES
FIRM SIZE OPERATION
COMPLEXITY
COMPLEXITY
CUSTOMER
REQUIREMENTS
NUMBER
OF QMS
ADOPTED
EXP. “Overall benefits” 0,140 3,367*
* ‐0,291** 0,018 ‐0,232* 0,350***
ACT.”Overall benefits” 0,027 1,391 ‐0,287 ** 0,063 ‐0,034 0,186
EXP. Implementation
costs 0,045 1,701 ‐0,148 0,151 ‐0,226* 0,220
ACT. Implementation
costs
‐
0,009 0,869 ‐0,058 0,091 ‐0,207 0,176
EXP. Operating costs ‐
0,020 0,714 ‐0,002 ‐0,127 ‐0,187 0,063
ACT. Operating costs ‐
0,014 0,810 ‐0,082 0,093 ‐0,210 0,144
*** , **, * indicate coefficients that are significant at the 1%, 5% and 10% significance level, respectively.
There are two perspectives for interpreting the results. First, in a traditional way, the proposed
conceptual model is to be assessed based on each regression’s overall significance and goodness of fit and
the significance of individual regression coefficients. Second, comparison of significance levels between
expected to actual outcomes may help identify particular expectations being confirmed or not.
Although significance levels and goodness of fit are improved over the regressions for the specific costs
and benefits, the overall performance of the six regressions is poor. Only one model, ‘Overall benefits’, is
significant at the 5% level; three of the 24 coefficients are significant at the 5% level, and two more at the
10% level. However, four of these five significant coefficients are linked with expected outcomes, which is
in contrast to the findings for the specific cost and benefit measures. So how could it be that firm
characteristics impact expectations for aggregate impacts of traceability, in particular overall benefits? An
adjusted R2 of 0.140 is reported for this regression, which is not negligible for cross sectional data. Both
firm size and the complexity of customer requirements are negatively correlated with the benefit score,
which would need to be interpreted on the basis of the argument put forward by (Bulut and Lawrence
2007). For the number of QMS certifications being positively and highly significantly – at the 1% level –
correlated with the overall benefit score, the following explanation appears plausible. The implemented
traceability system or set of traceability practices was expected to provide a common platform for all
certification requirements for data collection and storage for traceability and quality management and
assurance. This would not only reduce cost of data management and analysis but also enhance the
services that can be provided to customers requiring a specific QMS certification.
Comparing the regression results for the expected with the actual ‘Overall benefits’ then shows that these
expectations were not confirmed after traceability was implemented. The ‘Number of QMS adopted’ is
not significant any more, and neither is the regression as a whole. This result should caution any
expectations in the managerial decision making process toward traceability investments about potential
synergy effects between a traceability investment and the number of certified quality management
systems on the other.
Finally, while the ‘Complexity of customer requirements’ has also become insignificant, ‘Firm size’ remains
significant at similar magnitude so that one might argue that the argument by (Bulut and Lawrence 2007)
6
Concluding
remarks
Our empirical study provided the following three insights on the relationship between firm characteristics
and expected and actual costs and benefits of traceability in the Italian fish processing industry:
Expected overall benefits are correlated with firm characteristics, while actual benefits are not. More
specifically, stated expected benefits are negatively correlated with firm size and the complexity of
customer requirements, while they are positively correlated with the number of QMS certifications.
The fact that actual benefits remain only (negatively) correlated with firm size may point to false, or
better: not confirmed expectations that enhanced traceability automatically provides a unified
platform for data collection, storage and analysis that can also be utilized by QMS requirements.
Opposite to expectations, actual benefits are neither linked to the complexity of customer
requirements, as approximated in this study by the number of different customer types.
For the more specific cost and benefit measures, no significant relation to firm characteristics was
found. At this point we have no other explanation to offer than the uniqueness of each fish
processor’s customer relations and thus traceability practices and costs and benefits concealing any
link to rather broad measures of firm characteristics, as applied in this study.
Finally, we found considerable discrepancies between expected and actual costs, as well as between
expected and actual benefits, both at the overall and the more specific levels. Most striking are the
discrepancies for market‐oriented benefits related to market share and access and price premium and
for the time demand at all management and staff levels as an important cost factor. For both, the
managerial implications are straightforward. Any potential market related benefits, e.g. as might be
based on notifications of increased business prospects or price premiums with current customers,
should be vetted thoroughly and intensively in cost‐benefit analyses prior to investing in traceability.
The same applies to estimates of time requirements for the implementation of traceability practices or
systems, which tend to be underestimated.
Moreover, descriptive statistical analysis reveal that the choice of adopting a traceability system might be
motivated by “external” factors such as the need of complying with government regulations or customer
standards, rather than “internal” factors such as the need of improving management performance. On the
other hand, while the interviewed firms have seemingly underestimated the importance of supply chain
management, recall and regulatory benefits and costs related to labour, they overestimated market
benefits and costs associated with the implementation and use of the traceability technology.
These results are important because firms implementing a traceability system have to take into
consideration the anticipated traceability benefits when deciding the strategic plan. In particular, we
found that costs and benefits may be different according to ‘firm size’ as well as the level of ‘Operation
complexity’ and the ‘Number of QMS adopted’. Practitioners may also learn from the fact that in our
sample benefits and costs related to the implementation and use of traceability technology were more
relevant than expected considering supply chain management, recall capacity and regulatory compliance,
while market benefits proved to be relatively less important than expected.
However, we acknowledge that our results are not to be considered ultimate, since the adopted model’s
general performance was not satisfactory in regards to explaining the variance of costs and benefits.
Different model specifications and different approaches may be used to analyze these data more
thoroughly. Therefore, we deem the analysis of the relationships between traceability costs and benefits
and firm characteristics deserves more attention in the scientific literature in the future.
Acknowledgements
Financial support from the “Marco Polo” Program of the University of Bologna and from Ontario
References
Bulut, H., Lawrence, J. D. (2007). Meat Slaughter and Processing Plants' Traceability Levels: Evidence From
Iowa. Paper presented at the NCCC‐134 Conference on Applied Commodity Price Analysis, Forecasting, and
Market Risk Management, 16 ‐ 17 April 2007, Chicago, United States, pp. 33.
Canavari, M., Centonze, R., Hingley, M., Spadoni, R. (2010). Traceability as part of competitive strategy in the
fruit supply chain. British Food Journal 112 (2): 171‐86.
Chryssochoidis, G., Karagiannaki, A., Pramatari, K., Kehagia, O. (2009). A cost‐benefit evaluation framework of
an electronic‐based traceability system. British Food Journal 111 (6‐7): 565‐82.
De Souza Monteiro, D. M., Caswell, J. A. (2004). The Economics of Implementing Traceability in Beef Supply
Chains: Trends in Major Producing and Trading Countries. Paper presented at the Northeastern Agricultural
and Resource Economics Association (NAREA) Annual Conference, 20 ‐ 23 June 2004, Halifax, Canada, pp.
32.
ECR Europe. (2004). L’impiego della rintracciabilità all’interno della supply chain al fine di soddisfare le
aspettative del consumatore in materia di sicurezza, March 2004, pp. 82.
European Commission. (2002). Regulation (EC) No 178/2002 of the European Parliament and of the Council of
28 January 2002 laying down the general principles and requirements of food law, establishing the
European Food Safety Authority and laying down procedures in matters of food safety.
Folinas, D., Manikas, I., Manos, B. (2006). Traceability data management for food chains. British Food Journal 108 (8): 622‐33.
FSA. (2002). Traceability in the food chain ‐ a preliminary study.
Gellynck, X., Januszewska, R., Verbeke, W., Viaene, J. (2007). Firm’s costs of traceability confronted with
consumer requirements. In Theuvsen, L., Spiller, A., Peupert, M. and Jahn, G. (ed.), Quality management in
food chains. Wageningen Academic Publishers, pp. 45‐56.
Golan, E., Krissoff, B., Kuchler, F., Calvin, L., Nelson, K., Price, G. (2004). Traceability in the U.S. food supply:
economic theory and industry studies Agricultural Economic Reports. United States Department of
Agriculture, Economic Research Service, Washington, United States, pp. 48.
Golan, E., Krissoff, B., Kuchler, F. F., Nelson, K., Price, G., Kelvin, L. (2003).Traceability in the US food supply
chain: dead end or superhighway? Choices: 17‐20.
Hobbs, J. E. (2004). Traceability in the Canadian Red Meat Sector. Agriculture and Agrifood Canada pp. 58.
Mejia, C., Mentire, J., Keener, K., Muth, M. K., Nganje, W., Stinson, S., Jensen, H. (2010). Traceability (Product
Tracing) in Food Systems: An IFT Report Submitted to the FDA, Volume 1: Technical Aspects and
Recommendations. Comprehensive Reviews in Food Science and Food Safety 9 (1): 92‐158.
Mejia, C., Mentire, J., Keener, K., Muth, M. K., Nganje, W., Stinson, T., Jensen, H. (2010). Traceability (Product
Tracing) in Food Systems: An IFT Report Submitted to the FDA, Volume 2: Cost Considerations and
Implications. Comprehensive Reviews in Food Science and Food Safety 9 (1): 159‐75.
Meuwissen, M. P. M., Velthuis, A. G. J., Hogeveen, H., Huirne, R. B. M. (2003). Traceability and certification in
meat supply chain. Agribusiness 21 (2): 167‐81.
Mora, C., Menozzi, D. (2003). Traceability costs components for meat. Paper presented at the Quality
assurance, risk management and environmental control in agriculture and food supply networks:
Proceedings of the 82nd Seminar of the European Association of Agricultural Economists (EAAE), 14 ‐ 16
May 2003, Bonn, Germany, pp. 6.
Mora, C., Menozzi, D. (2005). Vertical contractual relations in the Italian beef supply chain. Agribusiness 21 (2):
213‐35.
Pouliot, S. (2008). Estimating the Costs and Benefits of Cattle Traceability: the Case of the Quebec Cattle
Traceability System. Paper presented at the AAEA Annual Meeting Orlando, 27 ‐ 29 July 2008, Orlando,
United States, pp. 26.
Sodano, V., Verneau, F. (2003). Traceability and food safety: public choice and private incentives policy makers.
Paper presented at the Quality assurance, risk management and environmental control in agriculture and
food supply networks: Proceedings of the 82nd Seminar of the European Association of Agricultural
Economists (EAAE), 14 ‐ 16 May 2003, Bonn, Germany, p. 8.
Stuller, Z. J., Rickard, B. J. (2008). Examining Traceability Adoption among Specialty Crop Producers in California.
In Paggi, M. S., Yamazaki, F., Pouliot, S., Sumner, D. A., Stuller, Z. J. and Rickard, B. J. (ed.), Traceability for
Food Marketing and Safety. Fresno California Agricultural Technology Institute, California State University,
pp. 16.
Theuvsen, L., Hollman‐Hespos, T. (2005). The economics of traceability: a model of investments in tracking and
tracing system in agriculture and the food industry. Paper presented at the EFITA/WCCA Joint Congress on
it Agriculture, 25 ‐ 28 July 2005, Vila Real, Portugal, pp. 914‐21.
Verbeke, W. (2001). The emerging role of traceability and information in demand‐oriented livestock
production. Outlook on Agriculture 30 (4): 249‐55.
Verdenius, F. (2006). Using Traceability Systems to Optimise Business Performance. In Smith, I. and Furness, T.
(ed.), Improving Traceability in Food Processing and Distribution. Cambridge. Woodhead Publishing, pp. 26‐
Appendix
Table A1.
Regression results for specific expected and actual benefits
DEPENDENT VARIABLE Adj.
R2
F‐VALUE
INDEPENDENT VARIABLES
FIRM SIZE OPERATION
COMPLEXITY
COMPLEX.
CUSTOMER
REQUIR.
NUMBER QMS
ADOPTED
EXP.“Meeting regulatory
requirements” ‐0,028 0,619 0,196 ‐0,051 ‐0,096 ‐0,026 ACT.“Meeting regulatory
requirements” ‐0,038 0,498 0,149 ‐0,051 ‐0,130 ‐0,023 EXP.“Increasing consumer
trust” ‐0,028 0,623 0,044 ‐0,116 0,182 ‐0,017 ACT. “Increasing consumer
trust” ‐0,027 0,640 ‐0,117 0,050 0,149 0,097
EXP.“Customer's requirements
and trust” ‐0,043 0,420 ‐0.064 0,172 ‐0,042 0,030 ACT. “Customer's
requirements and trust” ‐0,055 0,277 0,135 ‐0,005 0,036 ‐0,070 EXP. “Increasing market share,
accessing new markets or obtaining a price premium”
0,065 1,970 ‐0,306 0,071 ‐0,171 0,170
ACT. “Increasing market share, accessing new markets or obtaining a price premium”
0,098 2,486* ‐0,353** 0,257* ‐0,110 0,184
EXP. “Reducing complaints,
recalls, liability” ‐0,036 0,511 ‐0,038 ‐0,021 0,175 ‐0,112 ACT. “Reducing complaints,
recalls, liability” ‐0,074 0,055 ‐0,041 0,037 0,036 0,026 EXP.“Improving management
within and data management” ‐0,062 0,180 0,063 ‐0,068 0,052 ‐0,077 ACT. “Improving management
within and data management” ‐0,050 0,351 0,114 ‐0,020 ‐0,125 0,023 EXP. “Improving supply chain
management” ‐0,075 0,027 ‐0,038 0,913 0,010 0,025 ACT. “Improving supply chain
Table A2.
Regression results for specific expected and actual costs
DEPENDENT VARIABLE ADJ.
R2 F‐VALUE
INDEPENDENT VARIABLES
FIRM SIZE OPERATION
COMPLEXTY
COMPLEX.
CUSTOMER
REQUIR.
NUMBER QMS
ADOPTED
EXP. “Purchase new equipment
and software” 0,061 1,921 0,188 0,218 0,112 0,070 ACT. “Purchase new equipment
and software” 0,030 1,428 0,263* ‐0,003 0,179 ‐0,027 EXP.“Certification, audit,
consultants” 0,016 1,235 ‐0,251* ‐0,046 ‐0,001 0,148 ACT. “Certification, audit,
consultants” 0,068 2,025 ‐0,287** ‐0,035 ‐0,047 0,253** EXP. “Production line,
supervisory staff and managerial administrative time”
0,041 1,609 0,005 ‐0,228* 0,015 ‐0,230*
ACT. “Production line, supervisory staff and managerial
administrative time”
0,029 1,425 0,052 ‐0,281** ‐0,032 ‐0,149
EXP. “Training course” 0,030 1,441 ‐0,232* ‐0,097 ‐0,138 ‐0.031 ACT. “Training course” ‐0,004 0,945 ‐0,191 ‐0,089 0,070 0,102 EXP.“Materials” ‐0,024 0,662 0,002 ‐0,096 0,022 ‐0,194 ACT.“Materials” ‐0,038 0,484 ‐0,053 0,013 0,047 ‐0,180