Engineering and Applied Sciences
2019; 4(4): 74-78http://www.sciencepublishinggroup.com/j/eas doi: 10.11648/j.eas.20190404.11
ISSN: 2575-2022 (Print); ISSN: 2575-1468 (Online)
An Algorithm to Determine the Extent of an Epidemic
Spread: A NetLogo Modeling Approach
Jerry John Kponyo
1, Kenneth Coker
1, Justice Owusu Agyemang
1, Joyce Der
2, 31Department of Electrical Engineering, College of Engineering, Kwame Nkrumah University of Science and Technology, Kumasi, Ghana 2
School of Public Health, University of Health and Allied Sciences, Ho, Ghana
3London School of Hygiene and Tropical Medicine, London, United Kingdom
Email address:
To cite this article:
Jerry John Kponyo, Kenneth Coker, Justice Owusu Agyemang, Joyce Der. An Algorithm to Determine the Extent of an Epidemic Spread: A NetLogo Modeling Approach. Engineering and Applied Sciences. Vol. 4, No. 4, 2019, pp. 74-78. doi: 10.11648/j.eas.20190404.11
Received: January 11, 2019; Accepted: August 7, 2019; Published: August 23, 2019
Abstract:
The outbreaks of infectious diseases have had a huge impact on the human society. Researchers have developed models aimed at understanding how various infectious diseases spread in communities and also proposed control measures that can minimize or stop the spread of the diseases. Most researchers have developed stochastic mathematical models which are used in predicting the occurrence of an epidemic. Most of the proposed models do not employ the use of system dynamics hence making it difficult to adopt the same model in predicting the behavior of other epidemic diseases. This research work focuses on the use of system dynamics in predicting the extent of an epidemic spread so that effective preventive and quarantine measures can be put in place to curb that epidemic. The SIR model forms the basis of the model. The model was developed in NetLogo. Disease parameters and environmental conditions play a role in the spread of an epidemic. Due to this the parameters used in the model included initial population, infectiousness, fatality rate, days to recover, hygiene, vaccination, travel-openings and the number of doctors within the community. The efficiency of the developed model was tested using data from two disease outbreaks: Ebola and Influenza. The model proved itself to be efficient in predicting the infected and death cases which were very close to the real-life data.Keywords:
NetLogo, SIR, Epidemic, Influenza, Ebola1. Introduction
The outbreak of an infectious diseases tends to have a huge impact on the society all through history. In the 14th century, the black plague killed between 30-50% of Europe’s population. In the year 1720, a plague epidemic decimated almost half of the population of Marseille and one-fourth of the population of Provence. In 1918-1919, the Spanish flu killed between 50-100 million humans (about 3-5% of human population). Smallpox had existed for more than 3000 years, killing many millions of people, before it was eradicated after a long and intense vaccination effort lead by WHO. Recently, some of the diseases causing most harm (casualties, suffering and/or economically) to humans have been, HIV, influenza, foot and mouth disease, malaria and measles, and other diseases have caused unexpected dramatic outbreaks with
high mortality rate (eg. SARS and Ebola) [1].
A paramount goal for public health is to increase understanding of how various infectious diseases spread within communities, with the goal of minimizing or even stopping the spread through various control measures (vaccination, quarantine, isolation etc). This has caused researchers to develop models that can help us understand how some of these infectious diseases behave in order for appropriate measures to be put in place to curb these diseases.
75 Jerry John Kponyo et al.: An Algorithm
2. Review of Related Works
Many diseases have been found to be endemic regular oscillatory levels of incidence in large
An algorithm based on the median ball developed with the aim of predicting recovery rate of a virus that causes an epidemic noisy and incomplete data [6].
A standard regression analysis based on maximum prevalence of a pandemic wave, amplitude and duration, has been used epidemic model that provides a real forecasting for pandemic influenza [7].
Serfling used regression analysis to thresholds from weekly pneumonia and influenza 108 US cities [8]. This method has been adapted reported caseloads in France during the late fixed thresholds have been used to increases as a predictor of national epidemics
A kriging method has also been applied effects in France [11] as has the method of Others have used time-series analysis based epidemic data to define epidemic thresholds a semi-quantitative method based on a predefined threshold [14]. A linear regression model, cumulative cases at the steepest ascent of the has also been used to predict weekly incidence
Mills et al. [16] recently considered the transmission 1918 influenza pandemic and estimated
reproduction number of 2-3 by linearizing Wallinga & Tuenis [17] developed a real-time for SARS which requires detailed information and does not delete the susceptible
Manli et al. [18] proposed a stochastic model with seasonal variation and saturated researchers developed a mathematical model threshold of the stochastic system which determines an epidemic occurs or not.
3. Methodology
The proposed model considers environmental disease parameters which affect epidemic environmental conditions are affected by number of doctors in the community, travel hygienic condition of the community, absence of vaccination and whether there not. Disease parameters such as the infection how fast the disease is contracted, the fatality the rate at which the disease kills and the recovery also included since 100% of those who come epidemic do not die. Finally, the model consideration the days-to-recover from the
The proposed algorithm is based on the model shown in Figure 1. The ‘S’ indicates that is those who are exposed and can be disease causing the epidemic, the ‘I’ indicates
Algorithm to Determine the Extent of an Epidemic Spread: A NetLogo
endemic and exhibit large population [2-5]. ball principle was the infected and epidemic using highly
on the timing of the wave, along with its used to develop an real-time epidemic
derive epidemic influenza deaths for adapted to look at late 1980s [9], and consider regional epidemics [10].
applied to study spatial of analogues [12]. based on previous thresholds [13], or applied predefined epidemic model, applied to the epidemic curve incidence [15].
transmission of the estimated an effective linearizing an SEIR model. time prediction tool epidemiological susceptible population. stochastic SIR epidemic
saturated incidence. The model to obtain the determines whether
environmental factors and epidemic spread. The initial population, travel openings, the the presence or there is medication or infection rate that tells fatality rate that shows recovery rate were come down with an model also takes into
epidemic.
SIR compartment indicates the Susceptible, be infected by the indicates the Infected,
that is those who have been infected spread it to the susceptible Recovered, that is those who immune to the epidemic. The values so they sum up to 1. individuals leave the susceptible infected and individuals also leave join the recovered.
Figure 1. The SIR compartment
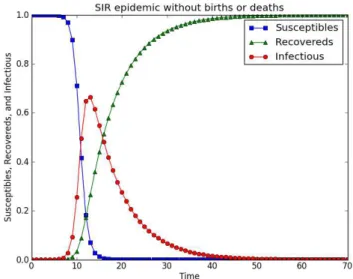
The relationship between the in Figure 2.
Figure 2. Relationship between
The graph shows clearly at the various compartments are dependent susceptible group begins with decreasing at a rate equal to the group also starts decreasing at rate and the decrease translates compartment.
The entire modeling was done completed in three phases. There simple model was set up. parameters were then included realistic. Further work was done mimic inter-epidemic spreads. The
NetLogo Modeling Approach
infected by the disease and can and the ‘R’ indicates the who have been treated and are The SIR values are probability 1. Based on the SIR theory, susceptible group only to join the leave the infected group only to
compartment model.
the SIR compartments is shown
between the SIR compartments.
the interception points that the dependent on each other. The a probability of 1 and starts the infection rate. The infected at a rate equal to the recovery translates to an increase in the recovery
Engineering and App
last person in contact with the epidemic sliders was employed to select parameters particular epidemic easier. The model is implemented phases and the user interface was made as
possible.
3.1. Phase 1
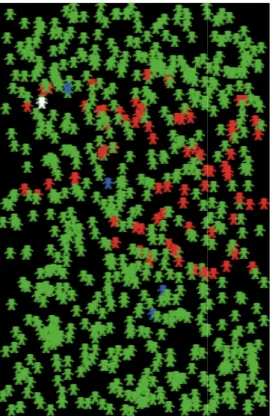
A simple dynamics model was developed catch the epidemic, spread it to others and contained less data. It was used as a case how the final model will look like. Figure NetLogo interface illustrating the infected and
Figure 3. NetLogo interface for Phase
NetLogo is an agent-based modeling individuals that make up the population are “turtles” in the model. The turtles in red represent the disease, the turtles in blue represent the turtles in green are the susceptible and prone disease.
3.2. Phase 2
This was the stage of the model where inclusion of environmental conditions and disease to make it mimic real-life situations. The conditions included were: initial population, doctors, travel openings, the hygienic conditions environment, medication and vaccination. parameters included were: infection rate, recovery rate and the days-to-recover from has already been explained the model is compartment model that has been explained
Engineering and Applied Sciences 2019; 4(4): 74-78
died. The use of parameters to suite a implemented in three as user friendly as
developed where people and die. This stage case study to project Figure 3 shows the and the susceptible.
Phase 1.
tool and as such are represented as represent those with the healthy and the prone to catching the
where there was an disease parameters The environmental population, number of conditions of the vaccination. The disease rate, fatality rate, from the disease. As based on the SIR explained in Figure 1 and
Figure 2. The NetLogo interface environmental and disease parameters and Figure 5.
Figure 4. NetLogo interface showing
Figure 5. NetLogo interface showing
3.3. Phase 3
In this phase of the model, travel to make the model mimic inter noted that those who come down be static and also there is random affects the spread and length of the NetLogo interface demonstrating
Figure 6. NetLogo interface showing
4. Results and Discussion
Information about the outbreak Liberia from March 2014 to June Economist, a Graphic blog and obtained from the model with the performance of the model. Table
76
interface that shows the output of the parameters are shown in Figure 4
environmental condition parameters.
showing disease parameters.
travel openings were included inter-epidemic spread. It must be down with the disease seem not to random human movement which of an epidemic. Figure 6 shows demonstrating the travel openings.
showing the travel openings.
Discussion
77 Jerry John Kponyo et al.: An Algorithm to Determine the Extent of an Epidemic Spread: A NetLogo Modeling Approach
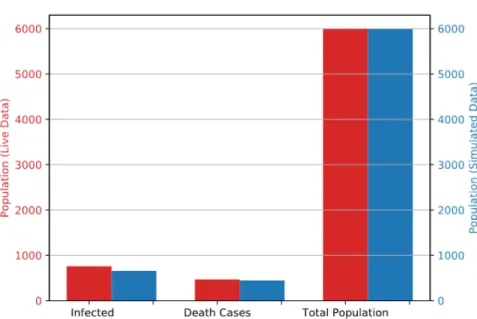
between the live and the simulated data. The information in Table 1 is graphically represented in Figure 7. It is obvious from the figure that the simulated results almost coincide with the results of the model. The model was further tested with results from the spread of influenza in a small town somewhere in Columbia by the Center for Disease Control and Prevention. The spread was studied for 42 weeks. The
respective parameters were used to run a simulation with the model and the results were compared with that of the real-life data. Table 2 shows the comparison between the data obtained from the simulation and that from real-life situation for a population of 10, 837. Figure 8 also shows a graph of the comparison from the spread of the Influenza using Table 2.
Figure 7. Graph showing the comparison of live and simulated data for Ebola.
Figure 8. Graph showing the comparison of live and simulated data for Influenza.
Table 1. Comparison Between Live and Simulated Data for Ebola.
EBOLA INFECTED DEATH CASES
LIVE DATA 759 467
SIMULATED DATA 657 446
Table 2. Comparison Between Live and Simulated Data for Ebola.
INFLUENZA INFECTED DEATH CASES
LIVE DATA 2605 2319
SIMULATED DATA 2811 2430
5. Conclusion and Recommendation
Engineering and Applied Sciences 2019; 4(4): 74-78 78
will explore machine learning techniques that can be used to forecast the extent of an epidemic spread.
Acknowledgements
The authors acknowledge the College of Engineering, specifically, the department of Electrical and Electronic Engineering of the Kwame Nkrumah University of Science and Technology (KNUST), Kumasi-Ghana.
References
[1] Tom Britton, Etienne Pardoux, “Stochastic epidemics on homogenous community”, arXiv: 1808.05350v1 [math.PR], pg. 5, August 2018.
[2] Z. Bai and Y. Zhou, “Existence of two periodic solutions for a non-autonomous SIR epidemic model”, Appl. Math. Model. 35 (2011), pp. 382–391.
[3] D. J. Earn, P. Rohani, B. M. Bolker, and B. T. Grenfell, A simple model for complex dynamical transitions in epidemics, Science 287 (2000), pp. 667–670.
[4] D. Greenhalgh and I. A. Moneim, SIRS epidemic model and simulations using different types of seasonal contact rate, Syst. Anal. Model. Simul. 43 (2003), pp. 573–600.
[5] J. Ma and Z. Ma, Epidemic threshold conditions for seasonally forced SEIR models, Math. Biosci. Eng. 3 (2006), pp. 161–172.
[6] C. Milling, C. Caramanis, S. Mannor, “Detecting epidemics using highly noisy data: Identifying the causative network of an epidemic”, 2012.
[7] M. Hall, R. Gani, H. E. Hughes, S. Leach, “Real-time epidemic forecasting for pandemic influenza”, Epidemol. Infect. (2007), 135, 372-385.
[8] Serfling RE, “Methods for current statistical analysis of excess pnuemonia-influenza deaths”. Public Health Reports 1963; 78: 494–506.
[9] Costagliola D, et al. “A routine tool for detection and assessment of epidemics of influenza-like-illness”, American Journal of Public Health 1991; 81: 97–99.
[10] Toubiana L, Flahault A. A space-time criterion for early detection of epidemics of influenza-like-illness. European Journal of Epidemiology 1998; 14: 465–470.
[11] Carrat F, Valleron AJ, “Epidemiologic mapping using the kriging method: application to an influenza-like illness epidemic in France”. American Journal of Epidemiology 1992; 135: 1293–1300.
[12] Viboud C, et al. “Prediction of the spread of influenza epidemics by the method of analogues”. American Journal of Epidemiology 2003; 158: 996–1006.
[13] Quenel P, Dab W. “Influenza A and B epidemic criteria based on time-series analysis of health services surveillance data”. European Journal of Epidemiology 1998; 14: 275–285. [14] Hashimoto S, et al. “Detection of epidemics in their early
stage through infectious disease surveillance”. International Journal of Epidemiology 2000; 29: 905-910.
[15] Mooney J, Wright E, Christie P. “Predictive modelling of influenza outbreaks: a linear regression analysis”. SCIEH Weekly Report 2001; 35: 134–135.
[16] Mills CE, Robins JM, Lipsitch M. Transmissibility of 1918 pandemic influenza. Nature 2004; 432: 904-906.