http://www.sciencepublishinggroup.com/j/ajmcm doi: 10.11648/j.ajmcm.20190401.13
ISSN: 2578-8272 (Print); ISSN: 2578-8280 (Online)
A Numerical Analysis of Basis Function on Population
Growth Using Gompertz Approach
Ayinde Samuel Olukayode
Department of Mathematics, Faculty of Science, Ekiti State University, Ado Ekiti, Nigeria
Email address:
To cite this article:
Ayinde Samuel Olukayode. A Numerical Analysis of Basis Function on Population Growth Using Gompertz Approach. American Journal of Mathematical and Computer Modelling. Vol. 4, No. 1, 2019, pp. 21-26. doi: 10.11648/j.ajmcm.20190401.13
Received: April 8, 2019; Accepted: May 23, 2019; Published: June 5, 2019
Abstract:
Population growth rate is a factor in determining how great a burden would be imposed on a country by the changing needs of its people for infrastructure. This average annual percentage change in population is as a result of either a surplus or deficit of births rate over deaths rate and the balance of migrants entering or emigrants leaving the country. This rate may either be positive or negative. This rate is the basis used by countries for national planning and projections. Management and Control of population growth has become a singular most important national concern due to dwindling Economic fortunes and competition for essential resources. Gompertz function has always been of interest and being used by Actuaries and Demographers when analyzing population growth. In this research, an interpolating function was proposed following Gompertz function approach and a Numerical scheme was developed to solve a population growth problem. The new scheme has been tested and found to be numerically stable and convergent. The scheme is also found to be effective as the numerical solution is nearly the same as that of the analytic solution of the problem. The method is also used to predict the future population growth in Nigeria.Keywords:
Gompertz Function, Mathematical Method, Population Growth, Carrying Capacity, Basis Function, Mortality Rate, Global Fertility1. Introduction
Nigeria, an African country on the Gulf of Guinea, has many natural landmarks and wildlife reserves. Protected areas such as Cross River National Park and Yankari National Park have waterfalls, dense rainforest, savanna and rare primate habitats. One of the most recognizable sites is Zuma Rock, a 725m-tall monolith outside the capital of Abuja that’s pictured on the national currency. [1]
Total population of Nigeria is estimated to be consistent with the 1963, 1991 and 2006 censuses, adjusted for under enumeration, with the age and sex structure from the 2011 MICS4 survey, and with estimates of the subsequent the trends in fertility, mortality and international migration. (National Bureau of Statistics), [2].
The average annual percent change in the population, resulting from a surplus (or deficit) of births over deaths and the balance of migrants entering and leaving a country. The rate may be positive or negative. The growth rate is a factor in determining how great a burden would be imposed on a
country by the changing needs of its people for infrastructure (e.g., schools, hospitals, housing, roads), resources (e.g., food, water, electricity), and jobs. Rapid population growth can be seen as threatening by neighboring countries. (CIA World Factbook) [3].
In the twentieth century, modernization and
technological expansion allowed societies to gain control of the ailments that previously killed large percentages of the population. Suddenly, societies were equipped to overcome famine, malnutrition, and other life threatening diseases. Rapid technological advances in modern medicine and sanitation drastically reduced global mortality rates. Increased technology also improved
labour productivity. This combination of both
technological and medical improvements set the
Currently, global fertility rates far outweigh mortality rates, forcing the world to confront serious population growth issues. With almost 7 billion people, the world population is placing a huge strain on natural resources. [4-5]. Unfortunately, the projections for the future do not appear to be improving. At a population growth rate of 2.8 percent per annum between 1952 and 1991, Nigeria is one of the fastest growing countries in the world. Nigeria is the most populous country in Africa, and accounts for one in five of Sub-Sahara’s people. [3]. By 2013, the population forecast for Nigeria is 169.7 million. However, the composition of this population is mainly in the youthful category with 49% below the age of 21 years and a dependency ratio estimated at 89%. A large proportion of this population favours and is living in the rapidly expanding urban areas, presently estimated at over 45.2% and will likely hit 55.4% mark by the year 2015, [3]. Therefore, population growth will have a positive effect on the economic growth. [2, 6].
2. Population Growth Effects
Eli et al. [7] declared and pointed out that Prof Kuznets, [8] in his study of Modern Economic Growth, substantial rates of population growth have led to high rates of increase in total product and per capital product. The growth of total product and per capital product has been accompanied by the growth of national product, in turn, has been due to the enormous addition to population which has led to large increase in working labour force. Population growth also leads to the growth of physical capital; it has been proven recently that the growth of physical capital stock depends to a considerable extent on human capital formation, which is the process of increasing knowledge, the skills, and the capacities of all people in the country [9].
High population growth can be a source of capital formation in underdeveloped countries. Nurske, [10] points out that underdeveloped countries suffer from disguised unemployment on a mass scale. Thus labour force can be put to work on capital projects like irrigation, drainage, roads, railways, houses etc. Lewis suggests that economic development takes place when capital accumulates with the withdrawal of surplus labour from the rural sector and its employment in the industrial sector. Population growth also leads to age of high mass consumption.
Rostow, [11] has shown in his stages of Economic growth that during the “take- off stage” when the growth rate of population was high, the rate of net investment rose by 5-10 percent of national income. This led to the development of “leading sectors” due to the increase in the effective demand for their products. This paved the way for the age of high mass consumption through which almost all developing countries are passing. [9]
However, the effect of population growth on per capital incomes is unfavourable. The growth in population tends to retard per capital income in three ways; it increases the pressure of population on land, it leads to rise in cost of consumption goods because of the scarcity of the co-operant
factors to increase their supplies, it leads to a decline in the accumulation of capital because with increase in family members, expenses increase. This is in addition to the adverse effect that population growth has on standard of living, employment, capital formation, environment, social infrastructure, and agricultural development [12].
Todaro and Smith, (2006) [13] asserted that according to the latest empirical research, the potential negative
consequences of population growth for economic
development can be divided into seven categories: its impact on economic growth, poverty and inequality, education, health, food, the environment, and international migration.
Therefore, an basis Function will be developed through which Numerical Method is obtained. The efficacy of this method obtained had been tested to solve test equation and some selected Ordinary Differential Equations. [14], also tested to solve Tumour Growth problem. [15], and Fish Lake problem, [16].
3. Methodology
3.1. Interpolating Function
Some phenomena in the field of physical and management sciences can be modeled in the form of different equations, as well as economic problems. The solutions to most differential equations of this type got solutions through the approximate solutions that are generated by means of numerical techniques via the formulation of Basis Function. [17]
Therefore, let us assume that the theoretical solution ( ) to the initial value problem
= ( , ), ( ) = (1) can be represented in the interval [ , ], ≥ 0 by the non-polynomial basis function:
( , ) = [ + + ] (2) Where , , are real undetermined coefficients,
! " are the shapes and scale parameters, K represent the saturation level using Gompertz approach. The intervals defined are ∈ [0,1] and % ∈ (0,1]. Gompertz equation or function is a sigmoid function developed by the Jewish Mathematician, Benjamin Gompertz in 1938, used to describe the growth in cells of animate or in-animates. The important conclusion of Gompertz was that the force of mortality (practically the same as the rate of mortality) increased in geometric progression with age. The actual Gompertz equation as proposed by [18] is
= &'()*+
(3)
where =,- is the point of inflection, ! ! " . in (3) compared with ! " in (2) are the same.
Theorem 1
Let ( , ) be defined and continuous on R given by
/0 = [!, .] 1 { / 4≤ 6 < ∞} and in addition, satisfy
value problem (1) has a unique solution in R. Proof
The prove to this theorem can be found in Henrici (1962). [19]
We shall assume is a numerical estimate to the theoretical solution ( ) and = ( , ), and define mesh points as follows:
= ! + ℎ, = ! + ( + 1)ℎ, = 0, 1, 2, (4) Imposing the following constraints on the basis function (2) in order to get the undetermined coefficients, However, the basis function must coincide with the theoretical solution at = ! " = . Hence it is required that (2) can be written in the form
( , ) = ( ?+ ?+ ) (5)
and
( , ) = ( ?@A+ ?@A+ ) (6)
3.2. Derivation of the Numerical Method
The derivatives of the basis function (2) are required to coincide with the differential equation as well as its first, second, and third derivatives with respect to !B =
Denote the i-th total derivatives of ( , ) with respect to with (C) such that
( ) = , ( ) = , ( ) = (7) This implies that,
= % ?+ % ?D E − % F (8)
= % ?+ % ?(D E ) − % (9)
= % ?+ % ?(D E ) + % F (10)
3.3.... Forming System of Equation
To obtain values for , , ! " from the system (8) to (10),
G
? ?D E − F
? ?(D E ) − ? ?(D E ) F
H I J = G H (11)
Taking this as a system of equations,
=
K?(LMN O)PQC ? (LMN O)RSMQ ?&(LMNO)TK?AQC ? K?PSMQ ?U &QC ?(K?A(LMNO)R&K?P(LMNO)P)
V 'W+?((LMNO)PQC ? (LMNO)RSMQ ?)&VLMNO'W+?( PQC ? RSMQ ?) &VQC ?'W+?( P(LMNO)R& R(LMNO)P))
(12)
= TK?AQC ? K?PSMQ ?U&K?( PQC ? RSMQ ?)&QC ?( PK?P& RK?A) V O+?((LMNO)PQC ? (LMNO)RSMQ ?)&VO+? LMNO( PQC ? RSMQ ?)
&VO+?QC ? ( P(LMNO)R& R(LMNO)P))
(13)
= TLMNOPK?P&LMNORK?AU&LMNO T PK?P& RK?AU K? ( PLMNOR& RLMNOP) V O+?((LMNO)PQC ? (LMNO)RSMQ ?)&VO+? LMNO( PQC ? RSMQ ?)
&VO+?QC ? ( P(LMNO)R& R(LMNO)P))
(14)
Since
( ) = ( ) and ( ) = ( ) Taken,
( ) = and ( ) = (15)
( ) − ( ) = − (16) Therefore, we have from (5), (6) into (16)
− = X ?@A− ?Y + [ ?@A− ?] + [ − ] (17)
Recall that
= ! + ℎ, = ! + ( + 1)ℎ with = 0,1,2 … (18) Therefore, by expansion of (17), using (18), obtained
3.4. The Numerical Method
Equation (19) can be written as
= + \ + ] + /
Where
\ = ?( [−1
] : ? [: 1
/ = : ^ (20) Substituting for , , and in (20),
\ ] / (21)
where
\ [: 1 D E D E: D E : D E: D E : D E D E D EF F D E D E: D E: D E
] D E : D E : D E[: 1 : : D E FF : D E : D E
/ D E= : : D E : D E D E : D E : D E : D E D E F D E : D ED E D E
Equation (21) is the new numerical method for solution of the first order differential equation. This numerical method has been tested on some initial value problems of first order differential equations [14].
4. Applications
4.1. Problem: Nigeria Population Growth and Forecasting
The Gompertz model for population growth is described through the ODE
_`
_a :bcD d
`
ef ; c 0 c (22)
(i) Using the model (22) to find the Nigeria population growth, estimate numbers for each year from 1965 to 2017, and
(ii) Forecast the population from the year 2020 to 2050.
4.2. Solution
(i) Nigeria population and estimates of each year from 1965 to 2017. (Source: Elaboration of data by United Nations, Department of Economic and Social Affairs, Population Division, (www.Worldometers.info). [20 – 21]
Source: picture taking using camera.
Figure 1. Population Census. People awaiting.
1965 ≤ ≤ 2017, The analytical solution of equation (22) above is
c(B) = % d`l ef
')mn
, c = 50238569, % = 191835936,b = 0.0063. (23)
h = 5.0, B = 2.3211, = 0.8235
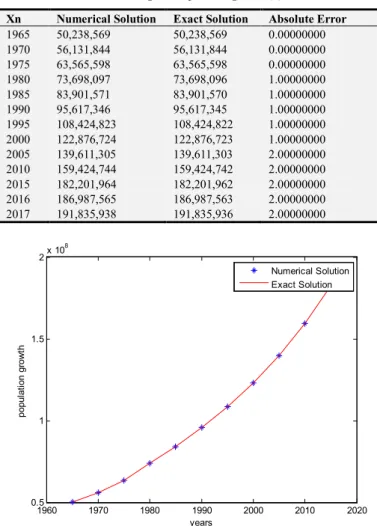
Table 1. Nigeria Population growth (A).
Xn Numerical Solution Exact Solution Absolute Error
1965 50,238,569 50,238,569 0.00000000 1970 56,131,844 56,131,844 0.00000000 1975 63,565,598 63,565,598 0.00000000 1980 73,698,097 73,698,096 1.00000000 1985 83,901,571 83,901,570 1.00000000 1990 95,617,346 95,617,345 1.00000000 1995 108,424,823 108,424,822 1.00000000 2000 122,876,724 122,876,723 1.00000000 2005 139,611,305 139,611,303 2.00000000 2010 159,424,744 159,424,742 2.00000000 2015 182,201,964 182,201,962 2.00000000 2016 186,987,565 186,987,563 2.00000000 2017 191,835,938 191,835,936 2.00000000
Figure 2. The graph of the Numerical and Exact solution of c (B) = − b ∗
c ∗ D d`ef.
Nigeria population growth from 1965 to 2017 (ii) Nigeria Population forecast from 2010 to 2050
Using Numerical Method (21) to solve the initial value problem (22) in the interval
2010 ≤ ≤ 2050, forecasting the population growth from 2010 to 2050.
h = 5.0, B = 2.3211, = 0.9457
Table 2. Nigeria Population growth (B).
Xn Numerical Solution Exact Solution Absolute Error
2010 159,424,742 159,424,742 0.00000000 2015 182,201,962 182,201,962 0.00000000 2020 206,830,983 206,830,983 0.00000000 2025 233,557,691 233,557,691 0.00000000 2030 262,599,107 262,599,107 0.00000000 2035 293,965,225 293,965,225 0.00000000 2040 327,405,604 327,405,603 1.00000000 2045 362,395,942 362,395,941 1.00000000 2050 398,507,705 398,507,704 1.00000000
Figure 3. The graph of Forecasting the Nigeria population growth from 2010 to 2050.
The graphs shown in figure 2 and 3 are an indication that the Numerical Solutions and Exact Solutions are nearly the same, indicating the Numerical Method is appropriate and effective.
5. Conclusion
In conclusion, a new numerical method of a derived interpolating function using Gompertz Model approach was presented for solving population growth analysis and problems. The results obtained from the numerical solution compared with the exact solution is symbolic and significant. However, demographers in the past have been using the Gompertz model directly to solve growth problems, where in this research the numerical method approach is also computational reliable and stable. The results can be compared favourably with the common Country Assessment data of United Nations Systems in Nigeria.
References
[1] Yusufu, T. M. (2000) The Human Factor in National Development: Nigeria. First Editon. Nigeria: University of Benin Press and Spectrum Books Limited Ibadan.
[2] Central Bank of Nigeria (2008) Statistical Bulletin: Golden Jubilee Edition.
[3] UNDP (2000) Human Development Report, Nigeria.
[4] Afzal, M. (2009). Population Growth and Economic Development in Pakistan. The Open Demography Journal, 2, 1-7. [5] Arthur L. W. (1954). Economic Development with Unlimited
Supplies of Labour. Wiley Online Library. The Manchester School. Vol. 22, Issue 2.
1960 1970 1980 1990 2000 2010 2020
0.5 1 1.5
2x 10
8 years p o p u la ti o n g ro w th Numerical Solution Exact Solution
2010 2015 2020 2025 2030 2035 2040 2045 2050 1.5
2 2.5 3 3.5
4x 10
[6] Elaboration of data by United Nations, Department of Economic and Social Affairs, Population Division.
[7] Eli H. T. et al. (2015). Impart of Population Growth on Economic Growth in Nigeria, 1980 – 2010, IOSR Journal of Humanities and Social Science. Vol. 20, Issue 4, pp 115–123. [8] Jhingan, M. L. (2005) The Economics of Development
Planning. 38th Edition. New Delhi: Vrinda Publications. [9] Kuznets S. S. (1963). Quantitative Aspects of the Economic
growth of Nations VIII: The Distribution of Income by size. Economic Development and Cultural Change, Vol. II, pp 1 & 92. Differential Equations. American Journal of Applied Mathematics and Statistics, USA. Vol. 3, No. 4, 156-160. [10] Nurkse, R (1961). Problems of Capital Formation in
Underdeveloped Countries. New York: Oxford University Press. Pp 163.
[11] Roston, W. W. (1962). The stages of Economic Growth. A Non-Communist Manifesto. Cambridge University Press. London. Pp 2,38,59.
[12] United Nations Systems in Nigeria (2001) Nigeria: Common Country Assessment.
[13] Todaro, M. and Smith, S. (2006) Economic Development. Ninth Edition. U. S. A. Pearson Publishing Company.
[14] Ayinde S. O., Ibijola E. A., (2015). A New Numerical Method for Solving First Order
[15] Ogunrinde R. B., Ayinde S. O. (2018). Interpolating and Gompertz Function Approach in Tumour Growth Analysis. Americal Journal of Mathematics and Statistics. 8(5), 119–125. [16] Samuel Olukayode Ayinde, Roseline Bosede Ogunrinde
(2018). Mathematical Integration for solving Biological Growth in Fish Lake Problem using Gompertz Approach. Biomedical Statistics and Informatics. 3(3), 43–48.
[17] Ogunrinde R. B. and Ayinde S. O. (2017). A Numerical Integration for Solving First Order Differential Equations using Gompertz Function Approach. American Journal of Computational and Applied Mathematics. 7(6): 143 – 148. [18] Winsor, C. P. (1932). “The Gompertz Curve as a Growth
Curve”. Proceedings of the National Academy of Sciences. Vol 18, No 1, 1-8.
[19] Henrici, P. (1962), Discrete Variable Methods in ODEs, New York: John Wiley & Sons.
[20] UNFPA (1999) The State of World Population 1999. UNFPA, New York.