realization associations between requirements and classes in the system design as well as dependencies between classes. The modeling process used semantic similarities between the requirements and the classes. A class is said to have a realization association with a requirement if and only if the semantic similarity is higher than a certain threshold. The output obtained from the dependent software development method was compared with the output produced by annotators. The method reliability was measured by the level of agreement between the method and the annotator using kappa statistical index. The preliminary result shows that the method was fair agreement (0.37) reliable as an annotator when generating requirements dependency graph.
Keywords⎯ class dependencies, requirements, requirements dependency graph, semantic similarity, threshold.
I.INTRODUCTION1
oftware requirements engineering is a series of activities includes eliciting, specifying, validating, and managing software requirements. Those activities produce a requirement specification document. It is an iterative and revolutionary process which occurs throughout the development process. Requirements change could happen during the development process. Requirements change statements may affect other requirement statements inevitably. There are several reasons why it is needed [1]. First, dependency requirement can be used to anticipate the impact of changes that occur if a requirement changes. Second, by knowing the impact of changes in a requirement to the other requirements, project manager could estimate the total cost due to the impact of a single requirement changes. Lastly, in the development of a requirement recommendation system, the developer can looks for other depending requirements given a predefined requirement. Interdependence requirements provide necessary information as how requirements dependencies affect activity in software engineering and how interdependence knowledge can facilitates software development.
This paper introduces a methodology to model the impact of requirement changes of a software project. The modelling process produces a requirements dependency graph which is built based on class dependency
1
Hernawati Samosir Informatics Department,
Institut Teknologi Del, Toba Samosir, Indonesia
2
Daniel O. Siahaan Informatics Department,
Institut Teknologi Sepuluh Nopember, Surabaya,
Indonesia
e-mail:
1[email protected],
2[email protected]
information extracted from class diagrams. The process of generating the model can be taken place after each iteration within a software development cycle. Classes in the class diagram, as a realization of previously defined software requirements, are mapped to a set of requirements from the respective software project. This mapping is based on class-requirement semantic similarity and dependencies between each class.
There are a number of studies related to the graph modeling dependencies [2]–[6]. Widiastuti and Siahaan (2008b) introduced the visualization of requirements dependency in Labeled Transition System for Requirement Change (LTS-RC). LTS-RC is a state transition system of requirement changes which is helpful to visualize the requirements dependency in term of transitions of changes in requirements. The labels represent a predefined weight of changes dependency between requirements. The visualization facilitates the stakeholders to observe the flow of requirements changes and their impact. This method can play a role in the preparation of an optimal need of change strategy [7].
Furthermore, Muller and Rumpe analysed software changes impact by using some changes in UML class diagrams [8]. This study models the impact of changes by using dependencies information between classes. If there is any change, the proposed model is expected to identify the object changed and also its impact. However, this study does not relate the change impact with the level of requirement. In addition, Wang and Wang investigated how the requirements dependencies correlate with software integration bugs and predict the bugs [9]. This study provides early estimation regarding
software quality and
facilitate decision making process early in the software lifecycle.
II.METHODOLOGY
This section explains the method to produce modelling requirement dependency. The steps of the methodology proposed are described as follows.
1. Prepare the requirement data and class diagrams, 2. Mapping the requirements and classes,
3. Generate the dependencies based on class dependencies,
4. Generate the requirement dependency model Figure 1 explains that SRS documents and class diagrams are inputs to the dataset. Two datasets element used are requirements statement and class information like class names, attributes and methods. The next step is pre-processing for both inputs. Furthermore, this process
generates two types of data, namely: text of requirement and text of class. Value of similarity of those texts is calculated. Furthermore, next process is mapping requirements and class to generate requirement dependency graph. The output of this process is requirement dependency graph.
The detail of those methods is described as follows: a) Prepare the requirements data and class diagrams.
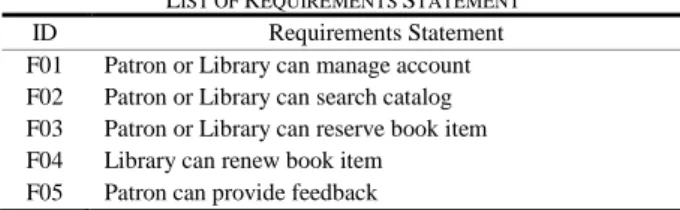
The Software Requirement Specification (SRS) is used to define the requirement data. This requirement data includes the requirement statement and class diagram. For the sake of illustration, a library system is used as an example. Table 1 lists the requirements of the library system. The first column is the requirements identity. The 'F' alphabet in the first character indicates that the respective requirements is a functional
requirement statement.
TABLE 1
LIST OF REQUIREMENTS STATEMENT ID Requirements Statement F01 Patron or Library can manage account F02 Patron or Library can search catalog F03 Patron or Library can reserve book item F04 Library can renew book item
F05 Patron can provide feedback
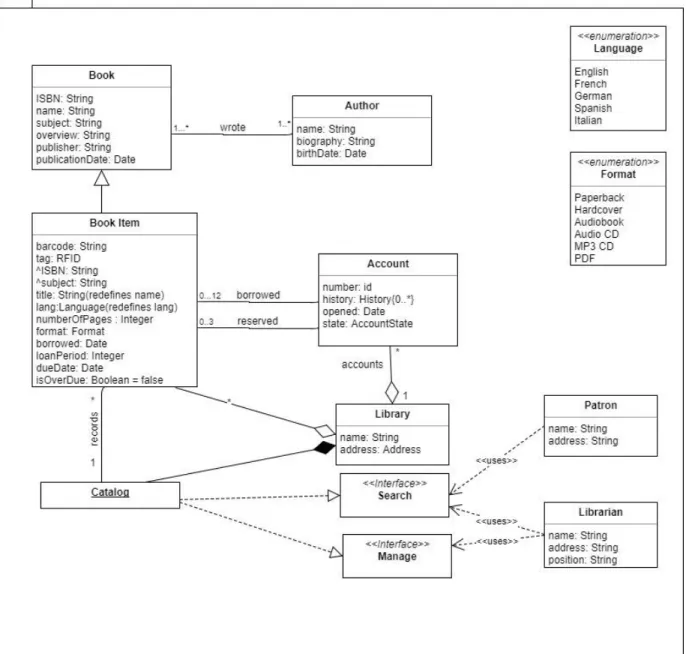
Figure 1 shows the classes that become part of the requirement list. The library system has 10 classes and 2 interface classes. There are Book, Author, Book Item, Account, Library, Catalog, Patron, Librarian, Account, and Library. The interface classes are Search and Manage.
The next step is mapping each functionality to a class in the class diagram. The mapping of each class in class diagram is shown in Table 2. Each requirements statement and class are pre-processed. Pre-processing aims to convert the text input of the requirement statement and text of the class diagram information into current format for the further analysis. The pre-processing includes cleaning process to remove the noise [10]. In the general process, the text must be proceeded
first. Unnecessary elements in the text such as: symbols, punctuation, spaces, conjunctures and affixes is needed to be omitted. This process will help in processing and analysing the text for the next process.
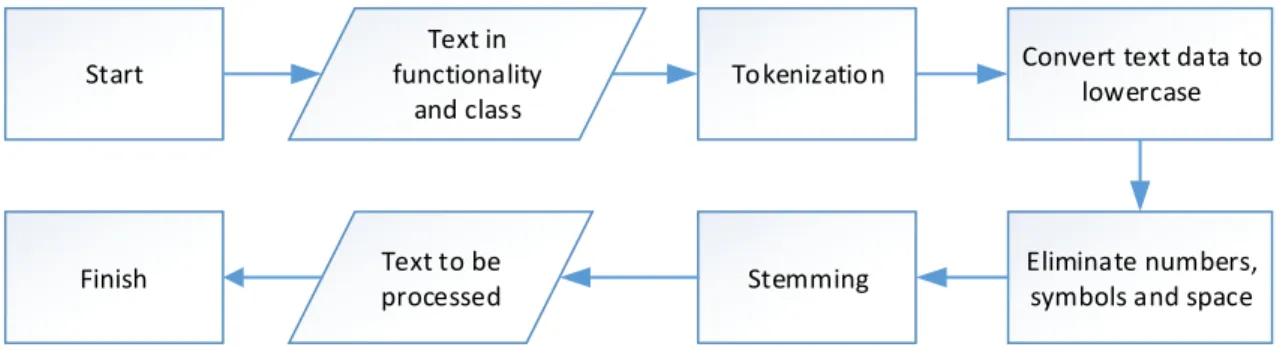
The pre-processing phase is shown in Figure 3. The first step is splitting the text into set of words. This step is also known as tokenization. The letters in the alphabet is converted to the lowercase. Furthermore, punctuation removal is used to omit numbers, symbol. The last step is stemming. This step is to remove conjunction and affixes. This will result the only important words. There are two types of the input text: the requirement statement and the information of class diagram including the code, class name, attributes and methods. The required statement text is stored in the txt file that contain the requirement statement. This file is shown in Figure 4.
The text in the class diagram is also stored in a txt formatted file. From the list of classes that have been provided previously, the text is separated based on the code, class name, attributes, and methods. This is shown in Figure 5. The following illustrates how the pre-processing was carried out on (F01) "Patron or Library can manage account".
Figure 2. Class Diagram of Library
TABLE 2
MAPPING OF EACH CLASS IN THE CLASS DIAGRAM
ID Class Attribute Method Type
C01 Book ISBN, name, subject, overview, publisher, publicationDate
- Class
C02 BookItem Barcode, tag, ISBN, subject, title, lang, numberOfPages, format, borrowed, loanPeriod, dueDate, isOverDue
- Class
C03 Author Name, biography, birthdate - Class C04 Account Number, history, opened, state - Class C05 Library Name, address - Class
C06 Patron Name, address - Class
C07 Librarian Name, address, position Class
C08 Catalog - - Class
C09 Search - - Interface
Figure 3. The Phase of Pre-processing Text
Figure 4 Text of Requirement List
Figure 5 Text on The Class (Class ID, Class Name, Attributes and Methods)
b) Mapping the requirements and classes
To map the requirement into the class, first a matrix of m×n is created. The m denotes the number of requirements, while the n denotes the number of class. Any information of a class, such as ID, names, attributes, and methods should be mapped against the existing functionalities of the library system. The similarity value of each text in the class diagram information should be mapped to the text on the requirement list. Table 4 shows an ilustration on how the mapping between a class (CO1) and a requirements statement (F01) is done.
The value of word similarity from each column (text of requirement) and row (text in class) was obtained using Wu-Palmer's word similarity method. Since the method relies on Wordnet Thesaurus, the method would only return valid values on word pairs that are the same word type (part of speech). Therefore, for word pairs that are different word type, our solution used Levenshtein Distance as word similarity method. The similarity between the requirements statement (F01) and the class (C01) was obtained using Greedy Algorithm
Text in functionality
and class
Tokenization Convert text data to lowercase
Eliminate numbers, symbols and space Stemming
Text to be processed Start
R04 library renew item
C04 account number history opened state
R05 patron provide feedback
C05 library name address patron name address
C06 librarian name address position
C07 catalog
C08 search
C09 manage
TABLE 4
THE WORD SIMILARITY VALUES BETWEEN C01 AND F01
ID Class/ Attribute
FO1 (Patron Library manage account) patron library manage account
C01
book 0.38 0.52 0.00 0.12
Isbn 0.00 0.00 0.00 0.14
Name 0.14 0.13 0.50 0.31
Subject 0.15 0.14 0.00 0.50
Overview 0.13 0.13 0.00 0.43
Publisher 0.12 0.11 0.00 0.25
Publication 0.40 0.56 0.00 0.13
Date 0.14 0.13 0.33 0.31
Sim 𝑆
𝑚𝑥𝑛=
2 × (∑min[𝑚][𝑛]𝑖=1 𝑚𝑎𝑘𝑠 𝑡𝑜𝑘𝑒𝑛𝑆𝑖𝑚|𝑚𝑖||𝑛𝑖|)
𝑚+𝑛
(1)
=
2 × (0.56+0.50+0.50+0.38) (8+4)=
1.94 12= 0.32
By using Equation 1, the obtained matrix results from C01 and F01 is 0.32. This calculation was carried out on all pairs of requirements statement and class. This process produces
The similarity value of all requirements-class pairs are stored in into a matrix as shown in Table 5. The next step is determining which pairs are considered correct pair, i.e. the class realizes the requirements. To determine the correct pairs, this method uses a threshold. Any pair that has similarity value higher than the threshold should be considered correct pair. In this
experiment, the value of the threshold was defined based on expert judgement, i.e. 0.40. As shown in Table 5, cells marked bold are considered correct pairs. For instance, C01 is considered realizing requirements F03 and F04. The same interpretation applies on the rest of bolded cells.
TABLE 5
REQUIREMENTS-CLASS SIMILARITY VALUES
ID F01 F02 F03 F04 F05
C01 0.32 0.33 0.43 0.44 0.18 C02 0.21 0.22 0.30 0.28 0.10
C03 0.56 0.27 0.37 0.35 0.29
C04 0.42 0.25 0.21 0.30 0.21
C05 0.54 0.36 0.46 0.53 0.30
C06 0.44 0.37 0.46 0.36 0.39
C07 0.47 0.28 0.40 0.42 0.31
C08 0.20 0.40 0.32 0.38 0.18 C09 0.11 0.40 0.11 0.13 0.08
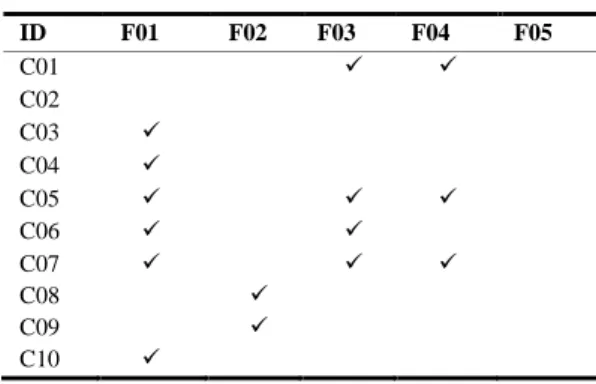
Given the result in Table 5, the method produces Table 6. This table describes all requirements with its respected implementation classes. A check mark (√) denotes the a requirement was implemented by a specific classes. One requirement statement may be realized by one or more classes. One class may realize one or more requirements. F01 is implemented by C03, C04, C05, C06, C07 and C10. F02 is implemented by C08 and C09. F03 is implemented by C01, C05, C06, C07. F04 is implemented by C01, C05 and C07. According to the experimentation, a class may have no correct pair with any requirements, as well as a requirement may have no correct pair with any class. This may happen due to the following two situations. First, the designer missed a requirements statement. Second, the requirements engineer failed to identify a necessary feature during the requirements specification process.
c) Generate the dependencies based on class dependencies
The next step is mapping the source class (source) into the destination class. The relation between the
source class and the destination class is taken from the class diagram. The mapping results of each class toward to the other classes shown in Table 7 should be mapped again to the available functionality in the system. Table 7 shows the dependency in the class diagram. There are a number of dependencies of class diagram, i.e. s, c, h, i, u. The s stands for specializes, h stands for has (strong aggregation), c stands for contain (weak aggregation), u stands for uses, i stands for implements, and d stands for dependency. For example, the relation between C02 and CO1 is specialization, the relation between C03 and C01 is weak aggregation, the relation between C05 and C08 is strong aggregation, and the relation between C07 and C09 is dependency.
d) Generate the requirement dependency model. After getting the result of class relations from the class diagram, the destination class should be mapped to the requirements statement list based on the class dependencies. Table 8 represents mapping the dependency between one functionality and other functionality. For instance F01 has a strong aggregation with F02. F01 correlates weak aggregation with F03 and F04. F03 and F04 have the same relation to F01, that is weak aggregation and uses. F03 and F04 have the same relation to F02, which is strong aggregation and uses.
Table 8 shows that the relation between functionalities based on class dependencies. For example: From the table, it is known that the relation F01 to F02 is "h" (strong aggregation). The strong aggregation relationship is derived from the following steps:
1. From Table 6 it is known that F1 is implemented by C03, C04, C05, C06, C07 and C10 or F1 = {C03, C04, C05, C06, C07, C10},
2. One of the functionalities used is F01 implemented by C05 (see step 1). Then in Table 7 it is known TABLE 6
MAPPING THE CLASS AND REQUIREMENTS
ID F01 F02 F03 F04 F05
C01 ✓ ✓
C02
C03 ✓
C04 ✓
C05 ✓ ✓ ✓
C06 ✓ ✓
C07 ✓ ✓ ✓
C08 ✓
C09 ✓
C10 ✓
TABLE 7.
RELATION AMONG CLASS IN CLASS DIAGRAM
Source class Destination class
C01 C02 C03 C04 C05 C06 C07 C08 C09 C10 C01
C02 s
C03 c
C04 c
C05 c c h
C06 u
C07 u u
C08 c i i
C09 C10
TABLE 8
MODEL DEPENDENCIES BETWEEN REQUIREMENTS
Destination S o u rc e
Requirements F01 F02 F03 F04 F05
F01 h c c
F02
F03 c,u h,u
F04 c,u h,u
that C05 has "c / weak aggregation" relation to C02, C04, C08,
3. In Table 6 it is known that C02 is not implemented by any functionality, C04 is implemented by functionality 1 (F01), C08 is implemented by Functionality 2 (F02). It denotes F01 has "h (strong aggregation)"relation to F02.
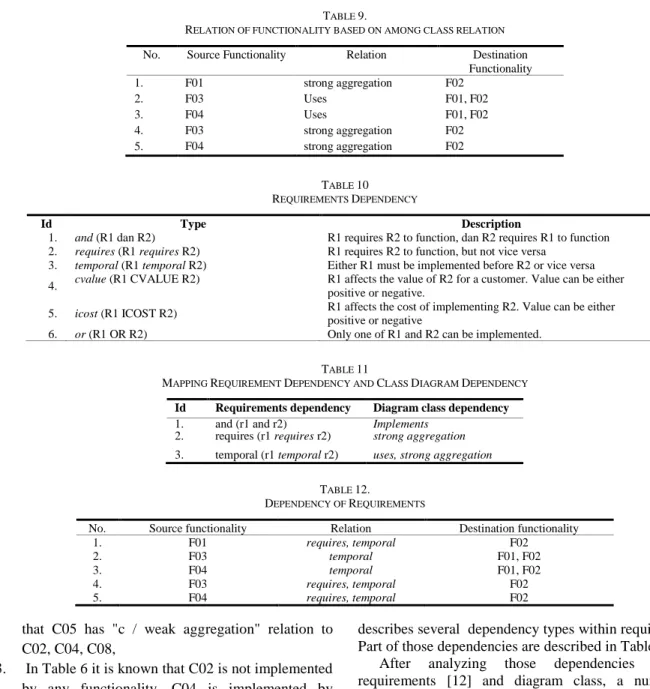
Detail description of Table 8 is presented in Table 9. This table represents the dependencies between the requirements obtained based on the inter-class dependencies on the class diagram. The weak aggregation relationship is not included in Table 9 because there is no pair definition about that relation previously.
Furthermore, the type of dependency used in this research were adopted from Dahlstedt (2001). It
describes several dependency types within requirements. Part of those dependencies are described in Table 10.
After analyzing those dependencies between requirements [12] and diagram class, a number of dependencies were considered relevant with the respected case, i.e. class diagram dependencies. The relevant types are: and, requires, and temporal. The detail of that pair of requirement and class diagram dependency is described in Table 11.
Given the result from Table 6 and 7, the requirements dependency can be derived based on the pre-defined mapping as shown in Table 11. The results of dependency mapping requirements based on class diagram dependencies can be seen in Table 12.
III. RESULTSANDDISCUSSION
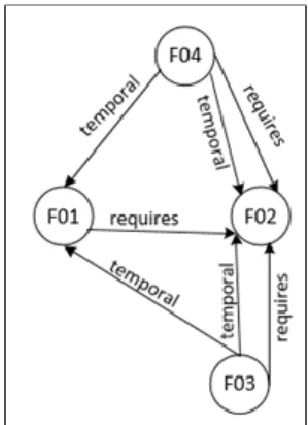
The results of the requirements dependencies can be represented as a graph of requirement dependency model. Figure 6 shows the requirements dependency graph of the library system. The dependency graph consists of source and destination requirements. The graph shows dependency model between requirements which is formed in library system case study. The dependency model obtained from the previous figure was visualized
as a graph. The graph consists of a node of origin, destination and direction. Node represents requirements statement, the directed line represents the relation between source and destination requirements statements. Then, Table 13 shows that propose method is the smallest value than the others experts. Proposed method has 0.37. The higher value is from the third expert, which agreement value is 0.82.
4.
positive or negative.
5. icost (R1 ICOST R2) R1 affects the cost of implementing R2. Value can be either positive or negative 6. or (R1 OR R2) Only one of R1 and R2 can be implemented.
TABLE 11
MAPPING REQUIREMENT DEPENDENCY AND CLASS DIAGRAM DEPENDENCY
Id Requirements dependency Diagram class dependency 1. and (r1 and r2) Implements
2. requires (r1 requires r2) strong aggregation
3. temporal (r1 temporal r2) uses, strong aggregation
TABLE 12.
DEPENDENCY OF REQUIREMENTS
No. Source functionality Relation Destination functionality
1. F01 requires, temporal F02
2. F03 temporal F01, F02
3. F04 temporal F01, F02
4. F03 requires, temporal F02
Figure 6. Graph of dependency model requirements TABLE 13
GWET AC1RESULT FROM 4DATASET
Expert 1 Expert 2 Expert 3 Proposed Method
Combined
Experts Average
Expert 1 ////////// 0.27 0.41 0.13 0.60 0.27
Expert 2 0.27 ////////// 0.52 0.43 0.71 0.41
Expert 3 0.41 0.52 ////////// 0.25 0.82 0.40
Proposed
Method 0.13 0.43 0.25 ////////// 0.37 0.27
The purpose of the small scale experimentation
was to answer whether the proposed method was as
reliable as an expert in creating requirements
dependency graph given a set of project artifacts, i.e.
requirements statements and class diagram. In this
research, the questionnaire was disseminated to
three experts. These experts served as annotators.
They annotated every pair of requirements and
classes that were considered as implementation class
of a respected requirements statement. In addition,
annotators also annotated interrelated pairs of
requirement with their dependency types. These
experts have at least working experience in software
requirement engineering or course teaching related
to software engineering.
The reliability of the proposed method is
measured by calculating the level of agreement
between the method and the experts. This level of
agreement calculation was based on the kappa
statistic method, which is Gwet's AC1. The method
was treated as one of the experts whose answers
would be compared against the other human experts.
The result shows that the method has moderate level
of agreement with the three human experts. The
reason is because the expert were able to identify
more dependencies between requirements. This may
be due to the fact that the expert has implicit
knowledge with respect to the domain problem. This
implicit knowledge is unknown to the method
.
IV.CONCLUSION