ASSESSMENT AND RANKINGS EFFORTS:
THE EFFECT ON INSTITUTIONAL AND PROGRAM-LEVEL CHANGE
Stephanie A. Schmitt
A dissertation submitted to the faculty of the University of North Carolina at Chapel Hill in partial fulfillment of the requirements for the degree of
Doctor of Philosophy in the Department of Public Policy.
Chapel Hill 2013
Approved by:
Maryann P. Feldman Howard E. Aldrich Richard N.L. Andrews David D. Dill
© 2013
ABSTRACT
STEPHANIE A. SCHMITT: Assessment and Rankings Efforts: The Effect on Institutional and Program-Level Change
(Under the direction of Maryann P. Feldman)
This dissertation considers the effects of national rankings, specifically the 2010 National Research Council (NRC)’s Data-Based Assessment of
Research-Doctorate Programs, on higher education institutions’ behavior. National research studies of graduate education require significant resources and data, yet it is uncertain how universities make substantive, transformational changes based on
participation in such quality rankings studies or their results. The dissertation provides quantitative survey results complemented by qualitative case studies to
describe responses and various institutional changes that occurred as a result of the NRC study.
Evolutionary change and higher education assessment theories support the
assertion that incremental changes occur most commonly within institutions
regardless of the external pressures from quality rankings studies. This dissertation
shows that quality studies such as the NRC can influence decision-making and improvement efforts when universities embark on change processes under serious deliberation with strong leadership and appropriate support resources. The degree
study, feasibility of accompanying data collection and analysis processes, and underlying value and use of the study results.
This research will be significant for university administrators, the general
public, and policymakers. University leaders and decision-makers can engage in efforts to see how peer institutions treat the rankings and engage in improvement
opportunities. They can also determine whether their own institutions could manage large assessment efforts in more effective manners. Policymakers will be interested in the results because if all the funds, time, and effort spent on rankings projects
result in minimal substantive action on campuses, they may wish to revamp the projects to make them more amenable to continuous improvement processes.
Private market implications for obtaining necessary research and student data are discussed as ways to meet public and governmental demands for accountability, assessment, and quality control of higher education.
This work will contribute to the body of knowledge about rankings and assessment studies, particularly reviewing how they serve as information
ACKNOWLEDGEMENTS
This dissertation and my degree would not have been possible without the support and guidance from my family, colleagues, classmates, and friends, including
my committee, Professors Maryann Feldman, David Dill, Howard Aldrich, Lynn Williford, Pete Andrews (and previously, Gary Henry). Each of you brought your
own expertise and special interest to my project, for which I am incredibly grateful. A simple thank you is not sufficient for your support and most especially, your time. My promise is to “pay it forward” in assisting other graduate students and improving
TABLE OF CONTENTS
LIST OF TABLES ... x
LIST OF FIGURES ... xiv
LIST OF ABBREVIATIONS ... xv
CHAPTER 1 – INTRODUCTION ... 1
Research Questions and Significance ... 2
Motivating Context and Policy Implications ... 4
Global Perspective ... 4
Public Policy Considerations ... 6
National Research Council’s Data-Based Assessment of Research-Doctorate Programs in the United States ... 8
NRC Current Release and Errors ... 9
Key Characteristics, Findings, and Critiques ... 14
Program Differences ... 17
Media Coverage and Usage ... 19
NRC Convocation ... 23
Future Efforts ... 26
Outline of the Dissertation ... 29
CHAPTER 2 – THEORETICAL PERSPECTIVES ... 30
Higher Education Assessment ... 32
Quality and Rankings ... 40
History ... 43
Stability and Inertia ... 45
Unique Interpretations of Factors ... 49
Institutional Change Theory ... 51
Organizational Behavior and Change ... 51
Institutional Action Related to Quality and Rankings ... 63
Methodological Techniques and Considerations ... 73
CHAPTER 3 – SURVEY METHODOLOGY ... 75
Survey Overview ... 76
Sample Selection Criteria – Central Administration ... 77
Sample Selection Criteria – Graduate Program Level... 79
Survey Design ... 84
Survey Implementation ... 86
Survey Response Rates ... 88
Survey Respondent and Population Comparisons ... 90
Limitations ... 93
CHAPTER 4 – SURVEY RESULTS ... 94
Central Administration Survey ... 95
Combined Program Surveys ... 100
Survey Comparisons Based on Quality Rankings ... 105
Individual Program Survey Comparisons ... 111
Nutrition ... 116
Neuroscience and Neurobiology ... 119
English Language and Literature ... 125
Chemistry ... 127
Economics ... 129
Open-Ended Responses ... 132
CHAPTER 5 – UNIVERSITY CASE STUDIES ... 138
Case Study Survey Responses ... 139
Case Selection Overview ... 140
Case Study Themes ... 146
Case Study Findings ... 149
Overview ... 149
Case Study: Quadrant 1 ... 152
Case Study: Quadrant 2 ... 155
Case Study: Quadrant 3 ... 159
Limitations ... 163
CHAPTER 6 – CONCLUSIONS... 165
Best Practices ... 168
Institutional Structure and Culture ... 168
Data Recommendations ... 171
Reframing Quality Studies ... 175
Policy Implications ... 179
Concluding Thoughts ... 183
APPENDIX 1.1 – CHANGES TO THE NRC STUDY EXCEL DATA TABLE ... 187
APPENDIX 3.1 – DISSERTATION SURVEYS ... 189
APPENDIX 4.1 – CENTRAL ADMINISTRATION SURVEY RESULTS ... 203
APPENDIX 4.2 – COMBINED PROGRAMS SURVEY RESULTS... 206
APPENDIX 4.3 – SURVEY RESULTS BASED ON QUALITY RANKINGS ... 210
APPENDIX 4.4 – NUTRITION SURVEY RESULTS ... 214
APPENDIX 4.5 – NEUROSCIENCE AND NEUROBIOLOGY SURVEY RESULTS ... 218
APPENDIX 4.6 – MATERIALS SCIENCE SURVEY RESULTS ... 222
APPENDIX 4.7 – ENGLISH LANGUAGE AND LITERATURE SURVEY RESULTS ... 226
APPENDIX 4.8 – CHEMISTRY SURVEY RESULTS ... 230
APPENDIX 4.9 – ECONOMICS SURVEY RESULTS ... 234
LIST OF TABLES
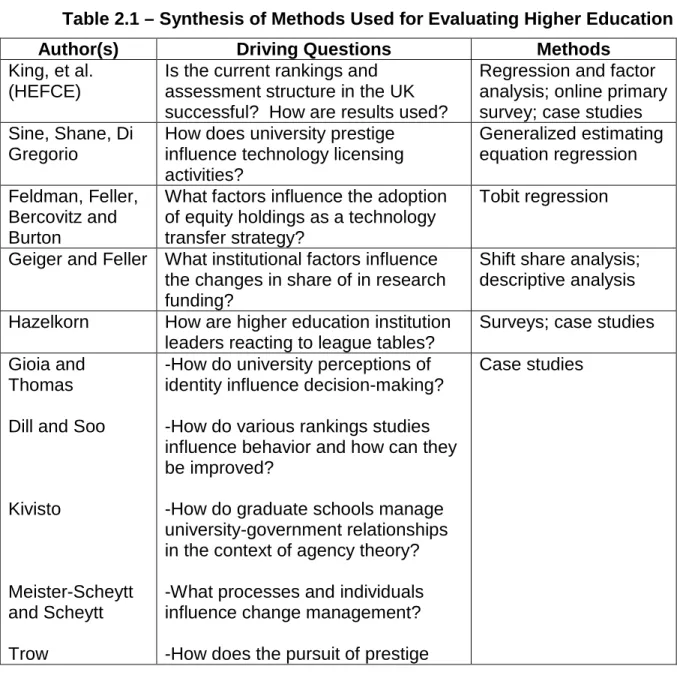
Table 2.1 – Synthesis of Methods Used for Evaluating Higher Education ... 73
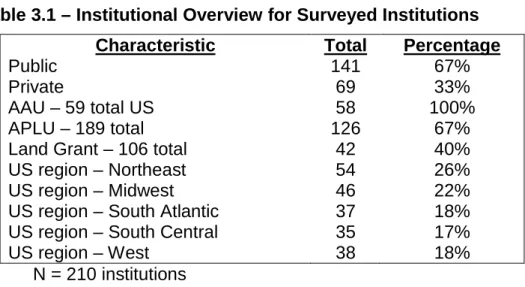
Table 3.1 – Institutional Overview for Surveyed Institutions ... 78
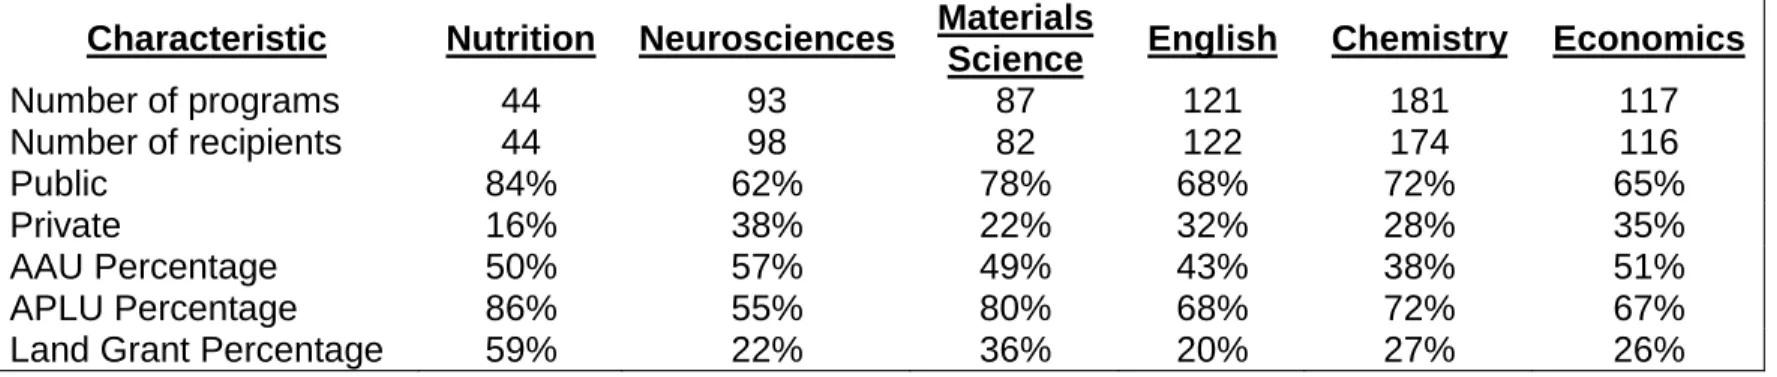
Table 3.2 – NRC Field and Recipients Overview for Surveyed Graduate Programs ... 80
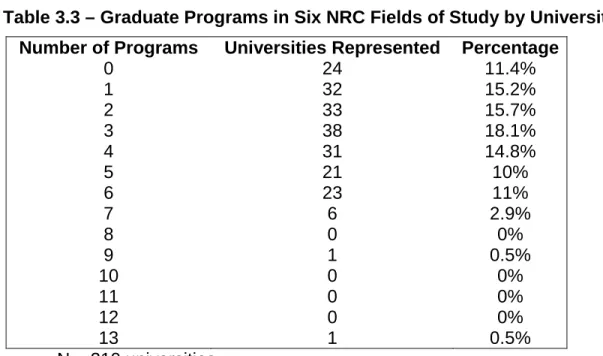
Table 3.3 – Graduate Programs in Six NRC Fields of Study by University ... 81
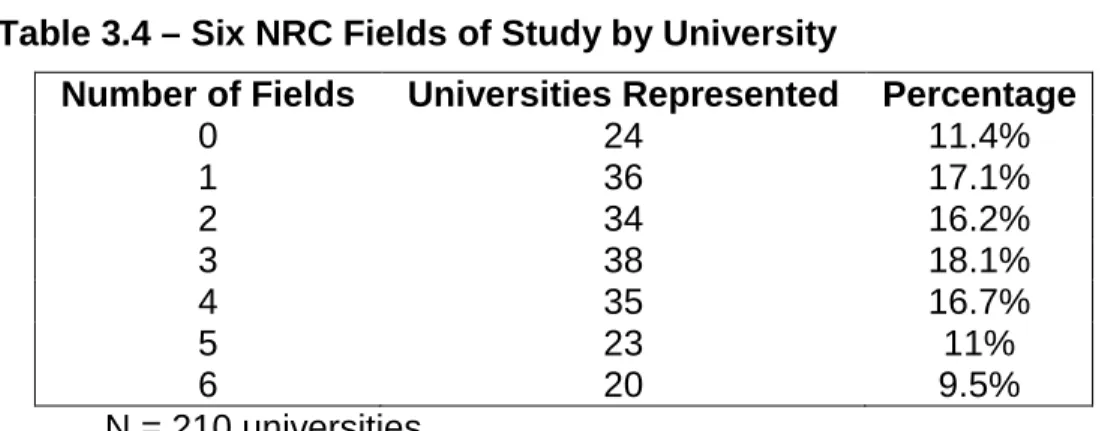
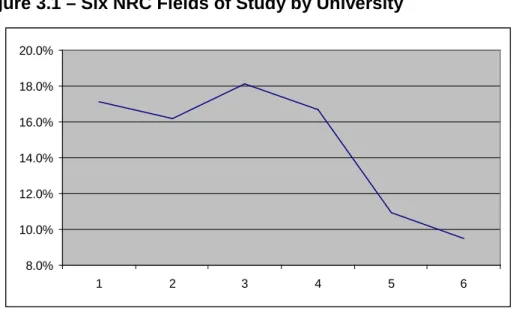
Table 3.4 – Six NRC Fields of Study by University ... 82
Table 3.5 – Submitted Survey Response Rate Progression (Percentages) ... 89
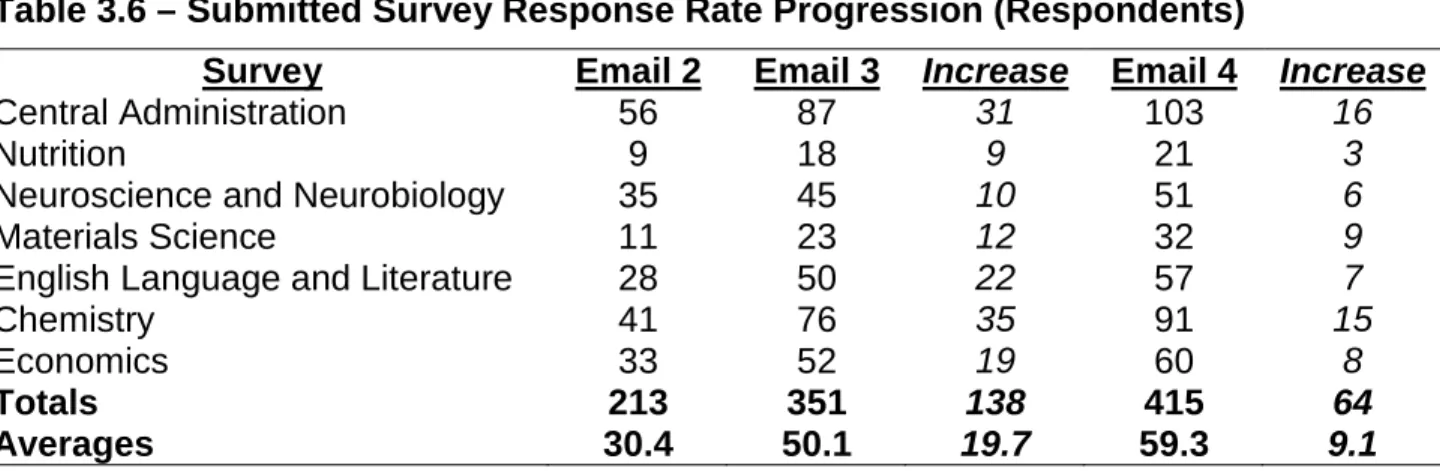
Table 3.6 – Submitted Survey Response Rate Progression (Respondents) ... 89
Table 3.7 – Final Survey Responses with Valid Partial Responses Included ... 90
Table 3.8 – Field and Respondent Overview for Survey Respondents ... 92
Table 3.9 – Difference between Respondents as Compared to Total Population of Possible Respondents from Tables 3.1 and 3.2 ... 92
Table 4.1 – Summarized Areas of Use for Doctoral Program Survey Respondents ... 113
Table 4.2 – Summarized Difference in Areas of Use in Advance of Results Release for Doctoral Program Survey Respondents ... 114
Table 4.3 – Summarized Doctoral Program Rankings of Usefulness of NRC Study Elements ... 115
Table 4.4 – Summarized Doctoral Program Rankings of NRC Study Use Factors within Program ... 115
Table 4.5 – Summarized Doctoral Program Rankings of NRC Study Use Factors within University ... 115
Table 5.1 – Respondents Agreeing to Case Study ... 139
Table 5.2 – Matrix of Case Study Possibilities Based on Use and Goal Responses among Central Administration Respondents ... 142
Table A4.1-1 – Areas of Use for Central Administration Survey
Respondents ... 203 Table A4.1-2 – Difference in Areas of Use in Advance of Results Release
for Central Administration Survey Respondents ... 204 Table A4.1-3 – Central Administration Rankings of Usefulness of NRC
Study Elements ... 205 Table A4.1-4 – Central Administration Rankings of NRC Study Use Factors
on Campus ... 205 Table A4.2-1 – Areas of Use for Doctoral Program Survey Respondents ... 206 Table A4.2-2 – Difference in Areas of Use in Advance of Results Release
for Doctoral Program Survey Respondents ... 207 Table A4.2-3 – Doctoral Program Rankings of Usefulness of NRC Study
Elements ... 208 Table A4.2-4 – Doctoral Program Rankings of NRC Study Use Factors
within Program ... 209 Table A4.2-5 – Doctoral Program Rankings of NRC Study Use Factors
within University ... 209 Table A4.3-1 – Areas of Use for High-Quality Doctoral Program Survey
Respondents ... 210 Table A4.3-2 – Difference in Areas of Use in Advance of Results Release
for High-Quality Doctoral Program Survey Respondents ... 211 Table A4.3-3 – High-Quality Doctoral Program Rankings of Usefulness of
NRC Study Elements ... 212 Table A4.3-4 – High-Quality Doctoral Program Rankings of NRC Study Use
Factors within Program ... 213 Table A4.3-5 – High-Quality Doctoral Program Rankings of NRC Study Use
Factors within University ... 213 Table A4.4-1 – Areas of Use for Nutrition Program Survey Respondents ... 214 Table A4.4-2 – Difference in Areas of Use in Advance of Results Release
for Nutrition Program Survey Respondents ... 215 Table A4.4-3 – Nutrition Program Rankings of Usefulness of NRC Study
Table A4.4-4 – Nutrition Program Rankings of NRC Study Use Factors
within Program ... 217 Table A4.4-5 – Nutrition Program Rankings of NRC Study Use Factors
within University ... 217 Table A4.5-1 – Areas of Use for Neuroscience Program Survey
Respondents ... 218 Table A4.5-2 – Difference in Areas of Use in Advance of Results Release
for Neuroscience Program Survey Respondents ... 219 Table A4.5-3 – Neuroscience Program Rankings of Usefulness of NRC
Study Elements ... 220 Table A4.5-4 – Neuroscience Program Rankings of NRC Study Use
Factors within Program ... 221 Table A4.5-5 – Neuroscience Program Rankings of NRC Study Use
Factors within University ... 221 Table A4.6-1 – Areas of Use for Materials Science Program Survey
Respondents ... 222 Table A4.6-2 – Difference in Areas of Use in Advance of Results Release
for Materials Science Program Survey Respondents ... 223 Table A4.6-3 – Materials Science Program Rankings of Usefulness of NRC
Study Elements ... 224 Table A4.6-4 – Materials Science Program Rankings of NRC Study Use
Factors within Program ... 225 Table A4.6-5 – Materials Science Program Rankings of NRC Study Use
Factors within University ... 225 Table A4.7-1 – Areas of Use for English Program Survey Respondents ... 226 Table A4.7-2 – Difference in Areas of Use in Advance of Results Release
for English Program Survey Respondents ... 227 Table A4.7-3 – English Program Rankings of Usefulness of NRC Study
Elements ... 228 Table A4.7-4 – English Program Rankings of NRC Study Use Factors
Table A4.8-1 – Areas of Use for Chemistry Program Survey Respondents ... 230 Table A4.8-2 – Difference in Areas of Use in Advance of Results Release
for Chemistry Program Survey Respondents ... 231 Table A4.8-3 – Chemistry Program Rankings of Usefulness of NRC Study
Elements ... 232 Table A4.8-4 – Chemistry Program Rankings of NRC Study Use Factors
within Program ... 233 Table A4.8-5 – Chemistry Program Rankings of NRC Study Use Factors
within University ... 233 Table A4.9-1 – Areas of Use for Economics Program Survey Respondents ... 234 Table A4.9-2 – Difference in Areas of Use in Advance of Results Release
for Economics Program Survey Respondents ... 235 Table A4.9-3 – Economics Program Rankings of Usefulness of NRC Study
Elements ... 236 Table A4.9-4 – Economics Program Rankings of NRC Study Use Factors
within Program ... 237 Table A4.9-5 – Economics Program Rankings of NRC Study Use Factors
LIST OF FIGURES
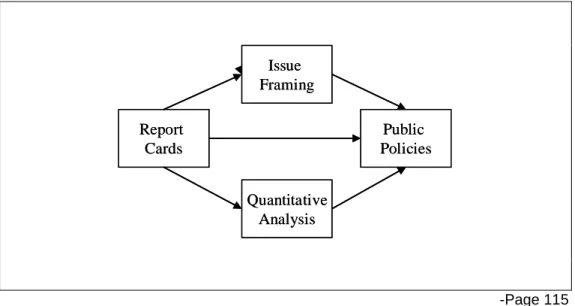
Figure 2.1 – Modeling Flow of Information and Decision-Making from
LIST OF ABBREVIATIONS
AAU Association of American Universities AIR Association of Institutional Research
APLU Association of Public and Land-grant Universities CGS Council of Graduate Schools
IPEDS Integrated Postsecondary Education Data System NORC National Opinion Research Center at the University of
Chicago
NRC National Research Council
NRC Convocation NRC Convocation on Analytic Uses and Future Directions NRC study National Research Council’s Data-Based Assessment of
Research-Doctorate Programs in the United States
CHAPTER 1 – INTRODUCTION
Assessments of higher education in the United States began in the early 1900s but have taken on greater prominence in the past thirty years as studies
transitioned to publications that were more accessible by the general public (Altbach, 2010 and 2012; Hazelkorn, 2012). Graduate education was the initial focus for ranking studies, but now they also cover all aspects of undergraduate and
professional education. The US News & World Report magazine first published its rankings in 1983, which coincided with the first reputational assessment of research
doctorate programs by the National Research Council (NRC) (Brooks, 2005). Money magazine’s value rankings premiered in 1989. These are just a few of the most popular examples purporting to rank the quality of aspects of American higher
education institutions, including undergraduate programs, individual departments or graduate disciplines, and associated costs of attending a university.
Rankings studies are useful as they allow various constituents to make more informed choices. Audiences use information from the ranking studies in different ways, some better than others (Kuh, 2009; Berrett, 2012; Hazelkorn, 2007, 2008,
2009, 2012; Altbach, 2012; van Vught and Ziegele, 2012). The general public, especially prospective students and their families, welcome any insights into the
Funding or grant agencies could judge prospective applicants and proposals based on their rankings and associated data.
This dissertation begins with this broad view of the role of ranking studies and
specifically looks at the reported and possible uses of the most recent NRC study. The focus is on extrapolating the NRC study as a form of external pressure and
reflecting on resulting change processes, or the lack thereof, on university campuses from this information instrument. This study is a multi-level evolutional analysis with an emphasis on the institutional forces that can affect change processes.
While there are known issues of reliability and validity with the NRC study methods, this dissertation will not be a critique of the various methodologies or
assumptions that led to the results. Rather, it is intent on reviewing the use of the study and its results as information instruments and its associated impacts for institutional change. Not all forms of response to rankings studies are necessarily
appropriate. Additional focus on the use of results from an evolutionary, institutional perspective will provide greater context for the effectiveness of such studies within
the assessment landscape for overall higher education quality improvement efforts.
Research Questions and Significance
This dissertation reviews how rankings studies have influenced organizational change by institutions of higher education, especially at the graduate education level. As a result of the increased public scrutiny and cross-institution comparisons,
quality assessments? How do institutions define, monitor, and improve quality assessment? How is the overall quality landscape for institutions of higher
education affected? Specifically, how do universities themselves use the NRC study as a policy tool for enacting changes on their campuses? Institutions of higher education can respond to rankings studies in either productive or dysfunctional
ways, both of which can influence quality assessment practices.
Myriad factors influence change decisions at universities. It is difficult to attribute changes caused solely by one study or assessment project, because
universities are complex organizations operating in multifaceted environments. When considering what elements and dimensions might go into a comprehensive
account of change in graduate education, multiple interdependent factors come to mind. For example, institutions could make changes either to influence their
graduate programs’ rankings or alternatively, to improve their campus offerings after
the release of poor rankings. Funding levels, program growth, historical contexts, external pressures, policies related to enrollment, tuition and teaching/research
assistants, and other graduate education factors such as faculty hiring and grant administration could be part of a comprehensive analysis and discussion. Only through original data collection and detailed case study is it possible to begin to
understand the central questions posed in this dissertation.
This work acknowledges that audiences use the ranking studies in different
dissertation focuses only on use of the assessment results from an evolutionary, institutional perspective at both the university and graduate program level.
The body of literature reviewed in Chapter 2 informs this discussion. Survey
outcomes and case studies demonstrate opinions and tangible examples of institutional change resulting from the most recent edition of the NRC study. The
degree of learning and organizational change depends in large part on the perceived validity and utility of the instrument and study. Thus, the surveys described in
Chapter 3, with results presented in Chapter 4, and case studies presented in
Chapter 5 provide insights. While the dissertation does not attempt to address causality between rankings studies and organizational change, the motivating
context and policy implications for this research are highlighted in the next section.
Motivating Context and Policy Implications
Universities are under many pressures concerning quality, affordability, and accountability, so their reactions to information about their performance, both publicly and internally, are important to understand. More and better information is
expected to lead to stronger decision-making and thus better outcomes for
organizations. The primary purpose of this research has been to determine how and
whether assessment data and rankings studies, such as the NRC, have been used to provide information for policy choices and decisions leading to action by
institutions of higher education.
Global Perspective
Broadly, higher education is becoming increasingly homogenized as the
university rankings are increasing in scope, quality, and importance, often
generating as much attention among the top tier research campuses as in-country studies. Strategic university partners crossing national boundaries – for alliances,
shared research or academic initiatives, and faculty and student exchanges – are driven by a desire to be aligned with other highly-ranked institutions, even if only at
the reputational level.
Within graduate education, the educational models and expectations in the United States, especially doctoral-level training programs, are spreading to other
countries. Governmental oversight, accreditation practices, centralized graduate school structures, and university cultural differences play a role. Competition to
decrease “brain drain” from within the country and to attract the diversity brought from an influx of foreign students of varying nationalities is leading to revisions among faculty and university administrators worldwide. This line of research and
structural change encompasses a different body of literature, review of governmental and professional oversight structures, and organizational culture considerations than
those addressed in this dissertation. However, the global context for trends in graduate education is important to note as the backdrop for the importance of studying university decision-making and responses to rankings and assessment
studies.
The NRC study is only one recent example of a prominent, national
this research will provide insights, best practices, and recommendations for how such studies can be used to implement change and program improvements on campuses.
Public Policy Considerations
Further analysis of the NRC study and results is significant to policymakers,
university administrators, and the general public. Federal and state public resources, not to mention the universities themselves, support these studies,
including the NRC. Particularly when one considers the diffused effect of resources
and staff time spent collecting and analyzing the input data, impacts on a campus can be substantial not only for the central university but also for every academic
department or program required to collect and assess information. This work will contribute to the body of knowledge about rankings and assessment studies,
particularly reviewing how they influence change and decision-making on campuses.
Using a multi-level survey, the research also contributes to better understanding of alignment on goals and change processes between the central administration and its
component graduate programs within the university.
Policymakers will be interested in the results. If all the funds, time, and effort spent on rankings projects result in minimal substantive action, the projects should
be revamped. Governments and other policy decision-makers may also provide support for implementing best practices to facilitate action. It is also possible that at
necessary methodological changes in the rankings projects to make them more amenable to continuous improvement processes.
There are implications for the private market as well given the increasing
demand for data and analysis on universities from varying corners (Glenn, June 2010 and December 2010; Wiley, 2009; Suskie, 2010; Lederman, 2012; Dill, 2011;
Shavelson, 2010). Research is beginning to focus more closely on measures for comparison across higher education institutions, such as the Gates Foundation’s Context for Success project that focuses on outcomes measures for education (Fain,
2012). Private companies, such as Academic Analytics, Thomson Reuters, and Elsevier, have sprung up to meet some of these data demands. They provide data
reporting and analysis, for a fee, to university campuses with a primary comparative focus on faculty research and productivity metrics. They cater to institutions who want more detailed information about themselves and also appeal to the competitive
nature of rankings and elite peer status (Thomson Reuters, March 2013). Broader and more accessible metrics are still needed. The for-pay aspect of these data may
be cost prohibitive for some universities and raises questions about the independent nature of these firms. Yet the emergence of these innovative companies show a business model exists to meet university demand for quality data.
Not only do universities wish to study and make comparisons about their peers, but there are also increasing demands for accountability, assessment, and
well-constructed to present accurate information that is useful to addressing these concerns now and into the future.
University leaders and decision-makers will benefit by understanding how
peer, competing institutions use the rankings. They will also find it useful to
determine whether their own institutions can manage large assessment endeavors
in more effective manners. Such efforts can influence competitive positions for universities, affecting student and faculty recruitment, access, external research support, and tuition levels.
Against the backdrop of the NRC study, this dissertation aims to review how universities are using the NRC study data and results as policy tools for continuous
improvement and change on campuses. The NRC study has historically been seen as gold standard research on graduate education deserving of wide dissemination (Lederman, 2005; Hicks, 2008). Together with the resource and use considerations
described above, all these reasons justify additional research as to the effectiveness of the project in creating change and improvement in doctoral education.
National Research Council’s Data-Based Assessment of Research-Doctorate Programs in the United States
The National Research Council is part of the National Academy of Sciences, a private, nonprofit institution that provides science, technology, and health policy
advice under a congressional charter signed by President Lincoln in 1863. It
provides services and advice to the federal government, the public, and the science
many current policy issues and decisions faced by the nation (National Academies’ website).
One of its primary contributions to the higher education policy arena has been
the decennial assessment of the quality of research doctoral programs in the United States. The NRC study has traditionally called upon administrators, institutional
researchers, faculty, and staff to gather large amounts of data and respond to
various survey requests. The National Academies augments the collected data with data on faculty publications, citations, and awards. The staff then analyzes the
results and releases a thorough data analysis and assessment, including rankings, of the quality of doctoral programs nationally.
This comprehensive research and assessment project has occurred three times. The NRC study was first conducted in 1983-84 and again in 1995-96. The most recent study was conducted in 2006-07 and was named the Data-Based
Assessment of Research-Doctorate Programs in the United States. It used 2005-06 as the baseline year for data collection purposes. The results were released in the
fall of 2010 and included a written volume plus a massive Excel spreadsheet of program-level data about participating doctoral programs on multiple NRC study variables. This dissertation focuses on this latest iteration of the study, which is
described in detail along with the context and controversies surrounding its release. NRC Current Release and Errors
study report and database). Policymakers, university administrators, and academic scholars in the higher education and assessment research arena appear to accept this goal by disseminating, highlighting, and building on the NRC’s methodology and
practices in their own work. While the NRC’s methodology and findings have been targeted areas for academic research, analysis, and criticism, minimal work has
occurred reviewing the institutional effects and changes resulting from a large research effort at the graduate level such as this.
The results released in fall 2010 included characteristics and ranges of
rankings using the NRC study methodology for over 5,000 programs in 62 fields at 212 institutions. A revised NRC study methodology was also released at this same
time, which included an overview of the two ranges of rankings, the S and the R rankings, and descriptions of the 20 key variables that contributed to them (NRC study project website; Jaschik, May 2010). The resulting multiple ranges of
rankings, in lieu of an ordinal list of discrete rankings of programs, was an intentional step on the part of the NRC study commission to show the complexities and inherent
inaccuracies in basic assessments of graduate education (NRC release webinar, 2010; Kuh, 2009; Lederman, 2005). Simple rankings of an endeavor as complex as graduate education cannot take into account the full breadth of training
opportunities, research foci, scientific methods, and disciplinary standards in use in graduate programs across the nation.
been labeled as a private rather than a public institution, plus the entire field of Computer Science had issues with a key variable on student outcomes (Computing Research Association, 2010). The rankings were re-run for Computer Science, and
the public release on September 28, 2010, produced a different set of data. The NRC then asked institutions to report all found errors by November 1, after which
they would determine whether there were issues substantial enough to re-run the statistical methods again to achieve another set of ranges of rankings or if they would simply publish the errors on a public website for users to see.
On April 21, 2011, the NRC released another version of the Excel
spreadsheet that included updates as submitted to the NRC and revised ranges of
rankings. The NRC reported it had received queries about approximately 450 doctoral programs from 34 institutions. This revised spreadsheet was immediately found to include new technical errors in time to degree and completion data for
programs in the history of art, architecture, and archaeology field and a revised spreadsheet was posted a week later. The revised spreadsheet incorporated some
technical and factual corrections from the original release and noted four key areas where reviews were requested (see Appendix 1.1). The April 28, 2011 version is the final dataset posted for use by universities and students and in any research projects
desiring data on doctoral programs.
The revised ranges of rankings did not address all issues raised by
institutions or accommodate all requested changes. Specifically, much of the background data behind several of the reported variables, such as faculty
from universities to revise their faculty lists as originally reported in 2006 (Glenn, March 2011). Though not stated directly, several of the areas where requests were not addressed included key components to the rankings that, if changed, may have
significantly influenced the outcomes. Once the rankings were released, the NRC did not entertain requests that might have been perceived as gaming the results and
rankings. One’s assessment of where this boundary line existed is acknowledged as open to interpretation.
Errors and misunderstanding are centered primarily on the faculty measures,
specifically concerning the count of faculty who were included and their omitted publications and citations (Glenn, June 2010). The NRC has not provided
information publicly about the process used to gather publications data for faculty other than to say their efforts mined Thomson Reuters (ISI) Web of Science, a multidisciplinary publication and citation database product. Public discussion at the
2011 NRC Convocation, discussed in greater detail below, and on websites and project email listservs suggests that when universities or graduate programs mined
for their own faculty, they typically found much higher publication counts than reported by the NRC, even with the embedded error taken into account.
Similarly, the faculty allocation process in the NRC study is a point of marked
confusion (AAU Association of Graduate Schools letter, January 2011; Glenn, December 2010; Drahl, 2010). Institutions were asked to provide faculty lists for
evenly. Affiliated faculty members were allocated across programs that named them through calculations based on dissertation committee service. These steps were taken to ensure no one individual achieved more than one hundred percent effort
across all their affiliated doctoral programs, even for individuals with joint or multiple departmental or program affiliations. This method clearly creates confusion when
multiple programs claim someone.
Once the results were released and people saw the outcomes of these allocations, questions and concerns arose. Faculty in the programs did not
understand why someone they considered a core faculty member only partially counted in their graduate program, both for headcount and workload purposes. The
argument arose that the allocation method harmed highly-interdisciplinary faculty and programs. Such interdisciplinarity is an already-accepted and growing tenet of strong graduate education (AAU Association of Graduate Schools letter, January
2011; Glenn, December 2010). The differences in faculty productivity mentioned above were not explained simply by the faculty lists or allocation processes.
The second key area where errors and confusion occurred centered on how the NRC study assessed funding for students. There was a complex funding grid in the program questionnaire1 that identified various sources of funding, as well as
multiple combinations of those sources of funding. According to the NRC
methodology guide, the study only used a couple of these line items to describe
student funding. Most notably, the NRC results reported the percentage of students with research and teaching assistantships, but they did not include the combination
lines that included these sources of funding along with other sources. So for example, a student who was funded solely on a TA would be counted as a funded student in his program’s calculations; yet the student funded by both a TA and an
external scholarship would not be counted in her program’s funded variable. This method of counting reduces the overall percentages of funding shown for students
and under-reports programs’ true emphasis on student funding. This type of analysis is to the disadvantage of public institutions that might have more
combinations of funding for graduate students than private universities. Several
public universities mentioned this issue as raised by their programs at national conferences such as the NRC Convocation or publicly on email listserv groups.
Key Characteristics, Findings, and Critiques
Even with its shortfalls, the NRC study results could be viewed in any number of meaningful ways. There are some key takeaways from the report and ranges of
rankings of fields. Important and valued variables in most fields turned out to be publications per allocated faculty, citations per allocated faculty, faculty awards, and
percent faculty with grants. Inherent in these outcomes is the allocation of faculty across programs as described above, which dictated who was included in these findings and at what percentage of effort.
For publications, the NRC used Thomson Reuters to conduct searches, which will necessarily miss some faculty, even when trying to match on zip code or name
and university combinations. Some fields do not publish or value (only) journals that are tracked by Thomson Reuters, and so some fields will have important
NRC said these issues were consistent and should not disadvantage one university or program over another. Given time and resources, they did “the best they could”. Yet some disciplines cried foul about their perceived low outcomes on these
measures of faculty productivity, especially given their importance in the weightings and outcomes (Cole, 2011; American Sociological Association, 2011; American
Mathematical Society, Mucha, 2011; Jaschik, March and April 2011; Computing Research Association, 2010). Because the NRC did not release these data publicly, the reported values for publications and citations cannot be recreated, thus
questions of accuracy and misrepresentation have remained.
When reporting the percent of faculty with grants, the NRC used the
respondents to the faculty survey as the denominator and not the full faculty count for a program, a decision that could be subject to unintended bias. This variable also does not capture the amount of grants, just the percent of responders who
reported grants, again leading to potential misrepresentation. For example, a small school with each faculty respondent holding a $1k grant may look stronger on this
characteristic than a research-intensive university with half the faculty respondents holding multiple grants of six to seven figure dollar amounts. At the extreme, if a university program had only one respondent and she happened to hold a grant, their
program would be reported at 100% compared to another university that had high response rates with a mix of grant holders.
measures will in fact see their overall ranges of rankings harmed by the weights and coefficients associated with the measures. The NRC addressed these outcomes by indicating that diversity is labeled as important among respondents and at the same
time indicated these measures will not carry a great amount of weight unless other quality characteristics are equal. They also emphasized in the report, and at the
release press conference and NRC Convocation, that the weights are not as important as the absolute values when looking at each variable. Thus a program that performs well on their gender balance among faculty or students, for example,
can see how well they do compared against their peers even if the rankings
themselves do not take this variable into account due to the methodology employed.
Even with this explanation, the programs that sensed their rankings were reduced because of perceived strong performance on diversity measures are questioning the validity of such an outcome, especially one that is now publicly presented to
researchers and prospective students (American Mathematical Society, Mucha, 2011; Drahl, 2010).
The NRC study imputed missing data on the 20 key variables reported in the spreadsheet. In many cases the imputed value is the average value for the whole field, a rather crude mechanism for imputing data, especially since it does not
appear to have been consistently applied. In some cases, missing data were reported as zeros, whereas in others, the missing data were given the assigned
value for the field to missing values. The NRC did correct this specific value in the final April 2011 release to allow programs with no first-year students in a given year to remain as missing data instead of any imputed value.
Program Differences
The NRC study results also showed some distinct differences among
programs they included. Several disciplines were not included in the study because of uncertainties in how best to quantify quality measures, especially in more
professionally-oriented doctoral training. Fields such as Education and Social Work
were excluded even though as disciplines, their faculty would argue that their PhD programs are research-oriented. While the NRC tried to incorporate emerging areas
of study, interdisciplinary fields created issues. The more-established disciplines appeared to fare better with the NRC taxonomy and methodology.
Applying the Biglan model can help explain why it is so difficult to generate
taxonomies for studies such as the NRC. Through his work surveying faculty at two higher education institutions, Anthony Biglan (1973) provided an approach for
classifying different academic areas. The model offers various ways to structure and understand academic disciplines, including continua along three dimensions: hard-soft, pure-applied, and life-nonlife. To compare across dimensions and disciplines is
unwise, Biglan argues, as the characteristics and social constructs within a discipline have an impact on the type of output a program produces. The NRC study can be
institutional level. Structuring a taxonomy along these dimensions to ensure appropriate comparability would be difficult, yet more meaningful in the long term.
In the most recent iteration of the NRC study, two field areas are especially
noteworthy within this framework. First, Communication Studies as a field is very broad for two main reasons. It is a relatively new field and so there is not as much
agreement among the faculty who would have been surveyed as to what characteristics are most important to quality. The NRC field includes both
Communication Studies and Journalism, which are very divergent fields at some
schools. Journalism will cover print and electronic media, public relations, and advertising. Communication Studies can include theater and performance based
studies as well as organizational behavior, rhetoric, and communication theory fields. These varying characteristics of this one NRC field make it very difficult to perform valid comparisons across the programs and institutions. Campuses could
self-select peers among the whole field and compare themselves on the individual data variables, yet the ranges of rankings would not be terribly meaningful in this
scenario. They cannot be re-run while only factoring in certain programs within a whole field.
Second, there is also wide variance among the weights and rankings in the
Pharmacology and Toxicology NRC field. The S and R rankings vary so widely that some institutions see their programs perform very well under one methodology but
this field but are more weakly influenced in the S method, which provides one explanation for the wide variance between the two methods. Many of the programs included in this field are interdisciplinary and engage in research not only with
support from but in partnership with the National Institutes of Health and National Institute of Environmental Health Sciences. Faculty often hold joint or adjunct
appointments between the Institutes and the partnering university. The faculty data submitted as part of the NRC study may be skewed as a result, which could impact their faculty productivity outcomes. Because of their different funding streams and
employer expectations, individuals who are engaged in these doctoral programs may not publish at the same rates, carry their own grants, or even be affiliated
directly with the listing institution. Thus, their productivity may appear less than that which is traditionally expected of faculty for valid reasons due to work left uncaptured in the NRC study.
Although there are now known issues with the NRC study, its release was highly anticipated. This chapter next turns to this time period and provides some
immediate reactions to use of the study results. Media Coverage and Usage
The mainstream media did not cover the NRC study release very heavily.
The study was very complex with few headlines that would be easily consumable by the average reader. Because of the lack of discrete rankings, no one could
reviewed were transparent about the process and results (Jaschik, September 2010; Inside Higher Ed; Boston University website; University of Michigan website; Cornell University website; Duke University website; University of California-Los Angeles
website; University of California-Berkeley website; Boston University website; University of Virginia website). Most universities took the upper end of one of the
ranges of rankings and extrapolated their success from there, typically suggesting their university had a certain number of programs that could have fallen within the top ten percent or quartile nationally in quality. Few universities appeared to make
university-wide counts, listings, or statistical claims. All of these responses were within the spirit of the NRC study as described in the National Academies’ release
news conference and media press release.
For several weeks after the release, blogs and articles did appear on
discipline-specific or general higher education publications such as the Chronicle of
Higher Education and Inside Higher Ed, among others. In large part, these articles questioned the NRC results and methods. Faculty were suspicious of the results,
especially from the S ranking method that showed quality indicators in a bottom up fashion based on surveys of faculty, which was a new methodological approach for the community to understand. Historically the NRC study maintained a traditional
rankings approach with large reputational components based on peer opinion surveys, which are generally frowned upon as statistically illegitimate quality
measures. The 2006 NRC study commission undertook efforts to change its
rankings efforts, the complexities and unusual reporting for the NRC results still led to confusion about the processes employed once released. This distrust even led to some calls for reintroducing some elements of reputational assessment in quality
studies (Glenn, September 2010; NRC Convocation).
Statements on the immediate use of the NRC data and results were varied
but primarily indicated mining the data for relevant information to each campus and program. Many of the deans, chancellors, and presidents who released statements or provided information on websites upon the release talked about needing more
time to process all the data and to determine how they were going to use the study to improve the quality of their graduate programs (CGS Statement, 2010; Jaschik,
September 2010; Brown, 2011; various university websites and press releases as captured by the author).
Discipline-specific attention similarly included a desire to understand better
the data variables and not necessarily focus on the rankings. Those programs that did well wanted to see where they were strong compared to their peers so they
could tout that message to prospective students and their deans. Other programs wanted to know where they did not do well so they could focus improvements on those key areas, presuming the NRC study will occur again. While some programs
that did not fare as well questioned the validity of some of the variables, they were able to move past the rankings and look at the specific variables for areas of
The NRC study and its results appear to have elevated the discussion of graduate education on campuses, including some of the key data variables that were highlighted (NRC Convocation, 2011; Glenn, March 2011; Russel, Gibeling,
and Weiss, March 2011). Though campuses reacted to the study release, it was not immediately apparent that campuses were using the NRC results right away for
making decisions about the future. This finding at the time of the release was expected due to the complexity of the study and the abundance of data that were released.
In the NRC study release webinar and press materials, as well as via remarks at the NRC Convocation, the study commission was clear in its inability to endorse
the ranges of rankings and stressed they were illustrative only. They continued to emphasize that the data were the most important outcome of their study. Their hope was that universities would use the data to compare themselves on individual
factors. It was not their goal to produce an ordinal list of quality, and they admitted to intentionally making it difficult to massage the data and results into such a list.
Commission members expressed a desire for campuses to use the data to further the conversation about the importance of graduate education and allow students and faculty to select the key variables that are important to them. They can then focus
on how to make changes to improve those key variables.
Other uses described at the release time involved other audiences. Students
competitive with their selected peer group. The NRC and its commission would support these uses of the data well beyond any use to rank programs and make decisions based solely on rankings. Herein lies the issue of focus for this
dissertation.
The following section describes the NRC Convocation in more detail to lay the
foundation for a review of uses of the study results. NRC Convocation
On March 4, 2011, the National Academies hosted the NRC Convocation on
Analytic Uses and Future Directions in Washington, DC. NRC staff, NRC study committee members, senior leaders in higher education, institutional researchers,
higher education policy and nonprofit representatives, graduate education leaders, and the media gathered to discuss the current and planned usage of the NRC study and its results. Opening remarks set the stage for ensuring that the universities –
the bearers of most costs and the recipients of most benefits from the NRC study – had the key voice in the use and dissemination of the results. Universities were also
asked to lead the national discussion about the future direction of these rankings and assessment efforts.
As this conference occurred prior to the release of the revised database,
several presenters and audience members spent time addressing the errors uncovered in the data with cautions for how best to use them. The overall theme
Several key outcomes and themes arose over the course of the day. There were calls for simplifying the data collection and methodology in the future. If universities and graduate programs can focus on fewer variables with standardized
definitions, the NRC study outcomes will be more action-oriented, understandable, and usable by the participants and audiences. Specific areas of use were the focus
of many presentations and comments and included managing and improving programs, strengthening the campus program review process, identifying
competitive positions, providing consumer information, and some public relations
usage such as with governing or legislative bodies.
Campuses indicated across the board that to really use the NRC data,
programs must cull it down to individual characteristics. The study as a whole provides too much information. To be useful and actionable, a campus or program must pick one key characteristic, select program peers, assess program standing
among the peers and national means, and set goals based on these results. Working toward these goals can then influence future perceptions of quality level
and overall rankings. The data were very important. With the data in hand, campuses can initiate conversations about program quality and continuous improvement among faculty, administrators, and program chairs. Prospective
students are increasingly interested in such metrics and comparisons as well.
Several presenters took these ideas a step further and shared which tangible
areas for further review and action were used on their campuses. These focus areas included admissions data, completion and time to degree data, diversity
SUNY-Stony Brook, for example, shared the process their campus used for the NRC data. They set a level or threshold of performance for their programs relative to their peers, such as top 25 or top 25%. Programs that fell below this threshold would
then have a focused review with very tangible outcomes. It is possible then that programs falling below the threshold could be scaled back or bolstered to bring them
into the higher tiers based on campus priorities.
Other campuses described similar studies and uses of the NRC study data. Most stressed that the NRC data and peer rankings should be but one input into this
process. Campuswide strategic planning processes should include additional data from campus and other national sources such as the Integrated Postsecondary
Education Data System (IPEDS) and the Council of Graduate Schools (CGS). In general, such inputs and quality measures help to position resources and determine where to invest in future directions. Additionally, with proper study, quality data and
peer comparisons can assist in determining which factors might be high impact areas where change could most contribute to program improvement.
Some conclusions can be drawn from the NRC Convocation and university presentations on data use. Not only can program quality studies lead to specific decisions for change, they can also be a catalyst for internal conversations about the
availability and use of program-level data on the campus. When national studies such as the NRC bring program quality into the realm of discussion, it helps
regardless of the NRC comparative data or even if the specific study is conducted again.
Future Efforts
Concluding comments by NRC leaders reflected on the variety of uses for program improvement that could result from their study. Ralph Cicerone, Chairman
of the National Research Council, stressed that research doctoral programs are a national asset impacting society. Higher education is under public demand for accountability and for producing quality programs, and the NRC study was seen as
meeting these demands. Dr. Cicerone stated his belief that the value of the project stems from the fact that the universities contributed so much and added intellectual
energy into the project. Similarly, Bill Colglazier, NRC Executive Officer, said that the “value in the exercise was the database itself”. Even with the issues the study encountered, the comparability of the data helps to shape the conversation about
graduate education among faculty and leadership in higher education nationally. It was unclear whether the National Academies would pursue another
iteration of the NRC study. In fact, leaders implied that the NRC could have a convening role in data collection and validation but not take the lead on the study going forward. The sense was that most of the future directions for quality studies
and assessment data collection and validation will be up to the higher education community, and specifically the graduate education community. Leadership and
Speakers pointed out the expense of waiting too long before beginning the next phase of the study. It was suggested that perhaps even collecting these data every two years would be both more useful and less expensive in the long run than a
decennial study. Many university leaders agreed that continuous improvement is more relevant and impactful than one massive study. Then campuses could review
trends over time and determine whether actions and decisions are having the intended effects on quality improvement.
Several speakers at the NRC Convocation also stressed the need to consider
unintended consequences from the study results. The results could drive behavior, perhaps in ways the graduate education community may not want to see, especially
in regards to interdisciplinary programs. First, as described above, highly
interdisciplinary programs generally might not fare well in a strict taxonomic study like the most recent NRC assessment. Because there are a variety of fields
represented, peer comparisons are difficult. The NRC study does not easily allow crossover comparisons between fields for the rankings data. While unlikely, if this
outcome leads institutions to forego fostering more interdisciplinary programs, graduate education and scientific research will face significant setbacks at the very time when research bridging fields is seen as most innovative and successful to
addressing the key issues in today’s world.
A second unintended consequence relates to future iterations of the study.
certain. Thus there was not as much potential for manipulation of the data, as institutions did not necessarily realize how the NRC was going to perform certain calculations. Without a change, universities may submit data in ways they think will
lead to stronger rankings and outcomes in the next study.
A third key element relates to the faculty listings. While the NRC was clear on
how faculty were to be included and listed, now that campuses can see how this total or allocated number of faculty were used in a number of variables, especially as it relates to faculty publications and citations, institutions may be more prone to
select faculty more intentionally in the next iteration of the study. For example, it may be that clinical or adjunct faculty who had served as dissertation chairs or
committee members were included on faculty lists – in accordance with the NRC guidelines. These faculty members may not be actively engaged in other aspects of the graduate program, including publishing or producing significant amounts of
research. Many of them are affiliated with campus or nearby research facilities, as described above in the Pharmacology and Toxicology discussion. It may be
tempting for the program to leave them off of the next round of faculty listings for these reasons, when in fact they did meet the criteria NRC established for including faculty. Understandably, administrators and program chairs are questioning why
someone who is not necessarily expected to contribute in some research areas could then be included in program variables on those same characteristics and
ultimately harm their affiliated programs.
addressed, including the need to establish firmer definitions for faculty and data elements, a simpler methodology, more transparent variables and data, and
outcomes that are geared toward more usable and action-oriented decisions (NRC
Convocation, 2011; Grasgreen, 2011).
Outline of the Dissertation
This dissertation began with a discussion about the policy relevance of this line of inquiry and background on the NRC study. Chapter 2 provides an
assessment of the relevant evolutionary change and higher education assessment literatures and gives an overview of theoretical frameworks focused on education rankings. Universities, with their layers of decision-making and decentralized
structures, serve as strong examples to study and determine the rationale behind actions.
Chapters 3 and 4 then describe and provide results from surveys of university administrators and graduate program faculty directors regarding their opinions and use of the NRC study. Chapter 5 provides the basis and results of studying these
ideas via three university case studies. Many facets of university life can impact how universities respond to rankings and data about their own performance. The
continuum of change and its influences are highly individualized and best informed through in-depth study of specific universities and their graduate programs, even though results are not generalizable to all campuses.
The dissertation concludes in Chapter 6 with a discussion about the policy implications and best practices in this arena and possible areas for additional
CHAPTER 2 – THEORETICAL PERSPECTIVES
Few studies focus on rankings assessment as a form of external pressure on universities and the critical dimension of the resulting change processes, or the lack
thereof, on university campuses. Three key thematic perspectives are relevant, each of which relates to the research questions identified in Chapter 1.
The first area of substantive literature details assessment in higher education.
This section includes broad overviews of assessment and informative evaluation. A discussion of the literature on external influences for assessment, such as the
government and accountability calls from the general public, is provided. An additional element of assessment includes theories on the study of use, primarily emphasized through literature sharing the rationale behind the adoption and use of
research.
Next, there is a literature on rankings and institutional quality approaches that
relates to methodological issues in the field and calls to standardize the processes and analyses. This literature is much more tangibly rooted in research design and description than theoretical but nonetheless provides insights into what factors may
make the NRC study more meaningful for implementing process improvements. Ranking studies are generally organized around several themes, such as
on different units of analysis, ranging from the institution down to the departmental or academic program level. Rankings research is broken into three categories: a
historical look at rankings of higher education institutions; the stability of rankings
over time and what factors influence this phenomenon; and the uniqueness of quality indicators at each institution and the difficulty this presents for wide-scale
comparisons among universities.
The third area of this review is the broad field of institutional change.
Literature highlights the usefulness of assessment rankings based on how effective
they may be at leading to institutional action. Given that institutional change theory is such a vast field, work that can be readily applied to the university setting is the
focal point. The literature is discussed in two sections, one focused on
organizational behavior and change in general, and then a second section more focused on institutional change as it relates to quality and rankings studies.
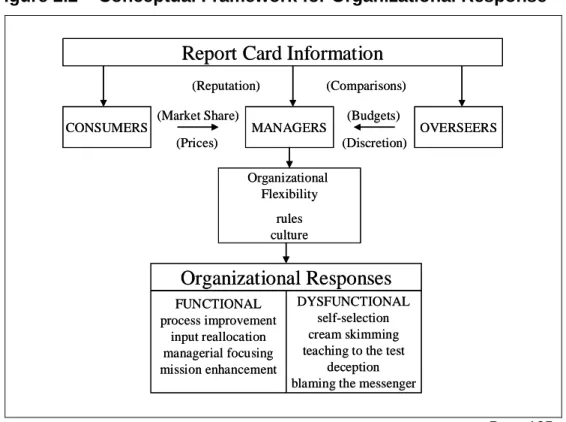
The most significant works relied on are Gormley and Weimer’s (1999)
conceptual framework for organizational response where they analyze best practices
surrounding assessment report cards across several sectors, including higher
education institutions; the study by Feldman, et al. (2002) on the adoption of use of a particular innovation or technology transfer strategy; Aldrich and Ruef’s work (2006)
on sustaining continuous change and assessment and quality practices; and Dill and Soo’s work (1999, 2005, 2006, 2007, 2010, and 2011) on the potentials for enacting
Throughout this chapter particular attention is paid to work focusing on
graduate education. The chapter concludes with a brief review and discussion about methodological techniques and issues of influence, which aided in the selection of
appropriate methods for this dissertation research. The theories and frameworks described in this chapter informed the development of the surveys and case studies
discussed in later chapters.
Higher Education Assessment
The first two sections of this Chapter provide literature and theory related to the research question, How do institutions define, monitor, and improve quality assessment? Assessment practices are growing in the higher education realm with focused attention on external pressures, accountability, and overall improvement practices for universities, both academically and for student support services.
External Influences
The concept of assessment generally will be highlighted, especially as a policy tool for social betterment. Societal gains result if critical, timely, and informing
evaluation and assessments are performed (Mark, Henry, and Julnes, 1999; Henry, 2000; Henry, 2003; Henry and Mark, 2003). Evaluation processes evolve through
three stages: determining the common good, selecting a course of action, and adapting the course of action. Emphasizing the “paradox of persuasion”, or the idea that evaluation must balance support of broad social goals yet not be the ultimate
Both direct and indirect influences impact the decisions and practices of organizations. The ways in which priorities and change processes at universities are influenced by external factors, such as the NRC study and subsequent focus on
graduate education nationally. Organizations aware of impending evaluations, or rankings and quality studies, will implement actions and make decisions driven by
appropriate and potentially inappropriate responses.
Research focused on general higher education assessment provides insight into why universities may in fact implement changes as a result of rankings studies.
One of the most critical elements surrounding action and the assessment of higher education is the heavy involvement by the federal government (Vaughn, 2002).
Federal and state governments fund major portions of the higher education enterprise in the United States through student financial aid and the support of research endeavors via grants, fellowships, and training opportunities. Even in
difficult budget times, this support remains in place, though pressures do continue to mount at both the state and federal levels. In some corners governmental support
for higher education is increasing, at least in the balance between federal research support and state budgetary support for public institutions.
Increasing pressures then follow for institutions to justify their use of funds
through accountability measures. Access to higher education has expanded in large part due to an appreciation for its impact on the broader economy and societal
increasingly affordability, standards are expected of universities (Srikanthan and Dalyrymple, 2007; Massy, 2013).
While the government and public’s desire to evaluate educational programs
and spending may be understandable, care must be taken to ensure the government can assure quality of educational initiatives and institutions without inserting itself too
broadly into long-standing academic affairs values (Vaughn, 2002; Wellman, 2003). Accreditation practices and indirect measures of quality through data collection and dissemination are becoming increasingly popular in calls for reform and openness.
In a challenge to the traditional role of higher education, Alexander (2000) states, “Once it has been established that the primary purpose of higher education is to
serve the economy, then it becomes the responsibility of the state to ensure that the institution is held accountable in successfully achieving this task” (page 427). While an acknowledgment of public accountability is appropriate, higher education as an
institution must also retain its core principles to educate students broadly and engage in cooperative relationships with the public and governments. Researchers
call on the higher education community to become more actively engaged in identifying and assessing quality indicators lest risk losing all authority to rankings studies, valid or not (Hazelkorn, 2013).
Agency theory can be used as a key framework for examining the university-government relationship (Kivisto, 2007 and 2008). Information asymmetry and goal
predict that governments as principals do not trust universities as agents because they can act opportunistically – shirking, pursuing only prestige, distorting data – if they are not held accountable for quality and resources. Thus governments have
developed output-based governance tools to measure quality, focusing on metrics like graduation rates, first placement data, and debt levels to look at higher
education in a cost-benefit lens. Also, governmental regulation and intervention ensues (Kivisto and Holtta, 2008). At the undergraduate level, the division between the purchaser and consumer of higher education can increase information
asymmetry (i.e., parents who pay their children’s tuition). It could be argued that at the graduate level, this becomes even more complicated – both because some
graduate and professional students are payers and consumers, and at the same time some graduate students receive support from the universities themselves. Principal-agent theory could also be used to view how quality ratings and
information asymmetries can impact knowledge about a campus and its educational offerings (Kivisto and Holtta, 2008). Some inputs assume that high-quality research
is correlated with robust graduate programs or higher doctoral student demand. Yet conflicting information about output quality and the possibility of gaming the rankings process can lead to different interpretations of measurement information. But even if
more information is publicly available, questions still exist about how to weight the information and ensure the comprehensiveness, validity, and reliability of the
findings. More efforts are needed to understand these trade-offs and improve the data available to the universities, which in turn becomes the basis for their
Beyond issues of funding, such factors are also key in the increased push for higher education accountability and measurement of student learning outcomes by government and policymakers (Shavelson, 2010). Universities are increasingly
being asked to establish goals on quality and performance, provide the support and resources to assess those goals, and engage in feedback loops to assure
improvement over time. While continuous evaluation of student learning outcomes for Shavelson is more of a focus for accountability and accreditation practices, lessons can be learned regarding overall quality enhancements and learning on
campuses. In particular, both lines of inquiry require institutional leadership. They also become more effective with centralized structures and resources to support
data collection and analysis. These types of practices become institutionalized over time, embedding themselves in the culture and expectations of the campus
community.
Similarly, an openness to change and faculty engagement are critical both for student assessment as well as program and institutional change processes.
Graduate education has only recently started to deal head-on with accreditation and program review emphases on student learning outcomes. Even more so than undergraduate learning, graduate education has historically been faced with
long-standing perceptions about successful outcomes, many of which are being called into question as US competitiveness appears to weaken and traditional job markets