Direct identification of base-paired RNA nucleotides
by correlated chemical probing
ANDREY KROKHOTIN,1,3ANTHONY M. MUSTOE,2,3KEVIN M. WEEKS,2and NIKOLAY V. DOKHOLYAN1 1Department of Biochemistry and Biophysics,2Department of Chemistry, University of North Carolina at Chapel Hill, Chapel Hill, North Carolina 27599, USA
ABSTRACT
Many RNA molecules fold into complex secondary and tertiary structures that play critical roles in biological function. Among the best-established methods for examining RNA structure are chemical probing experiments, which can report on local nucleotide structure in a concise and extensible manner. While probing data are highly useful for inferring overall RNA secondary structure, these data do not directly measure through-space base-pairing interactions. We recently introduced an approach for single-molecule correlated chemical probing with dimethyl sulfate (DMS) that measures RNA interaction groups by mutational profiling (RING-MaP). RING-MaP experiments reveal diverse through-space interactions corresponding to both secondary and tertiary structure. Here we develop a framework for using RING-MaP data to directly and robustly identify canonical base pairs in RNA. When applied to three representative RNAs, this framework identified 20%–50% of accepted base pairs with a <10% false discovery rate, allowing detection of 88% of duplexes containing four or more base pairs, including pseudoknotted pairs. We further show that base pairs determined from RING-MaP analysis significantly improve secondary structure modeling. RING-MaP-based correlated chemical probing represents a direct, experimentally concise, and accurate approach for detection of individual base pairs and helices and should greatly facilitate structure modeling for complex RNAs.
Keywords: RNA secondary structure; chemical probing; pseudoknots; structure prediction; DMS reactivity
INTRODUCTION
RNA molecules play diverse and central roles in coordinating gene expression, ranging from regulating transcription, splic-ing, and translation, to directing cellular localization and RNA turnover. These regulatory functions are critically de-pendent on the ability of RNAs to fold back on themselves to form complex secondary structures (Cech and Steitz 2014; Mortimer et al. 2014). Accurately determining the set of Watson-Crick base pairs that define RNA secondary struc-ture is therefore fundamental to understanding RNA biolog-ical function and is also an essential first step in defining global tertiary structure (Hajdin et al. 2010; Bailor et al. 2011; Magnus et al. 2014; Krokhotin et al. 2015).
In general, correctly defining RNA secondary structure re-quires experimental information. Sequence covariation anal-ysis remains the gold standard for secondary structure modeling but can be applied to only a very limited set of RNAs (Seetin and Mathews 2012). Computational approach-es based on optimization of empirical free energy functions (Zuker 2003; Reuter and Mathews 2010; Lorenz et al. 2011)
work well for RNAs shorter than roughly 50 nt, but have limited accuracy for longer and complexly folded RNAs. In addition, experiment-free approaches are insensitive to func-tionally important changes in structure induced by varied solution conditions or binding by small molecule or macro-molecular ligands.
Chemical probing experiments are among the most pow-erful and widely applicable approaches for directly interro-gating the structure of an RNA molecule. The most useful reagents react specifically with single-stranded or conforma-tionally flexible nucleotides. Nucleotide-resolution reactivity information can then be used to guide computational struc-ture modeling toward a single secondary strucstruc-ture or collec-tion of structures most compatible with the experimental data (Deigan et al. 2009; Weeks 2010). Methods based on these one-dimensional probing data are quite powerful and have been used to derive the structures of a variety of RNAs with good-to-excellent accuracy (Hajdin et al. 2013; Leonard et al. 2013; Siegfried et al. 2014). Data from multiple
3These authors contributed equally to this work.
Corresponding authors: [email protected], [email protected]
Article is online at http://www.rnajournal.org/cgi/doi/10.1261/rna.058586. 116.
reagents with complementary structural specificities can also be combined to achieve increased modeling accuracy (Rice et al. 2014; Sloma and Mathews 2015).
A key limitation, however, is that secondary structures de-rived from one-dimensional probing data are not visualized directly, but rather are inferred based on compatibility with the observed reactivity profile. Sometimes, multiple base-pairing patterns are nearly equally compatible with struc-ture-probing data. Individual helices and base pairs can be confirmed by repeating probing experiments on RNAs con-taining point mutations (Duncan and Weeks 2008; Kladwang and Das 2010), but these mutate-and-probe approaches are laborious and not widely pursued. Diverse innovative ap-proaches that seek to directly identify RNA duplexes using massively parallel sequencing have been recently proposed (Weidmann et al. 2016). Validation of these approaches is ongoing, but it is likely that biases from experimental and se-quencing-library preparation steps will limit these methods to qualitative structure mapping (Weeks 2015). Thus, there currently exists a tension between experimental tractability versus accuracy and confidence in the derived structure models.
Recently, we developed a new chemical probing strategy termed mutational profiling (MaP) that represents an impor-tant experimental and conceptual advance in nucleic acid structure probing. In MaP, chemically modified nucleotides are detected when a reverse transcriptase reads through the modification site while simultaneously incorporating a non-complementary nucleotide or causing a deletion in the synthesized cDNA (Siegfried et al. 2014). Modification sites are thus recorded as internal sequence changes that can be efficiently read out by massively parallel sequencing. Importantly, this strategy allows for the detection of multiple chemical modifications in a single RNA molecule, and there-fore detection of correlated modification events that report on RNA interaction groups, or RINGs (Homan et al. 2014). In initial proof-of-principle studies using the reagent dimethyl sulfate (DMS), RING-MaP experiments were shown to detect diverse through-space secondary and tertiary structure interactions in RNA (Homan et al. 2014).
Here we adapt the RING-MaP strategy to enable compre-hensive, direct identification of Watson-Crick base pairs. In our original RING-MaP study, analysis was restricted to adenosine (A) and cytidine (C) nucleotides, which were pre-viously thought to be the only nucleotides with readily detectable DMS modification. In addition, RING-MaP ex-periments yield very dense networks of interconnected RINGs that are challenging to interpret, precluding straight-forward assignment of individual RINGs to secondary versus tertiary structure interactions. The density of interactions concealed the potential utility of RING-MaP experiments for de novo secondary-structure determination. We show for the first time that DMS treatment consistently yields detectable modifications at guanosine (G) and uridine (U) nucleotides. Through correlation analysis and development
of a novel filtering algorithm, we then demonstrate that RING-MaP data can be used to directly and specifically detect Watson-Crick base-pairing interactions, facilitating de novo RNA structure modeling.
RESULTS
DMS reacts with all four RNA nucleotides
DMS is a classic and widely used RNA structure-probing reagent that is conventionally used to monitor the pairing status of A and C nucleotides (Peattie and Gilbert 1980). In particular, DMS reacts to form methyl adducts at solvent-accessible N1 and N3 positions on the Watson-Crick faces of A and C nucleotides, respectively. These adducts can be readily detected by reverse-transcription analysis, as the modification at the Watson-Crick face induces premature cDNA termination or, in the MaP strategy, incorporation of a noncomplementary nucleotide. While generally ignored, DMS also is known to methylate both G and U residues (Lawley and Shah 1972; Kusmierek and Singer 1976; Chanǵ and Lee 1981; Ashworth et al. 1985). For example, DMS read-ily reacts with the N7 of the imidazole ring of G; however, N7 adducts do not efficiently interfere with conventional reverse transcription and are thus not typically detected in probing experiments (Ehresmann et al. 1987). G nucleotides can also be methylated at the N1 and N3 positions, and U nucle-otides can be methylated at the N3 position, likely through mechanisms that involve transient base deprotonation or tautomerization (Lawley and Shah 1972; Kusmierek and́ Singer 1976; Chang and Lee 1981; Ashworth et al. 1985). These modifications are at the Watson-Crick face and thus should be detectable by reverse-transcription analysis. Indeed, DMS-reactive U and G positions are occasionally ob-served (Konforti et al. 1998; Bayfield et al. 2001). However, for most G and U nucleotides, the modification rate of N1 and N3 positions is below the detection sensitivity of tradi-tional termination-based reverse-transcription analysis.
Watson-Crick base pairs exhibit strong RINGs
Given the success of the RING-MaP approach at detecting di-rect through-space interactions in RNA (Homan et al. 2014), we examined whether RING-MaP data could be used to comprehensively identify Watson-Crick base pairs. While Watson-Crick-paired nucleotides are protected from DMS modification at equilibrium, transient base-pair melting should expose paired nucleotides to DMS modification in a concerted manner, giving rise to correlated modifications measurable via RING-MaP. DMS adducts also destabilize base pairs, and thus chance modification of one nucleotide in a base pair will directly increase the probability that the partner nucleotide is subsequently modified. Lowly populat-ed alternative conformations and unfoldpopulat-ed states may also expose paired nucleotides to modification in a concerted manner.
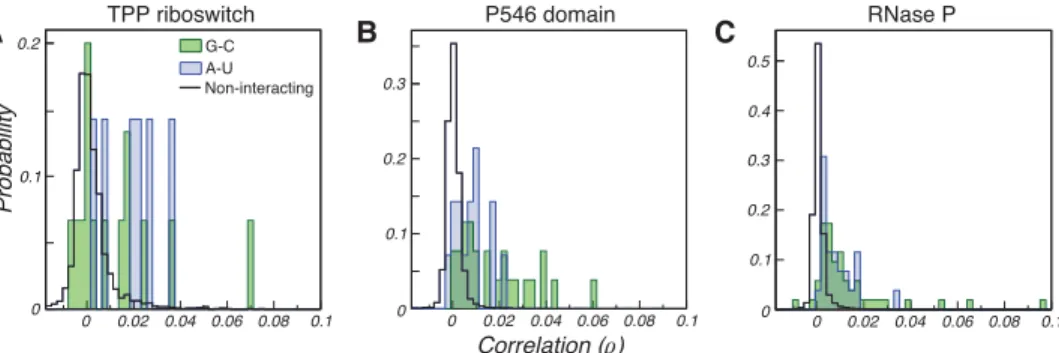
Supporting the hypothesis that base-paired nucleotides undergo correlated DMS modification, we observe distinctly stronger correlated mutations between Watson-Crick-paired nucleotides compared to random (noninteracting) A–U and C–G nucleotides (Fig. 1). G–C base-paired nucleotides ex-hibit moderately stronger correlations, on average, than A–U base-paired nucleotides, likely reflecting the lower mod-ification rate of U nucleotides compared to G nucleotides. Together, this analysis indicates that Watson-Crick pairs give rise to detectable correlated mutations (RINGs), suggest-ing that RING-MaP data could facilitate direct visualization of RNA secondary structure.
Base-pair detection using filtered correlation analysis
In order to be useful, de novo structure determination ap-proaches must satisfy two criteria: The method (i) must pos-sess high sensitivity and thereby identify a usefully large fraction of true base pairs, and (ii) must minimize the num-ber of potentially misleading false-positive predictions. It is clear that strong RING correlations are indicative of true base pairs (Fig. 1). Thus, a straightforward strategy for specif-ically identifying base pairs would be to search for A–U and G–C pairs that exhibit particularly strong internucleotide
correlations (for example, pairs with ρ> 0.04). This ap-proach is analogous to the strategy previously used to deter-mine through-space tertiary interactions from RING-MaP data (Homan et al. 2014). However, few base pairs exhibit strong correlations, and this strategy is thus limited by low sensitivity. Most Watson-Crick pairs exhibit relatively weak correlations that overlap theρ-distribution observed for ran-dom noninteracting nucleotide pairs, making it difficult to increase sensitivity without compromising specificity. We therefore developed a two-step algorithm that harnesses fun-damental principles of RNA secondary structure to robustly distinguish true correlations from false-positive noise, yield-ing de novo base-pair detection with both high sensitivity (sens) and low false discovery rates (FDR).
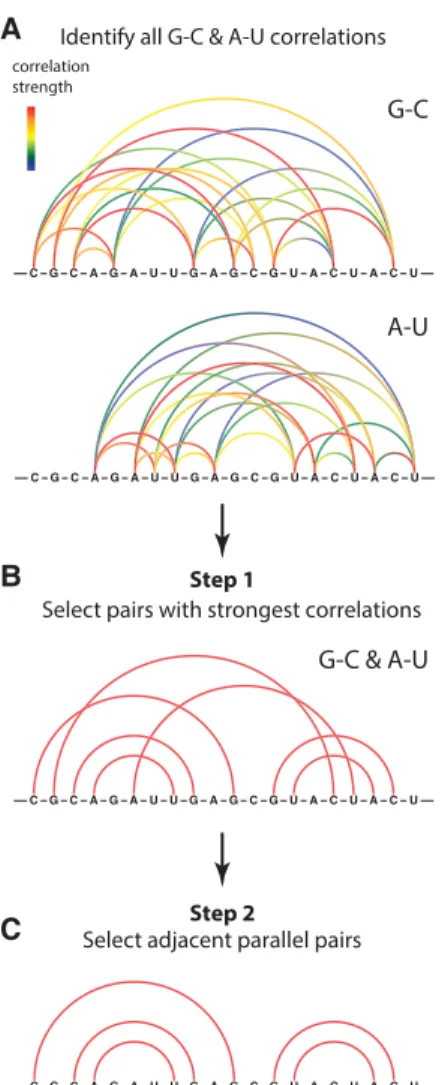
Beginning from the set of all RING correlations between A–U and G–C nucleotides (Fig. 2A), we select the strongest correlations measured for each nucleotide (Fig. 2B; and see Materials and Methods). This filtering is motivated by the hy-pothesis that paired nucleotides should exhibit the strongest RINGs to their direct Watson-Crick pairing partner. In the second step, we filter out isolated A–U and G–C correlations, selecting only those correlations that are supported by other adjacent parallel correlations (Fig. 2C). This second step rec-ognizes that base pairs do not occur in isolation but rather as duplexes containing multiple pairs. Parallel correlations that reproduce this inherent property of real RNA secondary structures are unlikely to arise by chance.
This two-step algorithm does a good job of directly iden-tifying Watson-Crick-paired nucleotides from RING-MaP data. We recovered 15%, 49%, and 43% of Watson-Crick base pairs in the TPP riboswitch, P546 domain, and RNase P structures, respectively (Fig. 3). Strikingly, we detected multiple base pairs in both duplexes of the RNase P pseudo-knot (Fig. 3B, boxed). If we consider detection of at least two base pairs to represent positive detection of a duplex, the al-gorithm exhibits excellent sensitivity for detecting duplexes containing four or more canonical base pairs (14/16 = 88%) and moderate sensitivity overall (17/32 = 53% for duplexes containing two or more base pairs) (Fig. 3B). The lower sen-sitivity for detecting pairs in duplexes that are short or that contain G–U pairs is consistent with reduced duplex stability,
A B C
with nucleotides within such duplexes less likely to be modi-fied in a correlated manner. Importantly, the false discovery rates were 0%, 10%, and 0% for the TPP riboswitch, P546 domain, and RNase P, respectively. The two false-positive pairs identified in the P546 domain correspond to single-nucleotide register shifts adjacent to internal loops, which constitute minimal errors (Fig. 3B). Note that the ability to discriminate against false positives is critically dependent on filtering out isolated correlations (Fig. 3A). Thus, via simple filtering of RING-MaP data, we detect Watson-Crick base pairs de novo with high sensitivity and near-perfect specificity.
Base-pair restraints enable high-accuracy secondary structure modeling
The percentages of base pairs identified by our algorithm are insufficient to define complete RNA secondary structures.
We therefore explored the potential of using RING-MaP-identified base pairs to restrain thermodynamic secondary structure prediction algorithms. Each identified pair was giv-en a small giv-energy bonus (−1 kcal/mol) during minimum free modeling with the ShapeKnots algorithm of RNAstructure, which can predict pseudoknots (Hajdin et al. 2013).
For the TPP riboswitch and P546 domain, all RING-MaP-identified base pairs were predicted in the absence of data, and hence applying energy bonuses to these pairs did not im-prove secondary structure modeling (Supplemental Fig. S1). In the P546 domain, two incorrect RING-MaP-identified pairs were given energy bonuses, but the thermodynamic al-gorithm correctly distinguished the accepted pairing arrange-ment as more stable.
For RNase P, base-pair bonuses dramatically increased modeling accuracy (Fig. 4). Whereas the RNase P model Identify all G-C & A-U correlations
correlation strength
G-C
A-U
Select pairs with strongest correlations
Select adjacent parallel pairs
G-C & A-U Step 1
Step 2
A
B
C
FIGURE 2. Two-step algorithm for detecting Watson-Crick RNA base pairs using RING-MaP correlated chemical probing data. (A) RING correlations are initially computed for all possible A–U and G–C pairs. (B) In Step 1, the strongest correlation of each nucleotide is selected. (C) In Step 2, correlated pairs that are adjacent to other strongly correlated pairs are selected.
sens: 32/75 = 43% FDR: 0/32 = 0% sens: 19/39 = 49%
FDR: 2/21 = 9.5% sens: 3/20 = 15%
FDR: 0/3 = 0%
sens: 40/75 = 53% FDR: 24/64 = 38% sens: 25/39 = 64%
FDR: 13/38 = 34% sens: 8/20 = 40%
FDR: 5/13 = 38%
RNase P P546 domain
TPP riboswitch
Step 1 only
Step 1 and Step 2
A
B
obtained from naïve secondary structure prediction misses the critical central pseudoknot, the RING-guided model re-covered the pseudoknot and had an overall sens of 94% and FDR of 11%, significantly outperforming the sens of 75.7% and the FDR of 20.2% reported in previous experi-ment-informed modeling studies (Hajdin et al. 2013). To our knowledge, this RING-guided model represents the first time the RNase P pseudoknot has been identified successfully in the absence of sequence covariation analysis. The errors in our RING-guided model are minor—a short extension of the pseudoknot is missed, several apical loops are modeled with additional pairs, and two duplexes exhibit minor register shifts (Fig. 4). In sum, the RING-guided model captures the essential features of the RNase P topology and demon-strates the potential of RING-MaP data for enabling high-ac-curacy secondary structure modeling.
Relationship between base-pair detection and sequencing depth
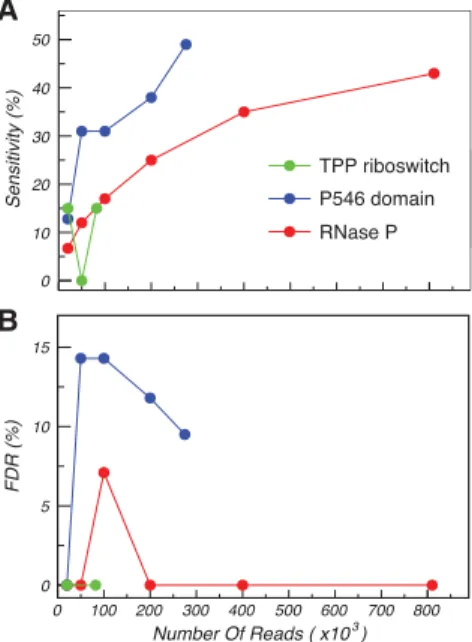
A key parameter in all sequencing-based structure-probing experiments is the minimum read depth required to obtain accurate measurements (Siegfried et al. 2014). Given that our base-pair detection algorithm depends on detecting cor-relations between weakly reactive nucleotides, we expected a strong dependence on read depth. We explored this depen-dence by varying the number of reads used in the correlation-al ancorrelation-alysis for each RNA (Fig. 5;Supplemental Fig. S2). At the smallest tested read depth of 20,000, the sensitivity of our base-pair detection algorithm dropped to∼10% for all three RNAs. At read depths of 200,000, sensitivity increased to >25%, and 400,000 reads were needed to reliably detect the RNase P pseudoknot (Supplemental Fig. S2). This analysis suggests that low read depth is the source of the low sensitiv-ity of base-pair detection in the TPP riboswitch. Importantly,
although sensitivity depended strongly on read depth, the false discovery rate re-mained relatively constant at 0%–15%. As above, the few false positives corre-spond to minor local register shift errors. Overall, this analysis indicates that, under the experimental conditions used here, read depths of >200,000 are necessary to enable base-pair detection at a level that is useful for secondary structure hy-pothesis generation.
Increased experimental noise prevents base-pair detection in long RNAs
To further evaluate our base-pair detec-tion approach, we analyzed DMS RING-MaP data collected on the E. coli 16S and 23S ribosomal RNAs (rRNAs). These rRNA data sets were obtained using a random-primed reverse-transcription strategy, in which individual MaP reads begin and terminate at random positions, tiling across each rRNA molecule. This contrasts with the directed-priming ap-proach used for the shorter RNAs discussed above, for which each sequencing read extended across the entire RNA. Both the increased length (1542 nt for the 16S rRNA and 2904 nt for the 23S rRNA) and random-primed strategy make base-pair detection significantly more challenging. Despite sequencing depths in excess of 1 million reads, our algorithm failed to identify any Watson-Crick base pairs in either the 16S or 23S rRNAs. Although this result represents a failure FIGURE 4. Secondary structure of RNase P catalytic domain predicted using thermodynamic
minimum free energy modeling without and with RING-MaP restraints. Green arcs indicate cor-rectly predicted pairs, purple arcs are incorcor-rectly predicted pairs, and red arcs are true pairs miss-ing in the predicted model. Blue arcs indicate enforced RING-MaP base-pairmiss-ing restraints.
A
B
with respect to base-pair detection sensitivity, the absence of false positives is a notable success and consistent with the low false discovery rate observed in the TPP riboswitch, P546 domain, and RNase P RNAs (Fig. 5). Thus, these analyses suggest that RING-based base-pair detection can be applied safely to diverse data sets without concern for false positives. Detailed analysis of the 16S and 23S rRNA data sets revealed that, on average, Watson-Crick-paired nucleotides are more strongly correlated than random noninteracting nucleotide pairs (P-value <10−10 by the Kolmogorov–Smirnov test;
Supplemental Fig. S3). However, base-paired nucleotides
are much more weakly correlated than was observed in the shorter RNAs. There are several potential explanations for this reduction in correlation strength. First, the use of ran-dom priming during reverse transcription and the subsequent fragmented-library preparation may have introduced addi-tional mutaaddi-tional noise relative to the directed-priming strategy used for shorter RNAs. Second, while the MaP proto-col allows reverse-transcriptase enzymes to read-through modified nucleotides, stretches of RNA with multiple DMS modifications are less efficient templates for reverse transcrip-tion and more likely to experience premature terminatranscrip-tion. Co-mutation events may therefore be underrepresented in the randomly primed rRNA reads. In contrast, directed prim-ing selects for full-length extension products, minimizprim-ing re-verse-transcription biases. Together, increased mutational noise and reverse transcription biases may overwhelm the RING signal of Watson-Crick pairs in the rRNA data sets. Finally, the increased length, complex higher order struc-ture, and conformational dynamics of rRNA molecules may introduce additional correlational relationships between nu-cleotides that mask those arising from Watson-Crick base pairs.
DISCUSSION
Upon reanalysis of prior RING-MaP data sets (Homan et al. 2014), we observed that DMS modification of G and U nucle-otides can be detected via mutational profiling (MaP). Based on these observations, we extend the RING-MaP strategy to enable direct identification of Watson-Crick base pairs. Studies of three representative model RNAs demonstrated that our approach has useful sensitivity and outstanding specificity, suggesting that RING-MaP experiments may be broadly useful as a strategy for directly visualizing RNA sec-ondary structure.
Conceptually, our strategy shares some similarity to the mutate-and-map approach (Kladwang and Das 2010; Kladwang et al. 2011), which also detects correlated changes in nucleotide reactivity that occur between paired nucleo-tides. The mutate-and-map approach uses mutations to disrupt base pairs and requires collection of experimental data on hundreds of single-nucleotide variants. Thus, mu-tate-and-map offers high base-pair detection sensitivity, but requires substantially greater experimental overhead and is
limited to synthetic RNAs. In contrast, the RING-MaP strategy requires a single DMS probing experiment on a single RNA, and can be performed on endogenous RNAs in living cells.
The primary limitations of our approach—modest sensi-tivity and high sequencing depth requirements—are func-tions of the low rate of DMS modification of G and U nucleotides (on average <0.003). Until now, DMS modifica-tion of G and U nucleotides has been largely undetectable and ignored. Two factors explain our ability to detect these DMS modifications. First, we use significantly higher reagent con-centrations and improved buffer conditions to achieve mod-ification rates that are an order of magnitude greater than those in typical DMS probing experiments (Homan et al. 2014). Second, the MaP strategy offers currently unparalleled detection sensitivity, allowing quantification of weak signals that would be indistinguishable from noise by traditional re-verse-transcriptase termination-detection methods. While these experimental improvements allow us to reliably detect correlated modifications in A–U and G–C pairs in small RNAs, even modest degradation of data quality inhibits cor-relation detection in the 16S and 23S rRNAs. Developing im-proved reagents that react efficiently with all four nucleotides should alleviate these limitations, and thus stands as a trans-formative goal for future studies.
Even with improvements in sensitivity, we do not expect direct base-pair detection to recover 100% of the base pairs in an RNA. Currently, we ignore G–U pairs due to a lack of sensitivity and high false-positive prediction rates, but these pairs are integral to many RNA helices. In addition, unstable base pairs may not exhibit correlated modifications and, con-versely, base pairs that are highly stable may fail to give detectable modification signals. We demonstrate that incom-plete sensitivity can be offset by using RING-MaP-identified base pairs to restrain thermodynamic secondary structure prediction algorithms. This combined approach mirrors the strategy used in both traditional SHAPE-directed model-ing and mutate-and-map modelmodel-ing. For RNase P, the com-bined approach worked particularly well, yielding a model that closely recapitulates the pseudoknotted accepted struc-ture and significantly outperforming approaches that only use one-dimensional probing data (Fig. 4). Nevertheless, high accuracy structure modeling requires sufficient and dis-persed RING restraints, with pseudoknot-spanning RINGs being particularly important for achieving an accurate RNase P model. We explored whether inclusion of one-di-mensional DMS reactivity restraints could resolve the small errors in our RING-guided models, but this yielded negligi-ble improvements in model accuracy (not shown). More sen-sitive one-dimensional probing data, such as that obtained from standard or differential SHAPE experiments (Rice et al. 2014), may prove more useful in further improving model accuracy.
long-sought goal in RNA structure analysis. Our RING-MaP-based approach offers a powerful complement to existing structure probing and computational modeling strategies, and we envision key roles for RING-MaP analyses in both validation and de novo determination of RNA secondary structure.
MATERIALS AND METHODS
Data collection and preprocessing
Data for theE. colithiamine pyrophosphate (TPP) riboswitch, the
P546 domain of theT. thermophilagroup I intron, and the catalytic
domain ofB. stearothermophilusRNase P were collected previously
(Homan et al. 2014). 16S and 23S rRNAs were isolated fromE. coli
K12 MG1655 cells at mid-log phase using nondenaturing conditions (Deigan et al. 2009). RNA was exchanged into a folding buffer con-taining 300 mM sodium cacodylate (pH 7.0), 200 mM potassium
acetate (pH 7.0), and 10 mM MgCl2using a gravity-flow column
(PD-10 Sephadex, GE Healthcare), and incubated at 37°C for 20 min. DMS probing was performed at 37°C for 6 min exactly as pre-viously described (Homan et al. 2014). Reverse transcription was performed using random nonamer primers (Smola et al. 2015) via an updated MaP protocol that includes the addition of betaine and stepped temperature cycles to improve reverse-transcriptase processivity (GM Rice and KM Weeks, in prep.). Sequencing librar-ies were prepared via random-primed tagmentation (Smola et al. 2015) and sequenced on an Illumina NextSeq instrument.
Sequencing data for the TPP riboswitch, P546 domain, and RNase P RNAs were trimmed, aligned, quality filtered, and convert-ed to binary strings exactly as previously describconvert-ed (Homan et al. 2014). For the rRNA data sets, sequencing reads were pretrimmed using Sickle (https://github.com/najoshi/sickle), followed by align-ment and quality filtering (Phred >20) using version 1.2 of the ShapeMapper pipeline (Siegfried et al. 2014). Filtered aligned reads
were then converted into binary strings, with“1”representing
mu-tated positions and“0”representing all other positions.
Correlation analysis
Correlations between nucleotides were computed using the covari-ance matrix
cov(i,j) = 1 N
N
k=1
(nk
i −ni) nkj −nj
,
whereiandjdenote two positions in the RNA primary sequence,kis
the index of an individual sequencing read,nk
i(nkj)is the binary value
of the read at positioni(j), Nis the total number of sequencing
reads, andndenotes the average over all reads. Pearson correlation
coefficientsρijwere then computed from the covariance matrix
rij=
cov(i,j)
sisj ,
whereσi(σj) is the standard deviation ofni(nj). We note that for the
dichotomous data considered here,ρijare equivalent toϕijvalues
computed from contingency table analysis (as used in Homan et al. 2014). We also explored the potential of using partial
correla-tions versus the ordinary correlacorrela-tions used here but observed no im-provement in base-pair detection (not shown).
Calculation of sensitivity and false discovery rate
Sensitivity (sens) and false discovery rate (FDR) are defined as
sens= TP
TP+FN,
FDR= FP
TP+FP,
whereTP(true positive) is the number of correctly identified A–U
and G–C base pairs, FN(false negative) is the number of A–U
and G–C pairs in the accepted RNA structure that are not identified
by the algorithm, and FP (false positive) is the number of incorrectly
predicted A–U and G–C pairs that do not exist in the accepted
structure. No experimental data are available for the first three and last two nucleotides of the three short RNAs, and base pairs in-volving these nucleotides were excluded from sens and FDR calculations.
Base-pair detection algorithm
We identify A–U and C–G pairs using the following two-step
algo-rithm (Fig. 2):
1. We identify tentative pairing partners by searching for
comple-mentary (A–U or G–C) nucleotidesiandjthat are more strongly
correlated with each other than any other nucleotide in the mol-ecule:ρij≥ρikandρij≥ρlj, whereρijis the correlation coefficient
between nucleotides (i,j), andkandlare any other nucleotides in
the sequence complementary toiandj, respectively.
2. Correlated pairs identified in step 1 were then filtered by
requir-ing that each (i,j) correlation satisfy one of two selection rules:
(a) another correlation exists at position (i+ 1,j−1) or (i−1,
j+ 1), or (b) two correlations exist at positions (i+ 2, j−2)
and (i+ 3,j−3), or at positions (i−2,j+ 2) and (i−3,j+ 3)
(see Fig. 2C). This filter eliminates isolated correlations.
Secondary structure modeling
Minimum free energy modeling was performed using the ShapeKnots algorithm of RNAstructure (v5.8) using default param-eters (Hajdin et al. 2013). Base-pair energy bonuses were
imple-mented by updating the ShapeKnots code to accept the “-x”
experimental pair bonus option previously implemented in the Fold executable of RNAstructure (Kladwang et al. 2011). Each
RING-MaP-identified pair was given a−1 kcal/mol energy bonus,
with all other pairs assigned bonuses of 0 kcal/mol. Bonuses are sin-gly applied to edge base pairs and doubly applied to internal base pairs. Additional modeling with one-dimensional DMS reactivity
restraints was performed using the“-dms”option of ShapeKnots
(Cordero et al. 2012). DMS reactivities were computed by subtract-ing the background mutation rate measured in no-reagent control samples (Homan et al. 2014) and normalizing as previously de-scribed (Deigan et al. 2009). Sensitivity and FDR calculations for
minimum free energy models included G–U pairs and allowed for
SUPPLEMENTAL MATERIAL
Supplemental material is available for this article.
ACKNOWLEDGMENTS
This work was funded by the National Institutes of Health (GM 064803). A.M.M. is an Arnold O. Beckman Postdoctoral Fellow.
Received August 3, 2016; accepted October 28, 2016.
REFERENCES
Ashworth DJ, Baird WM, Chang CJ, Ciupek JD, Busch KL, Cooks RG. 1985. Chemical modification of nucleic acids. Methylation of calf thymus DNA investigated by mass spectrometry and liquid chroma-tography.Biomed Mass Spectrom12:309–318.
Bailor MH, Mustoe AM, Brooks CL III, Al-Hashimi HM. 2011. Topological constraints: using RNA secondary structure to model 3D conformation, folding pathways, and dynamic adaptation.Curr Opin Struct Biol21:296–305.
Bayfield MA, Dahlberg AE, Schulmeister U, Dorner S, Barta A. 2001. A conformational change in the ribosomal peptidyl transferase center upon active/inactive transition.Proc Natl Acad Sci98:10096–10101. Cech TR, Steitz JA. 2014. The noncoding RNA revolution—trashing old
rules to forge new ones.Cell157:77–94.
Chang C-J, Lee C-G. 1981. Chemical modification of ribonucleic-acid —a direct study by C-13 nuclear magnetic-resonance spectroscopy. Biochemistry20:2657–2661.
Cordero P, Kladwang W, VanLang CC, Das R. 2012. Quantitative dimethyl sulfate mapping for automated RNA secondary structure inference.Biochemistry51:7037–7039.
Deigan KE, Li TW, Mathews DH, Weeks KM. 2009. Accurate SHAPE-directed RNA structure determination. Proc Natl Acad Sci 106: 97–102.
Duncan CDS, Weeks KM. 2008. SHAPE analysis of long-range interac-tions reveals extensive and thermodynamically preferred misfolding in a fragile group I intron RNA.Biochemistry47:8504–8513. Ehresmann C, Baudin F, Mougel M, Romby P, Ebel JP, Ehresmann B.
1987. Probing the structure of RNAs in solution.Nucleic Acids Res 15:9109–9128.
Hajdin CE, Ding F, Dokholyan NV, Weeks KM. 2010. On the signifi-cance of an RNA tertiary structure prediction.RNA16:1340–1349. Hajdin CE, Bellaousov S, Huggins W, Leonard CW, Mathews DH, Weeks KM. 2013. Accurate SHAPE-directed RNA secondary struc-ture modeling, including pseudoknots. Proc Natl Acad Sci 110: 5498–5503.
Homan PJ, Homan PJ, Favorov OV, Lavender CA, Kursun O, Ge X, Busan S, Dokholyan NV, Weeks KM. 2014. Single-molecule correlat-ed chemical probing of RNA.Proc Natl Acad Sci111:13858–13863. Kladwang W, Das R. 2010. A mutate-and-map strategy for inferring base
pairs in structured nucleic acids: proof of concept on a DNA/RNA helix.Biochemistry49:7414–7416.
Kladwang W, VanLang CC, Cordero P, Das R. 2011. A two-dimensional mutate-and-map strategy for non-coding RNA structure.Nat Chem
3:954–962.
Konforti BB, Liu Q, Pyle AM. 1998. A map of the binding site for cata-lytic domain 5 in the core of a group II intron ribozyme.EMBO J17: 7105–7117.
Krokhotin A, Houlihan K, Dokholyan NV. 2015. iFoldRNA v2: folding RNA with constraints.Bioinformatics31:2891–2893.
Kusmierek JT, Singer B. 1976. Sites of alkylation of poly(U) by agents of́ varying carcinogenicity and stability of products.Biochim Biophys Acta442:420–431.
Lawley PD, Shah SA. 1972. Methylation of ribonucleic acid by the car-cinogens dimethyl sulphate, N-methyl-N-nitrosourea and N-meth-yl-N′-nitro-N-nitrosoguanidine. Comparisons of chemical analyses at the nucleoside and base levels.Biochem J128:117–132. Leonard CW, Hajdin CE, Karabiber F, Mathews DH, Favorov OV,
Dokholyan NV, Weeks KM. 2013. Principles for understanding the accuracy of SHAPE-directed RNA structure modeling.Biochemistry
52:588–595.
Lorenz R, Bernhart SH, Höner Zu Siederdissen C, Tafer H, Flamm C, Stadler PF, Hofacker IL. 2011. ViennaRNA Package 2.0.Algorithms Mol Biol6:26.
Magnus M, Matelska D, Lach G, Chojnowski G, Boniecki MJ, Purta E, Dawson W, Dunin-Horkawicz S, Bujnicki JM. 2014. Computational modeling of RNA 3D structures, with the aid of experimental re-straints.RNA Biol11:522–536.
Mortimer SA, Kidwell MA, Doudna JA. 2014. Insights into RNA struc-ture and function from genome-wide studies.Nat Rev Genet 15: 469–479.
Peattie DA, Gilbert W. 1980. Chemical probes for higher-order struc-ture in RNA.Proc Natl Acad Sci77:4679–4682.
Reuter JS, Mathews DH. 2010. RNAstructure: software for RNA second-ary structure prediction and analysis.BMC Bioinformatics11:129. Rice GM, Leonard CW, Weeks KM. 2014. RNA secondary structure
modeling at consistent high accuracy using differential SHAPE. RNA20:846–854.
Seetin MG, Mathews DH. 2012. RNA structure prediction: an overview of methods.Methods Mol Biol905:99–122.
Siegfried NA, Busan S, Rice GM, Nelson JA, Weeks KM. 2014. RNA mo-tif discovery by SHAPE and mutational profiling (SHAPE-MaP). Nat Methods11:959–965.
Sloma MF, Mathews DH. 2015. Improving RNA secondary structure prediction with structure mapping data. Methods Enzymol 553: 91–114.
Smola MJ, Rice GM, Busan S, Siegfried NA, Weeks KM. 2015. Selective 2′-hydroxyl acylation analyzed by primer extension and mutational profiling (SHAPE-MaP) for direct, versatile and accurate RNA struc-ture analysis.Nat Protoc10:1643–1669.
Weeks KM. 2010. Advances in RNA structure analysis by chemical probing.Curr Opin Struct Biol20:295–304.
Weeks KM. 2015. Toward all RNA structures, concisely.Biopolymers
103:438–448.
Weidmann CA, Weidmann CA, Mustoe AM, Weeks KM. 2016. Direct duplex detection: an emerging tool in the RNA structure analysis toolbox.Trends Biochem Sci9:734–736.