FAMILY PLANNING CENTERS AND TEEN PREGNANCY: THE EFFECT OF QUANTITY AND PROVIDER TYPE
Risa Jean Griffin
A thesis submitted to the faculty of the University of North Carolina at
Chapel Hill in partial fulfillment of the requirements for the degree of Master of Arts in the Department of Sociology
Chapel Hill 2012
ii
ii
iii
iii
ABSTRACT
Risa Griffin: Family Planning Centers and Teen Pregnancy: The Effect of Quantity and Provider Type
(Under the direction of Kathleen Mullan Harris)
iv
iv
ACKNOWLEDGMENTS
v
v
TABLE OF CONTENTS
LIST OF TABLES ... vi
LIST OF FIGURES ... vii
Chapter I. INTRODUCTION ...1
II. PREVIOUS RESEARCH ...3
Teen Pregnancy ...3
Family Planning Centers in Developing Countries ...5
Effect of Proximity and Density of Services in the United States ...6
Provider Type...8
III. DATA AND METHODS ...11
Expected Effects ...11
Data ...12
Methods...17
IV. RESULTS ...21
V. DISCUSSION AND CONCLUSION ...26
Discussion ...26
Conclusion ...28
vi
vi
LIST OF TABLES Table
1. NLSY Retention Rates ...30
2. Demographic Characteristics of Female Respondents ages 16-19 in the 1997 NLSY (N=4385) ...31
3. County Characteristics ...32
4. State Policies ...33
5. Average Number of Publicly Funded Family Planning Centers in Respondents Counties of Residence by Year and Center Type ...34
6. Teen Pregnancies and Outcomes by Year ...35
7. Relative Risk of Teen Pregnancy, 1997-2003, with Household Income (in $10,000s) and Race Covariates, and tests for State Fixed Effects (Odds Ratios) ...36
7b. Relative Risk of Teen Pregnancy, 1997-2003, with Household Income (in $10,000s) and Race Covariates and State Fixed Effects (Odds Ratios) ...37
8a. Relative Risk of Teen Pregnancy for White Teens, 1997-2003 (Odds Ratios) ...38
8b. Relative Risk of Teen Pregnancy for Black Teens, 1997-2003 (Odds Ratios) ...39
8c. Relative Risk of Teen Preg. for Hispanic Teens, 1997-2003 (Odds Ratios) ...40
9a. Relative Risk of Teen Pregnancy by Income <=50% of Pov. Line, 1997-2003 (Odds Ratios) ...41
9b. Relative Risk of Teen Pregnancy by Income >50% to <=150% of Pov. Line, 1997-2003 (Odds Ratios) ...42
vii
vii
LIST OF FIGURES
Figure
CHAPTER ONE
INTRODUCTION
2
2
race? Do publicly funded family planning clinics have any effect on the disparity between teen pregnancy rates of white women, and the much higher rates of minorities? Finally, is there any variation in the effect of different types of family planning centers? Are some centers associated with a lower risk of teen pregnancy? Is there variation in the
CHAPTER TWO
PREVIOUS RESEARCH
TEEN PREGNANCY
Teen pregnancies in the US are generally unplanned and unintended. Overall, 82% of teen pregnancies are reported as unintended, and pregnancies to women under age twenty account for one-fifth of all unintended pregnancies (Guttmacher 2011).
4
4
women.
A number of public policies and government programs have attempted to manage the high rates of teen pregnancy in the US through addressing the issue of unmet need for contraceptives and reproductive health care, especially among low income, minority, and teen women. These programs have seen some success. Title X, which provides funding for comprehensive family planning and other related preventive health services, especially to low-income individuals, teens, and/or those without insurance, was instituted in 1970. During its 41 year tenure, the effects of Title X have been far reaching. As of 2011, one-fourth of all low income women receive their reproductive healthcare from Title X funded clinics, and researchers estimate that without the Title X program unintended pregnancy rates would be one-third higher than they are now (Cohen 2011). Medicaid, through State Family Planning Waivers, provides funding for contraceptives and reproductive healthcare for individuals who earn below a certain income (usually around less than 200% of the poverty line). Research has shown that these waivers, which are currently used in some form by 28 states, have a significant negative effect on teen pregnancy rates (Santelli and Kirby 2010).
5
5
increasing by 4% (Finn 2010). Declines in the pregnancy rate among black and Hispanic teens are not keeping up with the declines among white teens. Between 1990 and 2005, pregnancy rates among white teens dropped 50%, while rates to black teens fell 45% and to Hispanic teens 26% during the same period. Today, the US continues to experience teen pregnancy at far higher rates than other developed countries (Santelli and Melnikas 2010). Though many factors, including demographic shifts in the makeup of the US population, have likely contributed to both the decrease and leveling of teen pregnancy rates in the US, the efficacy of publicly funded family planning centers remains central to state and federal action.
FAMILY PLANNING CENTERS IN DEVELOPING COUNTRIES
Previous research has shown that women in developing countries who have access to modern contraceptives and reproductive health care, generally through family planning clinics, are more likely to use contraceptives, less likely to experience
unintended pregnancy, and have fewer births overall than their counterparts without access to contraceptives (Bertrand et al 1995; Entwisle et al 1997; Frankenburg et al 2009, Desai and Tarozzi 2011). Ease of transportation to facilities is another proximity related factor determined to affect contraceptive use (Entwisle et al 1997). In Indonesia, the presence of trained midwives in women‘s home village led to increased use of reproductive and maternity health care, with especially large impacts amongst lower income women (Frankenberg et al 2009). Across several African countries, family
6
6
1999). Despite these positive findings in developing countries, it is difficult to relate them to the United States context, where the density of services is much greater, and most women do have access to some form of transportation.
EFFECT OF PROXIMITY AND DENSITY OF SERVICES IN THE UNITED STATES Previous research in the US has shown that the availability and accessibility of services affects outcomes targeted by these facilities. Public services in the US are very rarely randomly distributed. Instead, placement decisions are made based on funding,
population characteristics, need, and public opinion (Keefer and Khemani 2005). This means, even though the US generally has a great deal more service providers per capita than most developing countries, there is often inequality in access to services amongst those with a need for said services. Research on the association between proximity to services and outcomes is especially rich in the field of public health. US veterans with spinal cord injuries and
disorders are more likely to use health services when they live closer to Veterans Affairs health care facility (LaVela et al 2004). Proximity to hospitals and availability of services at the closest hospital leads to much higher rates of utilization of cardiac revascularization services amongst patients who had been previously admitted with acute myocardial infarction (Gregory et al 2000).
7
7
birth control than women over 20. (Santelli et al 2009). Half of all unintended pregnancies occur to women who are using some form of contraceptive, at least intermittently (Frost and Darroch 2008). For these women who experience unintended pregnancy even while using some form of birth control, ignorance of correct use or lack of access to an ideal form of contraceptive for their lifestyles are often responsible. Access to publicly funded family clinics can aid in providing contraceptive services to teens, as well as education on how to correctly and safely use these services.
The pathways through which proximity to services affects outcomes are varied. Most obviously is the fact that closer services are cheaper and easier to access. If one has a shorter distance to travel, they can utilize the services with less expenditure of both money and time. Entwisle et al find that even the ease of transport (dirt road versus pathway, etc.) has an effect on how likely women are to use family planning services (1997). Using this logic, proximity, and the resulting reduction in costs in time and money, would have a larger impact for poorer patients, who are likely to have less of both resources.
The obvious factors of economics and ease are not the only important aspects affecting the relationship between proximity and use of services. The presence of centers (and especially a great number of centers), may also have the effect of normalizing the use of their services. Previous research has shown this effect for the proximity of mental health services. If people are exposed to facilities providing these services, it became more usual both to accept people who use the services, and to seek said services yourself (Smith and Hanham 1981).
8
8
eligible for these services. This is especially true for teens, who may otherwise have less knowledge of their communities and options than adults. The proximity and visibility of services may help teens to be aware of their options. Though a variety of factors may affect a teen‘s knowledge of reproductive health and contraceptive services (such as information distributed through their school, parents, and friends), proximity is an important aspect of awareness. Research in the developing world has shown that when services are closer, not only does accessibility increase, but awareness also increases (Hammerslough 1992).
PROVIDER TYPE
Research on other health services has shown that provider type impacts a patient‘s likelihood of continued, correct, and consistent treatment (Cameron et al 1999; Lafata et al 2001; Goodman et al 2005). Further, studies have shown that women‘s contraceptive use is affected by their perceived quality of care by reproductive health care professionals (Frost 2001; Frost, Singh, and Finer 2007). This research could lead one to believe that the type of publicly funded provider a woman sees will have an effect on her contraceptive use, and therefore on her likelihood of experiencing a teen pregnancy. This analysis explores this association between the number of publicly funded family planning centers in a county and the risk of pregnancy experienced by teenage girls in that county. Further, it explores difference in risk of teen pregnancy by provider type.
9
9
state and federal funds for their services related to contraceptive counseling and care. Community health centers are established to cater to particular populations, such as immigrants or non-English speaking patients. Though, ideally, these organizations and institutions providing publicly funded family planning services share a common goal of educating women and girls on their contraceptive options and providing quality care to prevent teen pregnancy, there are many differences across provider type in the types of services offered and the regulations staff and health professionals must meet.
Organizations providing publicly funded family planning services that receive support through Title X must follow a number of regulations. They may not counsel any patients on abortion as an option to end an unplanned pregnancy, nor discuss abortion in any context. The law also requires that ―people be given a choice of contraceptive methods (including periodic abstinence and other fertility awareness-based methods), no one is coerced into accepting a particular method or any method at all, services are provided in the context of related reproductive health care, and that recipients are charged fees based on their income and ability to pay‖ (Planned Parenthood Federation of America 2008). Planned Parenthood Affiliates often provide more types of birth control to their patients than other publicly funded organizations. They can also be more willing to provide more controversial services, such as sterilizations on younger women, IUD insertion for women who have not previously had children, or use of emergency contraceptive (Senanayake 1996). Centers with a particular demographic group of focus, such as community migrant health centers, may be able to provide services such as counseling in their native language for non-English speakers that other organizations cannot manage.
10
10
by the Guttmacher Institute in 2003 showed significant differences in the types and quality of services offered by these different center types (Lindberg et al 2006).1 For example, they found that Planned Parenthood affiliates were much more likely to offer newer types of birth control (such as the ring or the patch). Further, they found that health departments were more vulnerable to financial constraints than other clinic types. Title X funded programs, and especially Planned Parenthood affiliates, were much more likely than other centers to offer emergency contraceptive. Health departments were least likely to carry this option. Another significant difference found in the study was differences in pelvic exam requirements. Pelvic exams, which can be cost prohibitive for some patients, are often required before a clinic will provide contraceptives. Planned Parenthood affiliates were less likely to require these exams, with only 7% of Planned Parenthood requiring the exam at the initial contraceptive visit in 2003.
1
CHAPTER THREE
DATA AND METHODS
EXPECTED EFFECTS
In general, I would expect that the greater the number of family planning clinics in one‘s county, the lower the risk of a teen pregnancy. However, I am more interested in how the relationship between family planning clinics and teen pregnancy rates differ by income and race/ethnicity. Publicly funded family planning centers, and programs such as Title X and Medicaid, are implemented to target low income women who are uninsured or cannot afford preventative reproductive health care on their own (Finer and Henshaw 2006). Though all teens are considered ―in need‖ of publicly funded contraceptive services, it is likely that low income teens are even more likely to lack access to contraceptives through other sources than their wealthier peers. For this reason, I hypothesize that the effect of the number of publicly funded family planning centers in a county will have a larger impact for low income teens.
Teen pregnancy rates to black and Hispanic women are much higher than those to white women in the United States. Previous research has shown that minority women are often less likely to use preventative health care than white women (Fiscella et al 2002;
12
12
As discussed above, it is possible that different types of contraceptive providers may have varying effects for teens across race groups. In the race analysis, I therefore focus on two questions: whether the effect of family planning clinics explain existing disparities in teen pregnancy rates by race; and whether different types of clinics are associated with growing or narrowing the gaps in pregnancy rates between white teens, and black and Hispanic teens.
DATA
Data for this paper are drawn from several sources. The main dataset used is the 1997 National Longitudinal Survey of Youth, a nationally representative sample of 8,984 youths who were born between 1980 and 1984. The survey began in 1997, when the youths were between 12 and 16 years old, and continued on an annual basis. Black and Hispanic/Latino respondents were oversampled. This paper uses data from female respondents during the first seven rounds of the NLSY97, from 1997 until 2003. In 2003, respondents‘ ages ranged from 18 to 23. This analysis only includes respondents‘ responses during survey years when they were age 16 to 19.
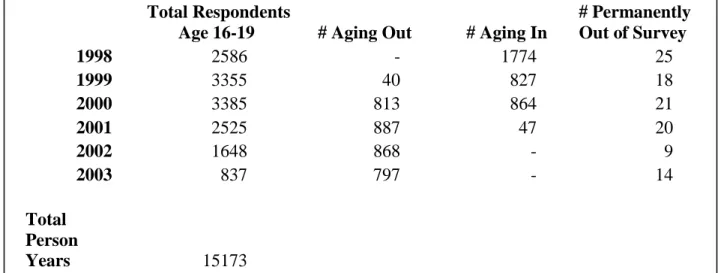
Table 1 shows the number of (female) respondents between the ages of 16 and 19 in the survey in each year. It specifies how many women have ―aged in‖ (turned 16) or ―aged out‖ (turned 20), as well as the number of respondents who have permanently left the sample population, and who are therefore no longer included in the analysis after that round. This study only examines women who are between 16 and 19 years old.
13
13
total, 4,353 respondents contribute 15,173 person years to the study period, averaging about four years per respondent (ages 16, 17, 18, and 19). Respondents may not be
included for all four years if they left the survey before turning 20, or if they had more than a year‘s time between interviews (for example, they were 15 in 1997 and 17 by the time of the 1998 interview).
Respondents sometimes left the survey, only to return in the following year. Respondents are included in analysis in all years that they took part in the survey and are between the ages of sixteen and nineteen. Further, many of the key questions for this analysis, such as pregnancy outcomes, were answered retrospectively, so pregnancies that happened in a year that the respondent was missing from the survey are included in analysis if it was reported in a later year.
FOCAL INDEPENDENT VARIABLE
14
14
other, independent organizations. This dataset includes some information on the type of center(s) in each county, specifying if the centers are hospitals, public health departments, Planned Parenthoods, or community migrant health centers. Further, the dataset indicates if the center receives funds through Title X. For the years that Guttmacher has not
provided data on the location of centers, I used linearly interpolation to generate the number of each types of center in each county in the missing years (see Table 3 and figure 1).
The 1997 NLSY geocode data includes the respondent‘s state and county of residence at each interview date. Respondents live in a total of 576 different counties in 50 states and the District of Columbia, with a great deal of variation in the number of clinics of each type in their county of residence. Any inter-county and –state moves are also captured in the data. To construct the independent variable, I determined the number and types of publicly funded family planning centers in the respondent‘s county of residence in each year.
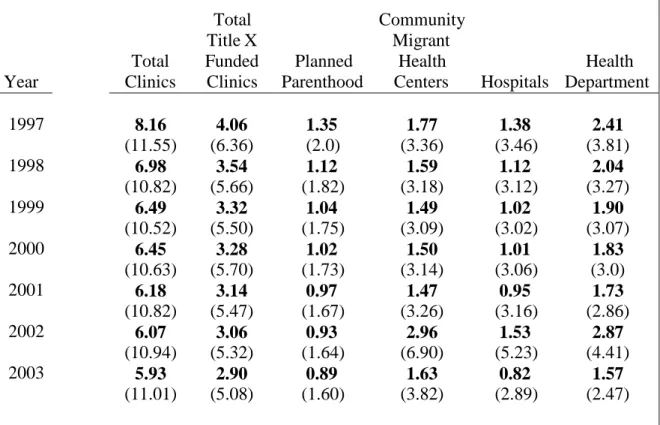
Most counties in the US had at least one publicly funded family planning center, with only 125 counties having no centers at any time during the study years, and 318 counties having no centers during at least one year. On average, the number of publicly funded family planning centers in the counties represented in the 1997 NLSY decreased between 1997 and 2003, with the total number of clinics decreasing from an average of 16.10 clinics in 1997 to 4.39 clinics in 2003. (See table 5). This decline is partially due to more restrictive partitioning of Title X and other funding, leading to fewer clinics serving more clients in the later years (Frost, Frohwirth, Purcell 2004).
15
15
The outcome variable is whether or not the respondent became pregnant for the first time as a teen. Respondents are asked each year if they have become pregnant, the month and year their pregnancy ended, and if their pregnancy ended in a live birth, an abortion, or another outcome. If the pregnancy ended in any outcome other than live birth, the respondents are asked how many months they had been pregnant at the time of termination or
miscarriage/stillbirth. Between 1997 and 2003, 1,201 women age 16 to 19 reported 1,686 pregnancies, which resulted in 1,102 live births, and 238 abortions, and 346 miscarriages or stillbirths (see table 6). Only first pregnancies (which make up 72.27% of all pregnancies reported) are included in the analysis. The NLSY is similar to other national surveys in the underreporting of abortions (Fu et al 1998, Jagannathan 2001). However, the overall
pregnancy rates are fairly close to national averages, so this analysis is relatively unaffected by this underreporting. The month and year of conception were calculated by subtracting nine months from the month and year of birth if the pregnancy ended in a live birth. If the respondent reported an abortion, miscarriage, or a stillbirth, the number of months that the respondent reported to have been pregnant at the time the pregnancy ended is subtracted from the month and year when the pregnancy ended.
CONTROL VARIABLES
A variety of individual and demographic characteristics that could affect a
respondent‘s risk of experiencing a teen pregnancy and their ability to use family planning services that are nearby are included in the analysis. As mentioned previously, access to and knowledge of family planning services are affected by factors outside of the physical
16
16
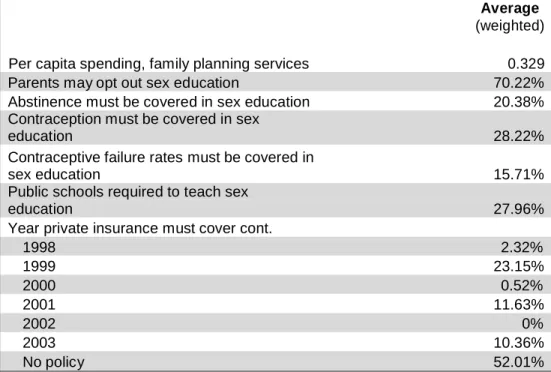
control for both knowledge of services, and for ability to utilize these services. Controls are included for several factors related to the sex education a teen may receive in school, which are generally guided by state policies. This includes whether or not parents are able to opt their child out of school sponsored sex education courses, if information on contraception is required in high school sex education courses, and if public schools are required to teach sex education (see Table 4 for a full list). The sex education provided in the teen‘s high school is assumed to be a main (non-familial) conduit by which teens receive information on family planning services in their area. Controlling for the presence, and somewhat for the quality, of this sex education helps to separate out the effects of teens that live in counties with family planning services but are unaware that the services exist. School enrollment status at the time of conception is also controlled for, as a teen who is not enrolled in school may not receive the sex education provided by the high school. In an attempt to control for the amount of information that may be available to teens outside of school, a control is also included for the per capita spending on family services in the state. In using this control, I assume that clinics with more money are able to provide more community outreach through educational materials and publicity on the services they provide, therefore perhaps educating teens on the services available to them.
The respondent‘s religious affiliation, as well as the religiosity of their parents, and how often their peers attend church, are also controlled for. It is possible that if a
17
17
time that their pregnancy began. This is to control for intended pregnancies with a partner, which, while rare among 16-19 year olds, are possible. In addition, controls are included for factors that may be correlated in some way with both the number and type of family planning clinics in the county, and with the risk of teen pregnancy, therefore potentially confounding the models. This includes household poverty ratio, which is a ratio comparing the gross household income variable (rounds 1-7) or the gross family income variable (rounds 8 and up) to the federal poverty level for the previous year, taking household size into account (NLSY97 Income Documentation). Teens with household incomes less than or closer to the poverty line may be more likely to experience a teen pregnancy for reasons unrelated to proximity to family planning services. However, they may also be more likely to live in areas with more clinics (as mentioned, clinics are often built in high poverty areas). This
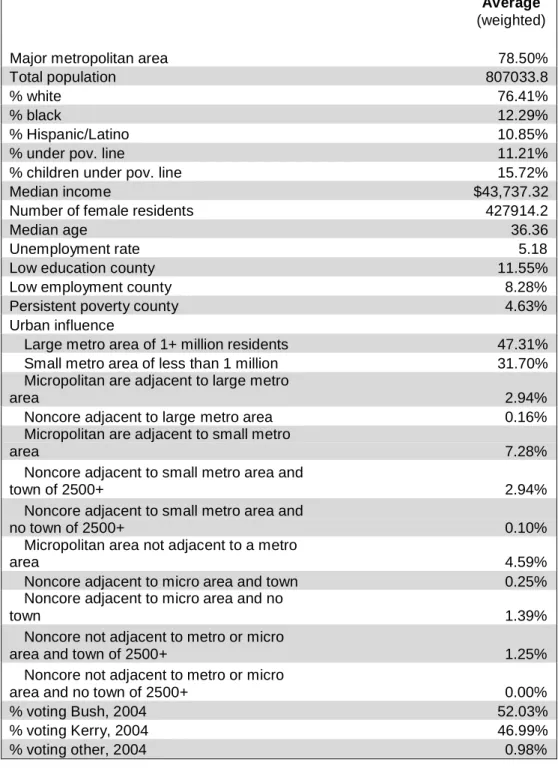
relationship could make it appear as though there is a positive relationship between the presence and number of clinics and the risk of teen pregnancy. Whether or not the teen lives in a metropolitan area (where clinics are much more likely), and the teen‘s region of
residence is also included. As with household income, teens in certain regions (the South) are more likely to experience pregnancy than teens in other parts of the country, and these areas often include more clinics for this reason as well.
METHODS
The placement of publicly funded family planning centers, and especially centers targeting a specific demographic group (such as community migrant health centers), is not random. This non-random distribution creates an endogeneity issue. Counties with
18
18
County level factors, such as poverty rate, percent Hispanic, percent black, political opinions of the population, and region of the country, impact policy makers‘ decisions when family planning programs are funded (Frost et al 2001). Many of these factors are also associated with higher rates of teen pregnancy (Mollborn and Morningstar 2009; Ventura et al 2011). Publicly funded family planning centers aim to prevent unplanned and teen pregnancies, especially to those in most need because they cannot afford reproductive health care services and contraceptives without public funds. This means that publicly funded family planning centers are more likely to be located in counties with individuals who have these characteristics that put them at greater risk of experiencing higher rates of teen pregnancy. Thus, a large number of centers in a county may not appear to reduce teen pregnancy rates (or may even be associated with higher pregnancy rates). However, this may simply reflect the composition of that county with a population with higher than average teen pregnancy rates.
19
19
list.
Second, to help minimize endogeneity bias associated with unobserved factors associated with the placement of family planning clinics and with teen pregnancy, state level fixed effects will be used. Fixed effects have been used in the past to cope with this issue of nonrandom placement of services (Rindfuss et al 2010). Much of the unmeasured variation in where to place publicly funded family planning clinics occurs at the state level, therefore state fixed effects are an effective method for this purpose. I use a Cox
Proportional Hazard Model to measure how the effect of the number and type of publicly funded family planning clinics in a respondent‘s county of residence varies by income, poverty status, and race. Three main hypotheses are tested.
Hypothesis 1: The presence and number of publicly funded family planning center will be associated with a decrease in the relative risk of teen pregnancy.
Hypothesis 1a: Some clinic types may be associated larger or smaller decreases in the relative risk in teen pregnancy than others.
Hypothesis 2: The presence and number of publicly funded family planning centers will be associated with a larger decline in the relative risk of teen pregnancy for low income teens, therefore, a greater number of publicly funded family planning centers in a county will be associated with a decrease in the negative association between household income and teen pregnancy.
20
20
Hypothesis 3: Publicly funded family planning clinics will be associated with a decrease in the disparity between white and black teen pregnancy rates, and white and Hispanic teen pregnancy rates.
CHAPTER FOUR
RESULTS
Table 7a shows odds ratios from a Cox proportional hazards model of the relative risk of teen pregnancy. Twelve models are presented. Model 1 is a bivariate model with only household income, in $10,000s). Results indicate that each additional $10,000 in household income is associated with a 10.8% decrease in the relative risk of teen
pregnancy. Model 2 adds demographic characteristics such as race, religion, marital status, school enrollment status, and religion to the model. Model 3 adds county characteristics. Model 4 includes controls for state policies; models 5-10 add each publicly funded family planning center to the model separately. All clinic types are included in Model 11. Model 12 adds state level fixed effects.
22
22
the table does change. This suggests that there are unobserved state level differences that are not controlled for by including either county characteristics or state policies effecting the associations between these factors and the relative risk of teen pregnancy. To control for this state level variation, state level fixed effects are including in all subsequent models.
Table 7b is a replica of 7a, but with state level fixed effects included in each model. Results in table 7b show no change in the association between household income and the relative risk of teen pregnancy when publicly funded family planning centers are added in models 5-11. However, both hospitals and community migrant health centers are associated with decreases in the relative risk of teen pregnancy, by 1.1% and 1.6% respectively.
Further, when all center types are included in model 11, each additional community migrant health center in the county of residence is associated with a 2.8% decrease in the relative risk of teen pregnancy. Hospitals no longer have any significant effect in model 11, and ―total clinics‖ are actually associated with a slightly higher risk of teen pregnancy. This likely means that the total number of clinics isn‘t an important factor in the association between different clinic types and teen pregnancy, and in fact, more clinics in a county likely reflect the fact that the county has a higher teen pregnancy risk. The different center types, however, do seem to matter, so when I control for center type, some types are associated with significant decreases in the risk of teen pregnancy.
Table 8a includes the same 11 models as in table 7b, for white teens only. Adding publicly funded family planning clinics to models 5-11 does not seem to alter the
23
23
household income (in $10,000s) and the risk of teen pregnancy is reduced by .1%. Each additional hospital in the county is associated with a 2.6% decrease in the relative risk of teen pregnancy. Community migrant health centers are also associated with a lower relative risk of teen pregnancy, by 2% (Model 10). When all clinic types are added to the model, Title X funded clinics, hospitals, and community migrant health centers are
associated with a lower risk of teen pregnancy (by 2.6%, 3%, and 3.2% respectively). The total number of clinics is associated with a 4.2% increase in the relative risk of teen pregnancy.
Clinics appear to have a larger effect on the association between household income and relative risk of teen pregnancy for Hispanic teens in table 8c. The addition of effects for Title X funded clinics in model 6, Planned Parenthood affiliates in model 7, health
24
24
not included in the discussion due to the extremely small sample size. When the total number of publicly funded family planning clinics in the county is included in model 5, the relative risk of pregnancy for black teens (compared to white) decreases to 104%, and for Hispanic teens (again, relative to white) decreases to 89.1%. This suggests that the total number of publicly funded family planning clinics in the county is associated with an increase in the disparity between black/Hispanic teen pregnancy rates and white teen pregnancy rates. However, model 5 also shows that each additional clinic in the county is associated with a 1.7% decrease in the relative risk of teen pregnancy overall. Models 6-10, when each individual center type is added to the model, the disparity between black and white teen pregnancy rates increases, suggesting that the presence and number of these types of clinics in the county is associated with decreasing the black/white gap. For Hispanic teens, only the addition of Planned Parenthood affiliates in model 7 shows a decrease in the gap. In addition to the total number of clinics, hospitals and community migrant health centers are associated with a significant decrease in the relative risk of teen pregnancy, by 2% and 2.9% respectively.
25
25
disparity between Hispanic and white pregnancy rates (suggesting that these clinics are associated with a greater decrease in the risk of pregnancy for white teens than Hispanic teens), and total clinics and Planned Parenthood affiliates have the opposite effect. However, in model 8, each additional health department providing family planning services in the county is associated with a decrease of 3.1% in the risk of pregnancy. In model 11, which includes all clinic variables, community migrant health centers are associated with a 2.8% decrease in the risk of pregnancy, and ―total clinics‖ with a 2.6% increase.
CHAPTER FIVE
DISCUSSION AND CONCLUSION
DISCUSSION
The presence and type of publically funded family planning centers do not seem to explain the effect of household income on pregnancy risk. Overall, when different types of clinics are added to models, some show significant negative associations with teen pregnancy risks. Hypothesis one does seem to have some support in the results.
Specifically, hospitals, community migrant health centers, and, for teens with household incomes between 50% and 150% of the national poverty level, health departments, seem to be associated with a decrease in the risk of teen pregnancy.
27
27
funded family planning clinics appeared for teens with household incomes under 50% of the poverty line. For this population, most clinic types appear to be associated with a decrease in the disparity between the pregnancy rates of white and black teens, as well as an increase in the gap between white and Hispanic teens. This suggests that Hispanic teens in extreme poverty are not experiencing the same benefit from these services as white and especially black teens, perhaps due to language or access issues.
Hospitals consistently explain the disparity in pregnancy rates between black and white teens. The hospital effect is fairly consistent (between 1.4% and 1.6%) for teens with household incomes both above and below the federal poverty line. This effect is reversed for Hispanic teens, where the number of hospitals in a county is actually associated with an increase in the discrepancy between Hispanic and white teen pregnancy rates, regardless of income. Reasons for this unique effect of hospitals for black teens can only be speculated from this research. As mentioned previously, some studies have shown less knowledge of contraceptive options and more stigma associated with contraceptive use among black
populations. Perhaps hospitals, because they are primarily associated with services other than reproductive health care and family planning, are a less weighted option for black teenagers than, for example, Planned Parenthood affiliates. Further research would be needed to determine the reasons for these differences with any certainty.
28
28
have been implemented. Recent immigrant and non-English speaking populations may experience much higher pregnancy rates, and may also live in towns with more community migrant health centers. This endogeneity is a major limitation of this research. Though state-level fixed effects are included, unobserved variation at the county state-level most likely does exist. The inclusion of county level characteristics attempts to control for some of this heterogeneity, but, some unobserved variation is likely missed in this analysis. Community migrant health centers attempt to serve a fairly unique population, namely, recent immigrants and non-English speakers, demographic groups that are also known to have higher than average rates of teen pregnancy in general. For this reason, the effects of this center type may be especially sensitive to issues of unmeasured heterogeneity. Further research focused on these centers specifically may be able to further tackle this endogeneity issue for these centers in particular.
CONCLUSION
The presence and quantity of publicly funded family planning centers does seem to impact the disparity in pregnancy rates between white, Hispanic, and black teens. However, the direction of these associations varies, by race and income level. From this analysis, it appears that some centers, such as community migrant health centers (for low income teens) and hospitals (for black teens) do decrease this inequality. However, other center types appear to have very little effect, or in some cases the opposite effect. This does not
29
29
themselves are not doing an adequate job reaching and serving minority patients. Previous research has shown that black and Hispanic patients are less likely to utilize preventative health care services in the first place, and to be less satisfied with the care that they receive (Fiscella et al 2002). These factors may also be in effect for contraceptive services. Black respondents are also less likely to trust their healthcare providers (Boulware 2003), and some studies have found that minority respondents can have more reservations about the side effects of various contraceptive methods than their white counterparts (Woodsong, Shedlin, and Koo 2004). Further analysis is needed to examine why different center types are
30
30
TABLES
Table 1: NLSY97 Retention Rate2
Total Respondents # Permanently
Age 16-19 # Aging Out # Aging In Out of Survey
2
“Aging out” refers to the respondent turning 20, and therefore no longer being included in the sample. “Aging in” refers to the respondent turning 16, and therefore being added to the sample used in analysis
1998 2586 - 1774 25
1999 3355 40 827 18
2000 3385 813 864 21
2001 2525 887 47 20
2002 1648 868 - 9
2003 837 797 - 14
Total Person
Years 15173
31
31
Table 2: Demographic Characteristics of Female Respondents, 1997NLSY (N=4,385)
Percent (weighted) Race
White 70.85
Black 15.54
Hispanic 12.28
Mixed race/ other 1.33
Religion
No Religion 8.41
Roman Catholic 20.97
Baptist 18.65
Other Christian 37.17
Jewish 0.81
Mormon 1.58
Muslim 0.44
Other 11.97
Households Below Poverty Line
Total 25.09
White 20.04
Black 42.21
Hispanic 32.67
Married or cohabiting 8.41
In school 73.8
Parity
First preg. 72.27
Second preg. 21.98
Third preg. 5.17
Fourth preg. 0.51
Live in metropolitan
area 78.5
Region of Residence at First Interview
Northeast 17.75
North Central 25.99
South 30.86
West 25.38
Average age: 17.6
No. state represented 51
32
32
From the 1997 Longitudinal Survey of Youth Table 3: County Characteristics
Average
(weighted)
Major metropolitan area 78.50%
Total population 807033.8
% white 76.41%
% black 12.29%
% Hispanic/Latino 10.85%
% under pov. line 11.21%
% children under pov. line 15.72%
Median income $43,737.32
Number of female residents 427914.2
Median age 36.36
Unemployment rate 5.18
Low education county 11.55%
Low employment county 8.28%
Persistent poverty county 4.63%
Urban influence
Large metro area of 1+ million residents 47.31%
Small metro area of less than 1 million 31.70%
Micropolitan are adjacent to large metro
area 2.94%
Noncore adjacent to large metro area 0.16%
Micropolitan are adjacent to small metro
area 7.28%
Noncore adjacent to small metro area and
town of 2500+ 2.94%
Noncore adjacent to small metro area and
no town of 2500+ 0.10%
Micropolitan area not adjacent to a metro
area 4.59%
Noncore adjacent to micro area and town 0.25%
Noncore adjacent to micro area and no
town 1.39%
Noncore not adjacent to metro or micro
area and town of 2500+ 1.25%
Noncore not adjacent to metro or micro
area and no town of 2500+ 0.00%
% voting Bush, 2004 52.03%
% voting Kerry, 2004 46.99%
33
33
Table 4: State Policies
Average
(weighted)
Per capita spending, family planning services 0.329
Parents may opt out sex education 70.22%
Abstinence must be covered in sex education 20.38%
Contraception must be covered in sex
education 28.22%
Contraceptive failure rates must be covered in
sex education 15.71%
Public schools required to teach sex
education 27.96%
Year private insurance must cover cont.
1998 2.32%
1999 23.15%
2000 0.52%
2001 11.63%
2002 0%
2003 10.36%
34
34
Table 5: Average Number of Publicly Funded Family Planning Centers in Respondents Counties of Residence by Year and Center Type (N=4,385)
Year
Total Community
Title X Migrant
Total Funded Planned Health Health
Clinics Clinics Parenthood Centers Hospitals Department 1997
1998 1999 2000 2001 2002 2003
8.16 4.06 1.35 1.77 1.38 2.41
(11.55) (6.36) (2.0) (3.36) (3.46) (3.81)
6.98 3.54 1.12 1.59 1.12 2.04
(10.82) (5.66) (1.82) (3.18) (3.12) (3.27)
6.49 3.32 1.04 1.49 1.02 1.90
(10.52) (5.50) (1.75) (3.09) (3.02) (3.07)
6.45 3.28 1.02 1.50 1.01 1.83
(10.63) (5.70) (1.73) (3.14) (3.06) (3.0)
6.18 3.14 0.97 1.47 0.95 1.73
(10.82) (5.47) (1.67) (3.26) (3.16) (2.86)
6.07 3.06 0.93 2.96 1.53 2.87
(10.94) (5.32) (1.64) (6.90) (5.23) (4.41)
5.93 2.90 0.89 1.63 0.82 1.57
35
35
Table 6: Teen Pregnancies and Outcomes by Year
Year
Teen Teen Total
Pregnancies Pregnancies Teen Pregnancies Pregnancies
ending in live ending in ending in to women
birth abortion miscarriage/stillbirth younger than 20
1997 1998 1999 2000 2001 2002 2003
Total
52 9 16 77
163 35 51 249
232 58 73 363
235 60 71 366
198 36 61 295
134 25 53 212
88 15 21 124
1102 238 346 1686
Table 7a: Relative Risk of Teen Pregnancy, 1997-2003, with Household Income (in $10,000s) and Race Covariates, and tests for State Fixed Effects (Odds Ratios).
VARIABLES Model 1 Model 2 Model 3 Model 4 Model 5 Model 6 Model 7 Model 8 Model 9 Mod10 Mod11 Mod12
HH Income (in $10,000)
Black (White omitted)
0.892*** 0.926*** 1.719*** 0.927*** 1.690*** 0.929*** 1.570*** 0.929*** 1.566*** 0.929*** 1.560*** 0.929*** 1.554*** 0.929*** 1.571*** 0.929*** 1.578*** 0.929*** 1.572*** 0.929*** 1.558*** 0.931*** 1.610***
Hispanic 1.442*** 1.425*** 1.444*** 1.440*** 1.443*** 1.433*** 1.441*** 1.434*** 1.444*** 1.414*** 1.363***
Mixed race/other 1.659** 1.713** 1.726** 1.737** 1.740** 1.746** 1.706** 1.739** 1.711** 1.751** 1.854***
Married/cohab. (conc.) 1.601*** 1.584*** 1.623*** 1.624*** 1.622*** 1.623*** 1.627*** 1.619*** 1.622*** 1.621*** 1.613***
In school 0.605*** 0.620*** 0.614*** 0.614*** 0.614*** 0.615*** 0.614*** 0.613*** 0.613*** 0.613*** 0.607***
Roman Catholic (No Relig omit) 1.035 1.021 0.941 0.946 0.944 0.938 0.943 0.934 0.930 0.942 0.965
Other Christian 1.275* 1.196 1.128 1.131 1.131 1.125 1.135 1.121 1.117 1.123 1.113
Other religion 0.755* 0.739* 0.703** 0.706** 0.704** 0.704** 0.709** 0.702** 0.695** 0.711** 0.756*
Parent religiosity 0.999*** 0.999*** 0.999*** 0.999*** 0.999*** 0.999*** 0.999*** 0.999*** 0.999*** 0.999*** 0.999***
Peers attend church regularly 0.916*** 0.903*** 0.908*** 0.908*** 0.907*** 0.908*** 0.910*** 0.907*** 0.907*** 0.908*** 0.910***
Total Clinics 1.003 1.016 1.021**
Title X Clinics 1.006 1.004 0.991
Planned Parenthood 1.031 1.005 0.994
Health Departments 0.984 0.981* 0.989
Hospitals 0.988 0.986* 0.993
Comm. Mig. H. C. 0.989** 0.982** 0.972***
County Charact. Yes Yes Yes Yes Yes Yes Yes Yes Yes Yes
State Policies Yes Yes Yes Yes Yes Yes Yes Yes Yes
State F.E. Yes
Observations 13,936 13,936 13,936 13,936 13,936 13,936 13,936 13,936 13,936 13,936 13,936 13,936
*** p<0.01, ** p<0.05, * p<0.1
Table 7b: Relative Risk of Teen Pregnancy, 1997-2003, with Household Income (in $10,000s) and Race Covariates and State Fixed Effects (Odds Ratios).
VARIABLES Model 1 Model 2 Model 3 Model 4 Model 5 Model 6 Model 7 Model 8 Model 9 Model10 Model11
HH Income (in $10,000) 0.894*** 0.927*** 0.930*** 0.931*** 0.931*** 0.931*** 0.931*** 0.931*** 0.931*** 0.931*** 0.931***
Black (White omitted) 1.620*** 1.685*** 1.618*** 1.618*** 1.621*** 1.612*** 1.619*** 1.624*** 1.609*** 1.610***
Hispanic 1.422*** 1.419*** 1.388*** 1.388*** 1.388*** 1.383*** 1.385*** 1.379*** 1.377*** 1.363***
Mixed race/other 1.656** 1.823** 1.856*** 1.851*** 1.851*** 1.869*** 1.847*** 1.868*** 1.833*** 1.854***
Married/cohab. (conc.) 1.539*** 1.550*** 1.616*** 1.615*** 1.615*** 1.615*** 1.615*** 1.612*** 1.614*** 1.613***
In school 0.620*** 0.632*** 0.608*** 0.607*** 0.607*** 0.608*** 0.607*** 0.607*** 0.606*** 0.607***
Roman Catholic (No Relig omit) 0.963 0.965 0.967 0.965 0.966 0.965 0.966 0.959 0.953 0.965
Other Christian 1.185 1.157 1.122 1.121 1.121 1.119 1.121 1.116 1.111 1.113
Other religion 0.731** 0.738* 0.748* 0.747* 0.748* 0.749* 0.750* 0.748* 0.743* 0.756*
Parent religiosity 0.999*** 0.999*** 0.999*** 0.999*** 0.999*** 0.999*** 0.999*** 0.999*** 0.999*** 0.999***
Peers attend church regularly 0.905*** 0.901*** 0.910*** 0.910*** 0.910*** 0.910*** 0.911*** 0.909*** 0.908*** 0.910***
Total Clinics Title X Clinics
0.999
0.998
1.021** 0.991
Planned Parenthood 1.013 0.994
Health Departments 0.986 0.989
Hospitals Comm. Mig. H. C.
0.989*
0.984***
0.993 0.972***
County Charact. Yes Yes Yes Yes Yes Yes Yes Yes Yes
State Policies Yes Yes Yes Yes Yes Yes Yes Yes
Observations 13,936 13,936 13,936 13,936 13,936 13,936 13,936 13,936 13,936 13,936 13,936
*** p<0.01, ** p<0.05, * p<0.1
All models includes State level fixed effects
Table 8a: Relative Risk of Teen Pregnancy for White Teens, 1997-2003 (Odds Ratios)
VARIABLES Model 1 Model 2 Model 3 Model 4 Model 5 Model 6 Model 7 Model 8 Model 9 Model10 Model11
HH Income (in $10,000) 0.893*** 0.924*** 0.929*** 0.930*** 0.930*** 0.930*** 0.930*** 0.930*** 0.931*** 0.930*** 0.931***
Married/cohab. (conc.) 1.494** 1.525*** 1.554*** 1.552*** 1.556*** 1.549*** 1.545*** 1.554*** 1.556*** 1.544***
In school 0.500*** 0.514*** 0.496*** 0.498*** 0.495*** 0.497*** 0.495*** 0.493*** 0.494*** 0.495***
Roman Catholic (No Relig omit) 0.974 0.973 0.976 0.981 0.980 0.975 0.972 0.971 0.973 1.005
Other Christian 1.175 1.137 1.097 1.096 1.098 1.091 1.091 1.091 1.098 1.100
Other religion 0.671* 0.669* 0.669* 0.669* 0.668* 0.674* 0.674* 0.682* 0.675* 0.700
Parent religiosity 0.999*** 0.999*** 0.999*** 0.999*** 0.999*** 0.999*** 0.999*** 0.999*** 0.999*** 0.999***
Peers attend church regularly 0.874*** 0.872*** 0.878*** 0.878*** 0.879*** 0.878*** 0.881*** 0.878*** 0.877*** 0.881***
Total Clinics 1.005 1.040*
Title X Clinics 0.990 0.973
Planned Parenthood 1.023 0.968
Health Departments 0.975 0.975
Hospitals 0.970 0.962
Comm. Mig. H. C. 0.991 0.973
County Charact. Yes Yes Yes Yes Yes Yes Yes Yes Yes
State Policies Yes Yes Yes Yes Yes Yes Yes Yes
Observations 7,182 7,182 7,182 7,182 7,182 7,182 7,182 7,182 7,182 7,182 7,182
*** p<0.01, ** p<0.05, * p<0.1
All models includes State level fixed effects
Table 8b: Relative Risk of Teen Pregnancy for Black Teens, 1997-2003 (Odds Ratios)
VARIABLES Model 1 Model 2 Model 3 Model 4 Model 5 Model 6 Model 7 Model 8 Model 9 Model10 Model11
HH Income (in $10,000) 0.941*** 0.953** 0.954** 0.955** 0.955** 0.955** 0.955** 0.955** 0.956** 0.955** 0.954**
Married/cohab. (conc.) 1.443* 1.446* 1.411 1.406 1.408 1.409 1.419 1.389 1.399 1.396
In school 0.918 0.946 0.932 0.932 0.932 0.932 0.931 0.940 0.938 0.941
Roman Catholic (No Relig omit) 0.735 0.727 0.633 0.629 0.623 0.633 0.628 0.620 0.624 0.632
Other Christian 1.230 1.271 1.267 1.261 1.259 1.267 1.264 1.249 1.227 1.244
Other religion 0.834 0.852 0.887 0.887 0.889 0.887 0.887 0.886 0.887 0.899
Parent religiosity 0.998*** 0.998*** 0.999*** 0.999*** 0.999*** 0.999*** 0.999*** 0.999*** 0.999*** 0.999***
Peers attend church regularly 0.936* 0.932* 0.934** 0.933** 0.933** 0.933** 0.934* 0.930** 0.932** 0.931**
Total Clinics 0.997 1.042***
Title X Clinics 0.993 0.974**
Planned Parenthood 0.994 0.956
Health Departments 0.991 1.006
Hospitals 0.974*** 0.970**
Comm. Mig. H. C. 0.980* 0.968**
County Charact. Yes Yes Yes Yes Yes Yes Yes Yes Yes
State Policies Yes Yes Yes Yes Yes Yes Yes Yes
Observations 3,661 3,661 3,661 3,661 3,661 3,661 3,661 3,661 3,661 3,661 3,661
*** p<0.01, ** p<0.05, * p<0.1
All models includes State level fixed effects
Table 8c: Relative Risk of Teen Pregnancy for Hispanic Teens, 1997-2003 (Odds Ratios)
VARIABLES Model 1 Model 2 Model 3 Model 4 Model 5 Model 6 Model 7 Model 8 Model 9 Model10 Model11
HH Income (in $10,000) 0.924*** 0.933*** 0.932*** 0.936** 0.936** 0.937** 0.937** 0.937** 0.936** 0.937** 0.940**
Married/cohab. (conc.) 1.309 1.269 1.431** 1.416** 1.435** 1.438** 1.429** 1.429** 1.414** 1.432**
In school 0.627*** 0.633** 0.583*** 0.582*** 0.585*** 0.585*** 0.582*** 0.584*** 0.587*** 0.592***
Roman Catholic (No Relig omit) 1.398 1.379 1.344 1.320 1.340 1.350 1.350 1.338 1.265 1.271
Other Christian 1.639 1.620 1.494 1.503 1.515 1.494 1.515 1.488 1.417 1.421
Other religion 1.239 1.241 1.242 1.200 1.229 1.245 1.253 1.237 1.137 1.127
Parent religiosity 0.999*** 0.999*** 0.999*** 0.999*** 0.999*** 0.999*** 0.999*** 0.999*** 0.999** 0.999***
Peers attend church regularly 0.962 0.953 0.954 0.950 0.955 0.954 0.954 0.952 0.947 0.949
Total Clinics 0.987* 1.000
Title X Clinics 0.979 0.990
Planned Parenthood 1.019 1.047
Health Departments 0.988 1.000
Hospitals 0.994 1.015
Comm. Mig. H. C. 0.976*** 0.970***
County Charact. Yes Yes Yes Yes Yes Yes Yes Yes Yes
State Policies Yes Yes Yes Yes Yes Yes Yes Yes
Observations 2,954 2,954 2,954 2,954 2,954 2,954 2,954 2,954 2,954 2,954 2,954
*** p<0.01, ** p<0.05, * p<0.1
All models includes State level fixed effects
Table 9a: Relative Risk of Teen Pregnancy by Income <= 50% of Pov. Line, 1997-2003 (Odds Ratios)
VARIABLES Model 1 Model 2 Model 3 Model 4 Model 5 Model 6 Model 7 Model 8 Model 9 Model10 Model11
Black (White omit) 1.504** 1.752*** 2.244*** 2.060*** 2.040*** 2.071*** 2.077*** 2.067*** 2.078*** 1.987*** 2.019***
Hispanic 1.635** 1.739** 1.877** 1.927*** 1.891*** 1.917*** 1.961*** 1.923*** 1.885** 1.864** 1.908***
Other/Mixed Race 3.159** 3.530** 3.477** 3.356** 3.256** 3.344** 3.161** 3.384** 3.393** 3.268** 3.096**
Married/cohab. (conc.) 1.580** 1.501* 1.715** 1.692** 1.703** 1.715** 1.711** 1.704** 1.687** 1.686**
In school
Roman Catholic (No Relig omit) 0.759 0.815 0.784 0.852 0.802 0.872 0.792 0.835 0.800 0.866 0.795 0.880 0.802 0.876 0.799 0.857 0.796 0.823 0.789 0.838
Other Christian 0.887 0.943 0.916 0.891 0.914 0.914 0.917 0.903 0.863 0.865
Other religion 0.517** 0.582* 0.575** 0.547** 0.574** 0.568** 0.580** 0.567** 0.545** 0.547**
Parent religiosity 0.998*** 0.998*** 0.998*** 0.998*** 0.998*** 0.998*** 0.998*** 0.998*** 0.998*** 0.998***
Peers attend church regularly 0.861*** 0.863*** 0.864*** 0.860*** 0.864*** 0.860*** 0.864*** 0.864*** 0.863*** 0.861***
Total Clinics 0.983* 1.008
Title X Clinics 0.992 0.997
Planned Parenthood 0.951 0.943
Health Departments 0.991 0.995
Hospitals 0.980* 0.999
Comm. Mig. H. C. 0.971*** 0.967**
County Charact. Yes Yes Yes Yes Yes Yes Yes Yes Yes
State Policies Yes Yes Yes Yes Yes Yes Yes Yes
Observations 2,505 2,505 2,505 2,505 2,505 2,505 2,505 2,505 2,505 2,505 2,505
*** p<0.01, ** p<0.05, * p<0.1
All models includes State level fixed effects
Table 9b: Relative Risk of Teen Pregnancy by Income >50% to <=150% of Pov. Line, 1997-2003 (Odds Ratios)
VARIABLES Model 1 Model 2 Model 3 Model 4 Model 5 Model 6 Model 7 Model 8 Model 9 Model10 Model11
Black (White omit) 1.142 1.244 1.280 1.288 1.288 1.300 1.273 1.284 1.287 1.284 1.291
Hispanic 1.227 1.503* 1.577** 1.531* 1.533* 1.521* 1.538* 1.537* 1.531* 1.503* 1.513*
Other/Mixed Race 1.214 1.210 1.313 1.468 1.472 1.420 1.503 1.473 1.467 1.431 1.425
Married/cohab. (conc.) 1.177 1.188 1.243 1.243 1.245 1.243 1.236 1.244 1.245 1.237
In school 0.724** 0.736* 0.697** 0.697** 0.695** 0.697** 0.698** 0.697** 0.694** 0.698**
Roman Catholic (No Relig omit) 1.021 1.016 1.031 1.033 1.020 1.035 1.019 1.032 1.016 1.032
Other Christian 1.436 1.398 1.376 1.377 1.360 1.355 1.364 1.377 1.362 1.355
Other religion 0.766 0.809 0.827 0.828 0.820 0.822 0.810 0.828 0.822 0.805
Parent religiosity 0.999*** 0.999*** 0.999*** 0.999*** 0.999*** 0.999*** 0.999*** 0.999*** 0.999*** 0.999***
Peers attend church regularly 0.948 0.943 0.955 0.954 0.955 0.953 0.956 0.955 0.953 0.952
Total Clinics 1.001 1.026*
Title X Clinics 0.987 0.973
Planned Parenthood 1.038 0.997
Health Departments 0.969** 0.982
Hospitals 1.001 1.010
Comm. Mig. H. C. 0.989 0.972***
County Charact. Yes Yes Yes Yes Yes Yes Yes Yes Yes
State Policies Yes Yes Yes Yes Yes Yes Yes Yes
Observations 2,881 2,881 2,881 2,881 2,881 2,881 2,881 2,881 2,881 2,881 2,881
*** p<0.01, ** p<0.05, * p<0.1
All models includes State level fixed effects
Table 9c: Relative Risk of Teen Pregnancy by Income >150% of Pov. Line, 1997-2003 (Odds Ratios)
VARIABLES Model 1 Model 2 Model 3 Model 4 Model 5 Model 6 Model 7 Model 8 Model 9 Model10 Model11
Black (White omit) 1.867*** 2.162*** 2.101*** 2.013*** 2.008*** 2.008*** 1.995*** 2.014*** 2.023*** 2.011*** 1.979***
Hispanic 1.491** 1.374** 1.350* 1.305 1.303 1.304 1.299 1.306 1.293 1.301 1.274
Other/Mixed Race 1.575 1.550 1.782 1.707 1.713 1.712 1.728 1.694 1.713 1.686 1.703
Married/cohab. (conc.) 2.015*** 2.037*** 2.100*** 2.100*** 2.100*** 2.091*** 2.100*** 2.103*** 2.115*** 2.123***
In school 0.504*** 0.518*** 0.496*** 0.496*** 0.496*** 0.496*** 0.496*** 0.494*** 0.495*** 0.497***
Roman Catholic (No Relig omit) 1.175 1.136 1.112 1.113 1.112 1.105 1.111 1.102 1.110 1.100
Other Christian 1.418 1.351 1.291 1.290 1.290 1.286 1.290 1.285 1.293 1.281
Other religion 0.865 0.839 0.829 0.828 0.826 0.833 0.830 0.834 0.836 0.851
Parent religiosity 0.999*** 0.999*** 0.999*** 0.999*** 0.999*** 0.999*** 0.999*** 0.999*** 0.999*** 0.999***
Peers attend church regularly 0.893*** 0.893*** 0.903*** 0.903*** 0.902*** 0.903*** 0.903*** 0.902*** 0.901*** 0.902***
Total Clinics 1.003 1.027*
Title X Clinics 1.003 0.991
Planned Parenthood 1.027 1.007
Health Departments 0.993 0.994
Hospitals 0.988 0.988
Comm. Mig. H. C. 0.986** 0.971***
County Charact. Yes Yes Yes Yes Yes Yes Yes Yes Yes
State Policies Yes Yes Yes Yes Yes Yes Yes Yes
Observations 8,550 8,550 8,550 8,550 8,550 8,550 8,550 8,550 8,550 8,550 8,550
*** p<0.01, ** p<0.05, * p<0.1 All models includes State level fixed effect
44
44
N
u
m
b
er
o
f
C
lin
ic
s
FIGURES
Figure 1:
Average Number of Publicly Funded Family
Planning Clinics per US County by Center
Type, 1997-2003, (N=4,385)
9
8
7 Total Clinics
6 Title X Funded Clinics
5 Planned Parenthood
4
Hospitals
3
Health Departments 2
Community Migrant Health
1 Centers
0
1997 1998 1999 2000 2001 2002 2003
45
45
REFERENCES
Bertrand, Jane T.; Hardee, Karen; Magnani, Robert J. ; Angle, Marcia A. June 1995. ―Access, Quality of Care and Medical Barriers In Family Planning Programs.‖
International Family Planning Perspectives 21(2): 64-69+74.
Bongaarts, John and Judith Bruce. ―The Causes of Unmet Need for Contraception and the Social Content of Services.‖ Studies in Family Planning 26 (2): 57-75 (Mar. - Apr., 1995).
Bongaarts, John and Steven W. Sinding. ―A Response to Critics of Family Planning
Programs.‖ International Perspectives on Sexual and Reproductive Health 35 (1): 39-44 (Mar.,2009).
Borrero, Sonya; Schwarz, Eleanor B.; Creinin, Mitchell; and Said Ibrahim, Said. 2009. ―The Impact of Race and Ethnicity on Receipt of Family Planning Services in the United States.‖ Journal of Women’s Health 18(1): 91-96.
Brondola, Elizabeth; Gallo, Linda C.; Myers, Hector F. 2009. ―Race, racism and health: disparities, mechanisms, and interventions.‖ Journal of Behavioral Medicine 32:1-8. Cameron, Roy; Brown, K. Stephen; Best, Allan; Pelkman, Christine L.; Madill, Cheryl L.;
Manske, Stephen R.; and Payne, Elizabeth. 1999. ―Effectiveness of a Social Influences Smoking Prevention Program as a Function of Provider Type, Training Method, and School Risk.‖ American Journal of Public Health 89(12): 1827-1831. Cohen, Susan A. 2011. ―The Numbers Tell the Story: The Reach and Impact of Title X.‖
Guttmacher Policy Review 14(2): Spring 2011.
Darney, Philip D. Oct, 2011. ―Family Planning and the Future.‖ American Journal of Obstetrics and Gynecology Supplement: S26-S28.
Darroch, Jacqueline E.; Singh, Susheela; and Frost, Jennifer J. 2001. ―Differences in Teenage Pregnancy Rates among Five Developed Countries: The Roles of Sexual Activity and Contraceptive Use.‖ Family Planning Perspectives 33(6): 244- 250+281.
Desai, Jaikishan and Tarozzi, Alessandro. 2011. ―Microcredit, Family Planning Programs, and Contraceptive Behavior: Evidence from a Field Experiment in Ethiopia.‖
Demography 48:749–782.
Elston, Jennifer; Martin, Susan; Morlock, Robert; Divine, George; and Xi, Hugo. 2001. ―Provider Type and the Receipt of General and Diabetes-Related Preventative Health Services Among Patients with Diabetes.‖ Medical Care 39(5): 491-499.
46
46
Finer, Lawrence B. and Henshaw, Stanley. June 2006. ―Disparities in Rates of Unintended Pregnancy in the United States, 1994 and 2001.‖ Perspectives on Sexual and Reproductive Health 38(2): 90-96.
Finn, Robert. Feb. 2010. ―Uptick Seen in Teen Pregnancy Rates, Study Finds.‖ Pediatric News: 42.
Fiscella, Kevin; Franks, Peter; Doescher, Mark P.; Saver, Barry G. Jan. 2002. ―Disparities in Health Care by Race, Ethnicity, and Language among the Insured: Findings from a National Sample.‖ Medical Care 40(1): 52-59.
Frankenberg, E., A. Buttenheim, et al. 2009. ―Do women increase their use of reproductive health care when it becomes more available? Evidence from Indonesia.‖ Studies in Family Planning 40(1): 1-12.
Frost, Jennifer J. 2001. ―Public or Private Providers? U.S. Women's Use of Reproductive Health Services.‖ Family Planning Perspectives 33(1): 4-12.
Frost, Jennifer J. and Darroch, Jacqueline E. 2008. ―Factors Associated with Contraceptive Choice and Inconsistent Method Use, United States, 2004.‖ Perspectives on Sexual and Reproductive Health 40(2): 94-104.
Frost, Jennifer J.; Henshaw, Stanley K.; and Sonfield, Adam. May 2010. ―Contraceptive Needs and Services: National and State Data, 2008 Update.‖ Guttmacher Institute. Frost, Jennifer J.; Ranjit, Nalini; Manzella, Kathleen; Darroch, Jacqueline E.; and Audam,
Suzette. May/June 2001. ―Family Planning Clinic Services in the United States: Patterns and Trends in the Late 1990s.‖ Family Planning Perspectives 33(3). Frost, Jennifer J.; Singh, Susheela; and Finer, Lawrence B. 2007. ―Factors Associated with
Contraceptive Use and Nonuse, United States, 2004.‖ Perspectives on Sexual and Reproductive Health 39(2): 90-99.
Fu, Haishan; Darroch, Jacqueline E.; Henshaw, Stanley K.; Kolb, Elizabeth. May-June 1998. ―Measuring the Extent of Abortion Underreporting in the 1995 National Survey of Family Growth.‖ Family Planning Perspectives 30(3): 128-133+138.
Goodman, Harold S.; Manski, Marion C.; Williams, John N.; and Manski, Richard J. 2005. ―An Analysis of Preventive Dental Visits by Provider Type, 1996.‖ Journal of the American Dental Association 136(2): 221-228.
Gregory, Patrice M.; Malka, Edmond S.; Kostis, John B.; Wilson, Alan C.; Arora, Jasmine K.; Rhoads, George G. 2000. ―Impact of Geographic Proximity to Cardiac
47
47
Guttmacher Institute. 2009. ―Contraceptive Needs and Services, 2006.‖ <www.guttmacher.org/pubs/win/allstates2006.pdf>
Hammerslough, Charles R. June 1992. ―Proximity to Contraceptive Services and Fertility Transition in Rural Kenya.‖ International Family Planning Perspectives 18(2): 54-58. Jagannatha, Radha. Nov. 2001. ―Relying on Surveys to Understand Abortion Behavior: Some
Cautionary Evidence.‖ American Journal of Public Health 91(11): 1825-1831. Jutte, Douglas P.; Roos, Noralou P.; Brownell, Marni D.; Briggs, Gemma; MacWilliam,
Leonard; and Roos, Leslie L. Sept.-Oct. 2010. ―The Ripples of Adolescent
Motherhood: Social, Educational, and Medical Outcomes for Children of Teen and Prior Teen Mothers.‖ Academic Pediatrics 10(5):293-301.
Keefer, Philip and Khemani, Stuti. 2005. ―Democracy, Public Expenditures, and the Poor: Understanding Political Incentives for Providing Public Services.‖ The World Bank Research Observer 20(1): 1.
Koch, Dirk-Jan; Dreher, Axel; Nunnenkamp, Peter; and Thiele, Rainer. 2009. ―Keeping a Low Profile: What Determines the Allocation of Aid by Non-Governmental Organizations?‖ World Development 37(5): 902–918.
Kost, Kathryn, Landry, David J., and Darroch, Jacqueline E. Sept.-Oct. 1998. ―The Effects of Pregnancy Planning Status on Birth Outcomes and Infant Care.‖ Family Planning Perspectives 30 (5): 223-230.
Lafata, Jennifer Elston; Martin, Susan; Morlock, Robert; Divine, George; and Xi, Hugo. May 2001. ―Provider Type and the Receipt of General and Diabetes-Related Preventive Health Services among Patients with Diabetes.‖ Medical Care 39(5): 491-499. LaVela, Sherri L.; Smith, Bridget; Weaver, Frances M.; Miskevics, Scott A. August 6, 2004.
―Geographical Proximity and Health Care Utilization in Veterans with SCI&D in the USA.‖ Social Science & Medicine 59: 2387–2399.
Lindberg, L. D., Frost, J. J., Sten, C. and Dailard, C. 2006. ―Provision of Contraceptive and Related Services By Publicly Funded Family Planning Clinics, 2003‖. Perspectives on Sexual and Reproductive Health 38: 139–147.
Martinez, Chandra A. GM, Mosher WD, Abma JC, Jones J. 2005. ―Fertility, family planning, and reproductive health of U.S. women: Data from the 2002 National Survey of Family Growth.‖ National Vital Health Statistics 23(25):12.
Miller, Amelia R. 2011. ―The Effects of Motherhood Timing on Career Path.‖ Journal of Population Economics 24: 1071–1100.
48
48
between Teenage Childbearing and Psychological Distress Using Longitudinal Evidence.‖ Journal of Health and Social Behavior 50(3): 310-326.
Mosher, William D..; Martinez, Gladys M..; Chandra, Anjani.; Abma, Joyce C.; and Willson, Stephanie J. 2004. ―Use of Contraception and Use of Family Planning Services in the United States: 1982–2002. Advance Data From Vital and Health Statistics Num. 350. Centers for Disease Control and Prevention.
Phillips, J., Greene, W., & Jackson, E. 1999. ―Lessons from community-based distribution of family planning in Africa‖ Policy Research Division Working Paper 121. The
Population Council.
Planned Parenthood Federation of America. May 2008. ―Title X: America‘s Family Planning Program.‖ Fact Sheet, Published by the Katharine Dexter McCormick Library
http://www.plannedparenthoodaction.org/files/Title_X.pdf
Rindfuss, Ronald R., Guilkey, David K., Morgan, S. Philip, and Kravdal, Øystein. Dec. 2010. ―Child-Care Availability and Fertility in Norway.‖ Population and Development Review 36(4): 725–748.
Sable, Marjorie R. and Libbus, M. Kay. Aug. 1998. ―Beliefs Concerning Contraceptive Acquisition and Use Among Low-Income Women.‖ Journal of Health Care for the Poor and Underserved 9(3): 262-275.
Santelli, John and Kirby, Douglas. 2010 ―State Policy Effects on Teen Fertility and Evidence-Based Policies.‖ Journal of Adolescent Health 4(6): 515–516. Santelli, John and Andrea J. Melnikas. 2010. ―Teen Fertility in Transition: Recent and
Historic Trends in the United States.‖ Annual Review of Public Health 31: 371-383. Senanayake, Pramilla. 1996. ―Emergency Contraception: The International Planned
Parenthood Federation‘s Experience.‖ International Family Planning Perspectives
22(2): 69-70.
Smith C J, Hanham R Q, 1981. "Proximity and the formation of public attitudes towards mental illness" Environment and Planning 13(2): 147 – 165.
Sonfield, Adam; Kost, Kathryrn Kost; Benson Gold, Rachel; and Finer, Lawrence B. June 2011. ―The Public Costs of Births Resulting from Unintended Pregnancies: National and State-Level Estimates.‖ Perspectives on Sexual and Reproductive Health 43(2): 94-102.
49
49