ASSOCIATION OF OBSTRUCTIVE AIRWAY DISEASE AND LUNG
FUNCTION WITH INCIDENT HEART FAILURE, AND OPTIMAL PREDICTION
OF HEART FAILURE IN COMMUNITY SETTINGS:
THE ATHEROSCLEROSIS RISK IN COMMUNITIES STUDY
Sunil Kumar Agarwal, MD, MPH
A dissertation submitted to the faculty of the University of North Carolina at Chapel Hill in partial fulfillment of the requirements for the degree of Doctor of Philosophy in the Department of Epidemiology from the School of Public Health.
Chapel Hill 2010
Approved by:
Advisor: Gerardo Heiss MD, PhD Readers: Graham R. Barr, MD, PhD
ABSTRACT
Sunil K. Agarwal, MD, MPH: Association of Obstructive Airway Disease and Lung Function with Incident Heart Failure, and Optimal Prediction of Heart Failure in
Community Settings: The Atherosclerosis Risk in Communities Study (Under the direction of Gerardo Heiss, MD, PhD)
Background: This epidemiologic investigation of heart failure (HF) has two components, one focused on airway disease as a putative antecedent factor to HF and the other centered on the prediction of HF as a means toward reducing the growing burden of HF in the population.
Methods Forced Expiratory volume-1 second (FEV1) and covariates were measured for the ARIC cohort in 1987-89. Incident HF was ascertained annually from hospital records and death certificates. Cox proportional hazards models were used to derive a risk score to predict 10 years risk of HF. Area under curve (AUC) and Net Reclassification Improvement (NRI) were estimated as measures of discrimination.
Results Over an average follow-up of 14.9 years, 1369 (10%) ARIC participants free of HF at baseline had incident HF. The hazard ratios (HRs) for HF increased monotonically over descending quartiles of FEV1. The associations were seen in each of cigarette smoking strata, inclusive of never-smokers. After multivariable adjustment for traditional cardiovascular risk factors at baseline, the HRs of HF and their 95% confidence intervals (CI) comparing the lowest with the highest quartile of FEV1 were 3.91(2.40, 6.35) for white women, 3.03(2.12, 4.33) for white men, 2.11(1.33, 3.34) for black women and 2.23(1.37, 3.59) for black men. The multivariable adjusted hazards of HF were higher in those with FEV1/FVC < 70% vs. ≥ 70%: HR 1.42 (95% CI 1.22, 1.68).
improved for 23.5% individuals relative to the Framingham, and 12.8% relative to the Health-ABC classification.
ACKNOWLEDGMENTS
I am deeply thankful to the faculty, staff, and students at the University of North Carolina in Chapel Hill for sharing their wisdom and time leading to the
development of this work.
Prof. Gerardo Heiss has not only shaped this work but has also shaped me both professionally and personally. He was always kind with his time – despite his busy schedule. Thanks for involving me in the ARIC study heart failure surveillance – it has been an amazing learning experience for me.
Thanks to Prof. Wayne Rosamond for his excellent guidance in work related to heart failure and its community surveillance. Drs. Patricia Chang and Graham Barr’s have shared their insights into this work where measurement of both the exposure and outcome is still unsettled.
Thanks to Prof. Lyold E Chambless, Prof. Eyal Shahar and Dr. Stephen Cole for asking me difficult questions and pushing me to think beyond the obvious. Thanks to ARIC study investigators Drs. Joseph Coresh, Aaron Folsom, and Christie Ballantyne for being open and encouraging about the use of the ARIC study dataset and for providing informal feedback on this work. Other coauthors including Drs. Laura Loehr, Dalane Kitzman, Hanyu Ni, Brad Astor, Alain Bertoni, Stuart D. Russell, and Mr. Max He have provided valuable inputs in this work.
Thanks to staff at UNC particularly Joy Wood, Nancy Colvin, Phyllis Johnson, Carmen Woody, Jadie Baldwin, Carolyn Cooke, Nell Malone, Chandra Caldwell, for their guidance, love and help through the years at UNC making life easier and fun.
The Atherosclerosis Risk in Communities Study is carried out as a collaborative study supported by National Heart, Lung, and Blood Institute contracts HC-55015, HC-55016, HC-55018, HC-55019, HC-55020, N01-HC-55021, and N01-HC-55022. Thanks to the cohort participants and ARIC staff for their participation and work.
TABLE OF CONTENTS
LIST OF TABLES... ix
LIST OF FIGURES ... xi
LIST OF ABBREVIATIONS... xiii
CHAPTER I. SPECIFIC AIMS... 1
II. BACKGROUND AND SIGNIFICANCE...4
A. HEART FAILURE: diagnosis, risk factors, predictors, and burden ...4
B. COPD: definition, patho-physiology, and burden...10
C. COPD/Lung function and heart failure...14
D. Studies of COPD /lung function as a risk factor for heart failure...17
E. Validation studies of ICD codes to define heart failure...17
F. Risk score functions and their utility ... …………18
G. Methods to adjust for Bias...23
H. Summary and public health significance...24
III. METHODS ...26
B. Protection of human subjects...27
C. Ascertainment of heart failure events ...28
D. Incident heart failure event criteria...28
E. Measurement of primary exposures lung functions and COPD…...29
F. Baseline covariate definitions ...29
G. Statistical power analysis ...30
I. Statistical analysis...33
J. Methodological strengths and limitations...41
IV. RESULTS. ...44
A. Manuscript 1: Obstructive airway disease, lung function and Incident heart failure: the Atherosclerosis Risk in Communities (ARIC) Study...44
1. Introduction...44
2. Methods...45
3. Results...50
4. Discussion...52
B. Manuscript 2: Optimal prediction of heart failure in community settings: The Atherosclerosis Risk in Communities (ARIC) Study...73
1. Introduction...73
2. Methods...74
3. Results ...80
4. Discussion...82
A. Recapitulation of overall specific aims...97
B. Discussion of results ...97
C. Degree to which doctoral goals have been met...99
D. Strengths and Limitations...100
E. Future directions...101
APPENDICES... ...102
A. IRB certification...102
B. Supplemental Results, Manuscript 1...104
C. Supplemental Results, Manuscript 2...106
LIST OF TABLES
Table
1. Global Initiative for Chronic Lung Disease Classification for lung
diseases………...13 2. Common co-morbidities seen in hospital discharges among ≥ 45 years from the community hospitals in the United States: The National Inpatient Sample 2006………...15
3. Comparison of study design and elements for the existing and proposed HF risk score………...21 4. ARIC study population by race at study enrollment……….27 5. Area under receptor operating curve: minimum difference in AUC
detectable at two values of power………32 6. Reclassification of individuals into risk categories by an extended model and appropriateness of such reclassification……….36 7. Characteristics of study participants at baseline and incident heart failure across quartiles of FEV1(N=13360)………...66 8. Hazard ratios of HF contrasting the lowest and highest quartiles of FEV1 by incremental level of covariate adjustments (N = 13360)………..67
9. Hazard ratios of HF for airway obstruction, and self reported diagnosis of respiratory illness. (N = 13130)………...68
10. Sensitivity analysis of a ratio estimate for association between FEV1 and incident HF: The ARIC study………72
11. Characteristics at baseline by heart failure during follow up, age
adjusted hazard ratios, AUC, and GB statistics……….88
12a. Regression coefficients (log of hazard ratio) from multivariable models fit to basic ARIC risk score variables, for all participants and by race and gender groups in the ARIC cohort………..89 12b. Heart failure hazard ratio estimates from multivariable models fit with the variables in the basic ARIC heart failure risk score, for all participants and by race and gender ; the ARIC cohort……….90
14. Discrimination and goodness of fit statistics comparing the basic ARIC heart failure risk score model with a full model including biomarkers……91 15a. Net improvement on reclassification of individual risk of heart failure using the variables in the basic ARIC risk score and those in the
Framingham heart failure risk score variables……….………..92 15b. Net improvement on reclassification of individual risk of heart failure using the variables in the basic ARIC risk score and those in the Heath-ABC heart failure risk score variables……….92 15c. Net improvement on reclassification of individual risk of heart failure using the variables in the basic ARIC risk score and those in the ARIC risk score with biomarkers………93 16. Quartile boundaries of FEV1 and FVC by race and gender………...104
17. GOLD classification and risk of incident heart failure:
The ARIC study ………...105
18. Obstructive, and restrictive, lung disease and
LIST OF FIGURES
Figure:
1. Schematic depiction of Forced Expiratory volume in 1 second (FEV1) and Forced Vital Capacity……….12
2. Conceptual framework of factors linking COPD and heart failure…….16 3. Minimum hazard ratio detectable with study size
under range of power………... 31 4. Estimated rate of new-onset heart failure per 1000 person years among black and white cohort members during an average study follow up of 14.9 years by gender and race-specific quartiles of forced expiratory volume, 1s (FEV1)……….69
5. Estimated hazard ratio (95% confidence intervals) of incident heart failure for the quartiles of forced expiratory volume in 1second for each gender and race, adjusted for age, smoking, height, and height*height. Y-axis is plotted on a log scale with base 2………..70
6. Multivariable adjusted cumulative-events estimates for incident heart failure by quartiles of forced expiratory volume in 1 second i.e., Q1 to Q4..71 7. Panel a. Four-year observed and expected HF events by decile of linear risk, estimated by applying published Framingham beta estimates to the ARIC cohort (year-year), Panel b. Fifteen-year observed and expected HF events by decile of linear risk, estimated by applying published Health-ABC beta estimates to the ARIC cohort (1987-2005)………94 8. Number of observed versus predicted heart failure events during study follow up by decile of the ARIC heart failure risk score………95 9. Ten year probability of heart failure by the decile of risk of the
LIST OF ABBREVIATIONS
ACC American College of Cardiology AHA American heart Association
ARIC Atherosclerosis Risk in Communities AUC Area Under the Curve
BMI Body mass index
BNP B-type natriuretic peptide BP Blood pressure
CAD Coronary artery disease CHD Coronary heart disease CHS Cardiovascular Health Study CI Confidence interval
CVD Cardiovascular disease DAG Directed acyclic graph
FEV1 Forced expiratory volume in 1 second FVC Forced Vital Capacity
GOLD Global Initiative for Chronic Obstructive Lung Disease HF Heart failure
HDL-C High-density lipoprotein cholesterol HR Hazard ratio
ICD International Classification of Disease
ICD-9-CM International Classification of Disease, 9th revision, clinical modification ICD-10-CM International Classification of Disease, 10th revision
LDL-C Low-density lipoprotein cholesterol LRT Likelihood ratio test
LVH Left ventricular hypertrophy MD Maryland
MI Myocardial infarction MN Minnesota
MS Mississippi
NIH National Institute of Health NC North Carolina
NPV Negative predictive value
NRI Net Reclassification Improvement PPV Positive predictive value
RCT Randomized controlled trial ROC Receiver operating curve RR Relative risk
Chapter I
SPECIFIC AIMS
This doctoral research is set out with two primary goals. The first
examined whether obstructive airway diseases are associated with higher incidence of heart failure in a middle aged cohort of black and white, men and
women in four US communities. To this end, the presence of airway obstructive disease at baseline was ascertained using self reports and measured lung function, and classified according to Global Initiatives for Obstructive Lung
Disease classification. In addition, the relationship between stature-adjusted continuous lung function measures, i.e., forced expiratory volume – 1 second
(FEV1) and incident heart failure was examined. Further, the potential of inflammation as a mediator of the putative association was examined using an available set of systemic markers of inflammation. Finally, the sensitivity of the
putative association to measurement error in the outcome was explored.
ARIC heart failure risk score. The external validity of the extant heart failure risk scores, the Framingham Heart Study and Health ABC Study scores, were examined in a cohort of African American and white middle-aged men and
women. Follow-up for new-onset hospitalization and mortality attributed to heart failure was available from 1996-98 through 2005.
Novel estimation methods were used to evaluate the performance of the ARIC heart failure risk score relative to previously published methods.
The specific aims are listed below:
1a Test the association of lung function measures (FVC, and FEV1) with
risk of incident heart failure (HF).
i) Evaluate whether the above relationship differs by
smoking status.
ii) Evaluate whether the above relationship is explained by
coronary heart disease at baseline or during follow-up
iii) Evaluate whether the above relationship is attenuated
after adjusting for potential markers of inflammation/
hypercoagulability, and maximal inspiratory pressure (MIP), as these
may be intermediary in the hypothesized associations.
1b Test the association between baseline COPD (self report of
productive cough, self report of physician diagnosis, and GOLD
2a Examine the validity of the extant HF risk scores in a population
based cohort of middle aged black and white, men and women from four
US communities.
2b Derive a risk function with elements readily available to general
practitioners to predict the 10 year risk of HF in a community based cohort
of middle aged men and women.
1) Compare its ability to discriminate between those who had HF from
those who didn’t (discrimination) and concordance between expected
and observed events by deciles of risk.
2) Compare the performance of the ARIC HF risk score with the risk
functions estimated in this study population using the variables from
extant risk functions.
3) Examine the performance of the ARIC HF risk score based on net
reclassification improvement relative to the extant risk functions.
2c Evaluate the incremental value of cystatin-C and hs-CRP for the
Chapter II
BACKGROUND AND SIGNIFICANCE
2A. HEART FAILURE: Diagnosis, risk factors, predictors, and
burden
2.A.1 Public Health Burden of Heart Failure
Heart Failure (HF) stands out as a major public health problem in the economically developed nations (Garg, Packer et al. 1993; Rosamond, Flegal et al. 2008). Its incidence approaches 10 per 1000 population after age 65 years
(Lloyd-Jones, Larson et al. 2002), Despite improvements in medical management and advances in therapy, its incidence and prevalence have increased (Roger, Weston et al. 2004). Overall, it is estimated that about 5 million
patients have HF in the U.S., and about 500,000 individuals are diagnosed with HF for the first time each year (Rosamond, Flegal et al. 2008). Its prognosis is
grim (26% mortality at one year)(Levy, Kenchaiah et al. 2002) and the costs of its treatment exceed those for coronary artery disease and cancer combined (5.4% of the total US health care expenditures)(O'Connell and Bristow 1994).
Nearly 300,000 patients are estimated to die of HF as a primary or
2009). Although age-adjusted mortality rates attributable to HF show a declining trend, the overall mortality has increased with the aging of the population (1998). The average one-year survival for individuals with ACC/AHA
stage D HF is less than 20% (Ammar, Jacobsen et al. 2007), a prognosis worse than that of many common cancers (Hobbs 2002). The 2004 overall death rate
per 100 for HF was 19.1, with the highest rate among black males (22.9) and the lowest in white females (18.3)(Rosamond, Flegal et al. 2007). Importantly, sudden cardiac death is common (40% of all deaths) among individuals with HF
(Uretsky and Sheahan 1997).
Healthcare burden and cost HF is the leading indication for hospitalization in the United States among patients older than 65 years. Hospital discharges with an HF diagnosis rose from 399,000 in 1979 to 1,009,000 in 2004 (Rosamond, Flegal
et al. 2008). Of the estimated 22.6 million hospitalizations among >45 years old, HF was a diagnosis seen in about 19.2% of the hospital discharges. It was a
primary discharge diagnosis in 4.7% (n=1.05 million) and secondary in 14.5% (n = 3.3 million) (unpublished; Agarwal, McNeill et al. 2009).
Treatment costs for HF amount to 5.4% of the total health care expenditure (O'Connell and Bristow 1994). In 2001, $4.0 billion ($5912 per
2.A.2 The Challenge of Heart Failure Diagnosis in Primary Care Settings
HF is a clinical syndrome and the result of complex pathological
processes that culminate in the failure of the heart to circulate blood at normal pressure to meet the body’s need (Braunwald, Zipes et al. 2001). For diagnostic
purposes the ACC/AHA advocate consideration of appropriate symptoms and signs when present, plus objective evidence and response to treatment when in doubt (Hunt, Abraham et al. 2005). Though sensitive, the signs and symptoms of
HF have low specificity (Rutten, Cramer et al. 2006). This problem is accentuated due to their high prevalence in the elderly, the obese and in women (Dahlstrom
2005). Importantly, unrecognized ventricular dysfunction and HF are frequent among individuals with comorbidities, many of whom have manifestations such as dyspnea and pedal edema (McDonagh, Morrison et al. 1997; Mosterd, Hoes
et al. 1999). There is ample evidence of misdiagnosis by physicians when objective criteria are used (Remes, Miettinen et al. 1991). Thus, a definitive
diagnosis of HF entails the use of cardiac imaging (e.g. echocardiography and radio-nuclide ventriculography to assess left ventricular dysfunction), and referral to a cardiologist.
Heart failure is broadly classified as systolic or diastolic in nature. At this
72h of an HF event, i.e. the presence of symptoms of cardiac congestion and response to diuretics (Vasan and Levy 2000). However, recent studies have shown that as compared to systolic failure, diastolic failure is equally prevalent
(Bursi, Weston et al. 2006), carries a similarly poor prognosis (Owan, Hodge et al. 2006), and requires treatment of comparable cost(Liao, Jollis et al. 2006).
Population based studies have further reported that at least half of the individuals with systolic or diastolic left ventricular (LV) dysfunction on echocardiography have never been diagnosed as having heart failure (McDonagh, Morrison et al.
1997; Mosterd, Hoes et al. 1999).
To manage their patients well, primary care practitioners should be better able to recognize and quantify HF risk early by evaluating an individual’s risk of decompensation requiring hospitalization for HF. To this end, risk score functions
may be helpful for timely referral and diagnosis in patients at high risk of HF.
2.A.3. Major known risk factors
Coronary Heart disease, Diabetes, Hypertension, Left ventricular hypertrophy, valvular heart disease are considered to be common and potentially
modifiable risk factors of Heart Failure. Other common and increasing prevalent risk factors include higher body fat (reflected by high BMI or Waist
2.A.4 Predictors for incident heart failure in the community
2.A.4.1 The role of history, symptoms, signs and ECG. Considerable information is available to providers of primary care to assess and predict an individual’s risk
of developing symptomatic HF, such as demographic information, medical history, physical examination, a basic biochemistry panel, and an ECG. The
predictive accuracy of various co-morbid conditions, symptoms, signs and ECG patterns has been studied in both clinical and population settings, mostly in Caucasians. It has been reported that most of the symptoms and signs
commonly associated with HF are sensitive but non-specific, while the less prevalent or subtle ones occurring in moderate to severe disease are specific,
but less sensitive. A normal ECG is highly specific on the other hand, virtually ruling out HF or LV dysfunction (Rihal, Davis et al. 1995). Further, abnormal ECGs have been shown to have good sensitivity, i.e., 73-94% in a meta-analysis
(Khunti, Squire et al. 2004) and 81% in the community-based EPICA study (Fonseca, Mota et al. 2004). Thus, a combined use of a patient’s history, physical
exam, basic laboratory investigations and ECG may provide an optimum tool for patient risk stratification. This has been attempted to a limited extent on data from two cohorts, as discussed below. Studies using ARIC cohort data have
found ECG parameters (Rautaharju, Prineas et al. 2007), renal function (Kottgen, Russell et al. 2007), diabetes (Pazin-Filho, Kottgen et al. 2008), and respiratory
2.A.4.2 The potential role of biomarkers In recent years, biomarkers have been the focus of research in cardiovascular diseases to improve diagnosis. Despite their considerable potential and the low specificity of many other risk factors,
biomarkers have not yet been considered for HF risk stratification.
2.A.4.2a. High sensitivity C-reactive protein (hs-CRP) CRP is an acute phase protein produced by liver in response to increase in several pro-inflammatory cytokines, especially interleukin 6 and tumor necrosis factor. It is a well validated,
systemic marker of inflammation. Several reports have suggested its independent association with incident HF(Kardys, Knetsch et al. 2006; Bahrami,
Bluemke et al. 2008; Williams, Shah et al. 2008).
2.A.4.2b. Cystatin C It is a cysteine protease inhibitor secreted by most human
cells and metabolized in the proximal tubules in kidney after being freely filtered at the glomerulus. It is presently considered a more sensitive marker of mild renal
dysfunction than creatinine and has been found associated with incident heart failure(Sarnak, Katz et al. 2005; Moran, Katz et al. 2008).
2.A.4.2c N-terminal pro-B-type natriuretic peptide (NT-proBNP) Plasma B-type natriuretic peptide (BNP) and its amino terminal pro-hormone (NT-proBNP) are
risk prediction of HF in the community (Ng, Geeranavar et al. 2004). Although the European Society of Cardiology has recently introduced BNP in the diagnostic algorithms of HF (Swedberg, Cleland et al. 2005), AHA awaits further
investigations to clarify their role (Hunt, Abraham et al. 2005).
2.A.4.2d. High Sensitivity Troponin T (hs-TropT). Cardiac troponins in serum are highly specific markers of myocardial injury commonly used for the diagnosis of acute ischemic coronary events (Antman, Tanasijevic et al. 1996; Donnelly and
Millar-Craig 1998; Lindahl, Toss et al. 2000; Apple, Wu et al. 2005). Several studies have reported an association between increased concentrations of
troponin measured in blood and HF prevalence, severity and prognosis (Sato, Yamada et al. 2001; Sato, Taniguchi et al. 2002; Setsuta, Seino et al. 2002; Horwich, Patel et al. 2003; Ishii, Cui et al. 2003; Del Carlo, Pereira-Barretto et al.
2004), although concentrations are generally lower than those seen in patients with acute coronary syndromes (Aviles, Askari et al. 2002). The potential
association of low levels of troponin T detected with highly sensitive assays with incident HF awaits investigation.
B. COPD: definition, patho-physiology, and burden
B.1 Definition. Chronic obstructive pulmonary disease (COPD) is characterized
by non- or poorly reversible expiratory airflow limitation. The airflow limitation is usually progressive(Pauwels, Buist et al. 2001). Epidemiologic studies have for
sputum for at least 3 months during two consecutive years. There are two
subtypes of COPD present in individuals to varying extent, i.e., chronic bronchitis and emphysema. Thus, varying degrees of pathological small airway obstruction
and destruction of parenchyma constitute COPD.
The American Thoracic Society (ATS) recommends the use lung function quantified by spirometry to define COPD. Forced vital capacity (FVC) refers to the maximum amount of air an individual can exhale after maximal inspiration.
Forced expiratory volume in 1 second (FEV1) refers to maximum volume of air an individual can exhale in 1 second after maximal inspiration. A reduced ratio of
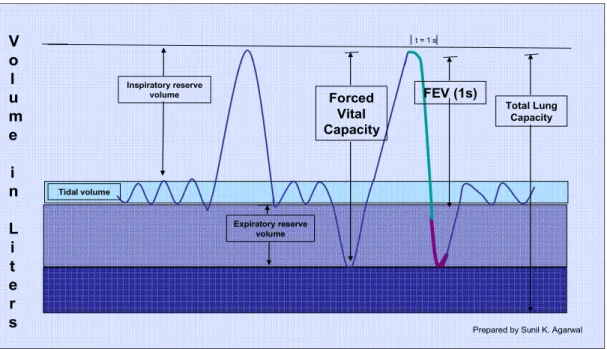
FEV1 to FVC is an indicator of obstruction to air outflow during the early phase of exhalation. Figure 1 depicts the main volumes and capacities derived from
Total Lung Capacity Tidal volume Inspiratory reserve volume Expiratory reserve volume Forced Vital Capacity FEV (1s) t = 1 s
V o l u m e i n L i t e r
s Prepared by Sunil K. Agarwal
Graphical representation of lung volumes and capacities (combination of two or more volumes). FEV1 = Forced Expiratory Volume (1second)
Figure 1. Schematic depiction of Forced Expiratory volume in 1 second (FEV1) and Forced Vital Capacity.
A lower peak flow is sensitive but not specific to diagnose COPD since it may be caused by other lung diseases as well as by poor effort.(Pauwels, Buist
et al. 2001). Thus, there has been emphasis on the use of FEV1/FVC ratio for clinical purposes. A cut point of 0.7 for this ratio has been suggested to define presence of COPD, after verifying that this restriction is irreversible by using a
bronchodilator. However, this ratio and its cut point may not be appropriate for all ages due to the age-related decline of volumes, which affects FEV1 more than
B.2 Burden of Heart Failure. In contrast to the decrease in death rates from
coronary heart disease and stroke the unadjusted death rates from COPD per
100,000 residents of the US has increased from 2.1 in 1950 to 40.2 in
2004.(NHLBI 2007) Further, these death rates are higher among whites (1/3rd for
males and 2/3rd for females) than blacks. (NHLBI 2007) Among industrialized nations the rates were lowest for Japan in 2004, while US ranked among the nations with higher rates.
B.3 Pathophysiology of COPD. Although most patients with lung disease
present chronic respiratory symptoms including productive cough before COPD, this is not always the case. The chronic airway disease components consist of mucus hypersecretion, ciliary dysfunction, airflow limitation. This, along with
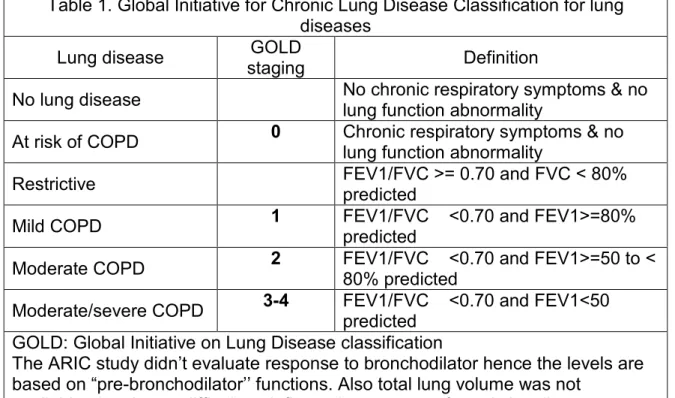
Table 1. Global Initiative for Chronic Lung Disease Classification for lung diseases
Lung disease GOLD
staging Definition
No lung disease No chronic respiratory symptoms & no
lung function abnormality
At risk of COPD 0 Chronic respiratory symptoms & no
lung function abnormality
Restrictive FEV1/FVC >= 0.70 and FVC < 80%
predicted
Mild COPD 1 FEV1/FVC <0.70 and FEV1>=80%
predicted
Moderate COPD 2 FEV1/FVC <0.70 and FEV1>=50 to < 80% predicted
Moderate/severe COPD 3-4 FEV1/FVC <0.70 and FEV1<50 predicted
GOLD: Global Initiative on Lung Disease classification
The ARIC study didn’t evaluate response to bronchodilator hence the levels are based on “pre-bronchodilator’’ functions. Also total lung volume was not
alveoli destruction leads to subsequent pulmonary hyperinflation, gas exchange abnormalities, pulmonary hypertension, and cor-pulmonale (Pauwels, Buist et al. 2001).
There is a gradual decline with pulmonary function (volumes) with age
accompanied by mild inflammation called senile emphysema. In a recent review, Iko et al. suggested that COPD represents a state of accelerated decline in lung function mediated by increased systemic and local inflammation (Tkac, Man et al.
2007). Smoking, air pollution, and exposure to noxious air stimuli are known, strong risk factors for the development of COPD. Other risk factors such as
absence of alpha-1 anti-trypsin enzyme are uncommon.
C. COPD/Lung function and Heart Failure
HF is common among patients with chronic obstructive pulmonary disease (COPD) and vice versa (Dahlstrom 2005; Rutten, Cramer et al. 2006). As seen in Table 2, in a nationally representative sample of about 20% of all hospitalizations
in community hospitals across the US, a concomitant ICD code of COPD was present in 34.6% of the hospitalizations with an ICD code for HF (Agarwal,
Table 2. Common comorbidities seen in hospital discharges among ≥ 45 years from the community hospitals in the United States: The National Inpatient Sample 2006 (Agarwal, McNeill et al. 2009)
HF code in the discharge diagnosis
Condition Definition Primary position Secondary position Absent
Coronary atherosclerosis 0.54 0.46 0.25
Cardiac dysrhythmia 0.44 0.41 0.16
Essential hypertension 0.43 0.40 0.49
Chronic obstructive pulmonary
disease 0.31 0.33 0.15
Diabetes mellitus without
complication 0.30 0.25 0.19
Disorders of lipid metabolism 0.27 0.23 0.26
Heart valve disorders 0.27 0.18 0.06
Hypertension with complications and
2* HTN 0.23 0.24 0.08
Deficiency and other anemia 0.22 0.23 0.16
Fluid and electrolyte disorders 0.22 0.32 0.21
Peri/endo/myocarditis or
cardiomyopathy 0.21 0.12 0.02
Chronic renal failure 0.20 0.18 0.06
Conduction disorders 0.20 0.13 0.05
COPD complicates both the diagnosis and treatment of HF. Both COPD and HF may present with symptoms of dyspnea and orthopnea. If beta blockers are indicated in a patient with HF, the presence of COPD, necessitates the use of
low-dose cardio-selective beta blockers with slow titration(Cazzola and Matera 2008).
Several lines of research point to a common soil for COPD and HF. A vast literature suggests a higher cardiovascular mortality in individuals with COPD and reduced lung function. Factors such as chronic muscle wasting,
increased risk. In the context of diseases affecting structure and function of lung pulmonary hypertension and cardiac dysfunction i.e. cor-pulmonale is well known(Budev, Arroliga et al. 2003). In addition, influenza vaccination, primarily
reducing serious lung disease and mortality(Nichol, Margolis et al. 1994), also prevents new onset of HF(Davis, Taubert et al. 2006). A schematic
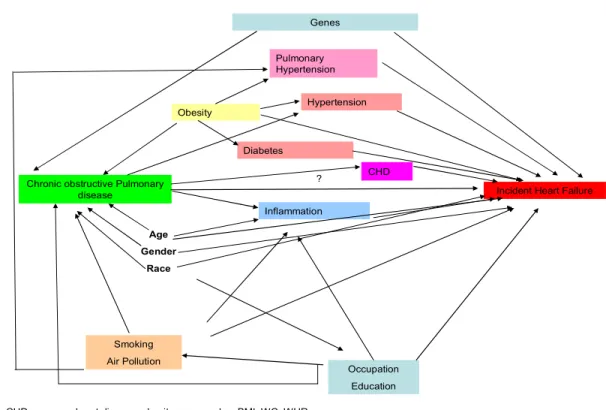
representation of several pathways leading to Heart Failure is shown in figure 2.
Chronic obstructive Pulmonary
disease Incident Heart Failure
Smoking Air Pollution
Age Gender
Race
CHD=coronary heart disease; obesity measured as BMI; WC; WHR. Obesity
Occupation Education Pulmonary
Hypertension Genes
? Inflammation
CHD Diabetes
Hypertension
D. Studies of COPD /Lung function) as a Risk Factor for Heart
Failure
In a longitudinal study published in 1974, Kannel et al. examined the
relationship between forced vital capacity and incident heart failure in the
Framingham Heart Study. The authors reported that both a persistently low and a recent fall in vital capacity were associated with increased risk of HF. However,
they did not find an association between obstructive disease (FEV1/FVC) and incident HF. In a case control study published in 2005, Sidney et al. have
reported an association between COPD associated with incident HF, RR = 3.75 (95% CI: 3.39, 4.15) using a large administrative dataset (Kaiser Permanente Medical Care Program).
E. Validation of ICD code ‘428.x’ for the diagnosis of HF
In her thesis, available electronically (UMI: 3322231), Dr. Laura R. Loehrsummarizes five studies examining the validity of ICD codes for defining heart failure(Loehr 2008). There was considerable variability in the estimates from
these studies, and the lack of a uniform gold standard is a contributor to this. The ARIC study heart failure surveillance results provide a better framework to
understand this issue since HF status is ascertained using several standardized
classification criteria and a meticulous review by a panel of physicians. In a sample of hospitalizations with suspected CHD, the PPV of HF diagnosis was
83.5% while sensitivity was 62.8%, when using a physician diagnosis or pulmonary edema on X-ray as gold standard [136. A hospital discharge
diagnosis of ICD 9-DM- 428.x was reported to have a positive predictive value of
In the ARIC HF surveillance study based on a sample of hospitalizations with high suspicion of HF, the PPV of an ICD code ‘428.x’ for HF classified according to ARIC study procedures was 77%, and its sensitivity was 95%
(Rosamond, Chang et al. 2009). In the same study the corresponding PPV and sensitivity of an ICD code ‘428.x’ for HF defined by the Framingham Heart
Failure criteria was 0.78, and 0.83, respectively.
F. Risk score functions and their utility
2.F.1 Early diagnosis improves outcomes. While there has been progress in the therapy of HF leading to better survival during the last decades, many
researchers agree that future efforts need to be directed towards early detection of ventricular dysfunction and prevention of symptomatic heart failure(Fonseca
2006). Highlighting the importance of early diagnosis and treatment in individuals with LV systolic dysfunction, the Study of Left Ventricular Dysfunction (SOLVD) trial showed that patients randomized to enalapril (an ACE inhibitor) had lower
late mortality and lower serious CV morbidity as compared to placebo who also received enalapril at the trial close out (Ahn, Jong et al. 2006). This becomes
particularly important in light of the high proportion of sudden cardiac death among individuals with mild HF (Uretsky and Sheahan 1997). Thus, an early and accurate HF diagnosis can be viewed as the cornerstone of improved patient
2.F.2 Early diagnosis/referral in primary care setting improves outcomes. Most patients with HF present for the first time to general practitioners (GPs) and are mostly managed by them (Fowler 1997). Results of a qualitative study involving
focus groups of 30 GPs in four primary care settings in the UK showed that lack of confidence in establishing diagnosis, rapidly changing knowledge and doubts
about the applicability of research to primary care settings were identified as main barriers to providing standard care to patients with HF in the community (Fuat, Hungin et al. 2003). Whereas accurate diagnosis is crucial for effective
management, many practitioners at the primary care level rely on clinical elements to diagnose heart failure without further investigation, thus deviating
from the available guidelines (Fonseca 2006). Furthermore, the importance of early diagnosis and treatment of left ventricular systolic dysfunction was not fully appreciated among general practitioners (Mair and Bundred 1996). A review of
HF patients’ charts in Netherlands reported that although general practitioners had more elderly and female patients, they asked for fewer tests and also
prescribed potentially beneficial medications less often compared to cardiologists (Rutten, Grobbee et al. 2003). Similarly, a large multinational European survey of patients with HF reported that while 92% of the treating physicians asked for
an electrocardiogram (ECG), only 45% asked for an echocardiogram (Cleland, Cohen-Solal et al. 2002). Thus, primary care practitioners, though providing most
2.F.3 Risk score functions as an aid to stratification and referral. Clinical prediction models combine patient characteristics to predict the probability that a particular disease state will occur. Risk scores based on an optimal set of
predictors demonstrably predict the probability of incident cardiovascular events in various populations (D'Agostino, Grundy et al. 2001). Their use for the risk
management of CHD has been strongly encouraged in the NCEP- ATP III guidelines (2001), and made available by NHLBI for use in clinical practice . Risk score functions may be particularly useful in the identification of groups at
intermediate risk and they are now recognized as essential in efficiently identifying likely candidates for CHD (Kannel, D'Agostino et al. 2004).
Unlike most manifestations of CHD, ventricular dysfunction remains masked and undetected in majority of its carriers, though early identification and
proactive management could improve health outcomes. Further, comorbidities – particularly those affecting the lungs (Kannel, Seidman et al. 1974) or kidneys
(Kottgen, Russell et al. 2007) – may contribute to or precipitate cardiac decompensation in the absence of manifest CHD. Particularly in this context, various biomarkers may be of value as elements of risk score functions.
2.F.4 Strengths and limitations of the existing risk functions. The HF risk score
HF. Their main features are summarized in Table 3. The FHS is restricted to white examinees and provides a full score that includes elements with limited availability to primary care practitioners such as forced vital capacity and X-Ray.
Table 3. Comparison of study design and elements for the existing and proposed HF risk score
FHS complete Health ABC score ARIC Study
Study
characteristics
Sampling Community based
selected: relatively
healthy community based Age at baseline
(range) 45-94y 70-79y 52-75y
Sample size
5209(?, not
mentioned) 2935 10781
Follow up HF events 486 258 1000+
Risk predicted for
years 4 5 4, 5 and 10
% Black 0 40 23
Outcome ascertainment using Framingham criteria Adjudicated ICD codes Adjudicated ICD codes Methods used Pooled logistic
regression Cox regression
Cox reg. and newer methods
Subset analysis None
Group with CHD,
HTN, VHD Race, and gender Internal validation None Bootstrapping Bootstrapping External validation
tested for FHS abbreviated
FHS and Health ABC study External validation
study
Health ABC
cohort None ---
Data elements used
Age X X X
Left ventricular
hypertrophy X X X
Vital capacity X X
Heart rate X X X
Systolic blood
pressure X X X
Coronary heart
disease X X X
Valvular disease
(auscultation) X X
Diabetes X
Fasting blood
glucose X
Cardiomegaly
(X-Ray) X
Albumin X X
Creatinine X X
Cystatin C X
Prolonged
QRS interval X
C reactive protein X
Although the Health ABC study has validated the former score in a population of older adults, an external validation of the Framingham HF risk
score in a similar population is pending since external validation in an independent test data set is an accepted requisite before the use of such models
can be recommended (Ripley 1996). The Health ABC cohort includes older black and white participants, but no information on calibration or discrimination of the score for blacks was provided. The Health ABC study tested some variables not
included by FHS, i.e. smoking, serum albumin and creatinine. Both studies included left ventricular hypertrophy, which is uncommon in middle aged
participants and not easily accessible to primary care physicians. It is also relevant to note that conditions of high prevalence such as other ECG abnormalities, respiratory illness, and obesity deserve to be tested for their
potential ability to modify the basic risk function estimated from these data. Hence, an external validation of both the risk scores and an assessment of the
relative importance of the variables used in their calculation represent timely and informative contributions. For reasons mentioned above, an HF risk score that performs well in the primary care setting would have wide applicability and
potential impact. It’s noteworthy that each of the above studies had a limited number of events, thus restricting the statistical power available to test the
being investigated for prediction with censored data (Chambless and Diao 2006), and reclassification is relied on at present to assess the performance of risk functions more so than on traditional approaches based on an increase in the
area under the ROC curve (Pencina, D' Agostino RB et al. 2008; Pepe, Feng et al. 2008). As evidenced by risk predictions for incident CHD, prognostic
statements for 5 to 10 years are of value in the prevention and management of chronic disease. Of note, the Framingham and Health ABC studies did not provide information on long term risk prediction beyond 4-5 years. Lastly, the
additional use of novel biomarkers in these equations or their calibrated versions will be a timely and potentially important innovation by this study.
G. Methods to Adjust for Bias
The primary concerns with bias in this project apply to misclassification of hospitalized HF and their potential contamination with COPD exacerbations given the many overlapping signs and symptoms(Hawkins, Petrie et al. 2009),
and optimism in the estimation of primary discrimination statistics of the HF risk functions estimated in the ARIC cohort since the derivation and testing samples
are the same.
The first concern regarding outcome misclassification in an
exposure-outcome study was partly resolved by sensitivity analysis. To evaluate whether our findings may be a result of misclassification of incident HF, sensitivity
reported COPD; b) replicate analyses excluding participants with prevalent CHD; c) excluding both baseline COPD and prevalent CHD; and d) , analyses that excluded those with acute exacerbation of COPD during HF hospitalization (n=
78), those with acute exacerbation of COPD or respiratory failure (n=229) during a hospitalization coded as HF, and e) censoring those with acute exacerbation of
COPD or respiratory failure (n=229) during HF hospitalization. The second concern, namely optimism in the estimation of the AUC was addressed by subtracting an estimate of optimism derived by using 1000 bootstrap samples
from the AUC estimate.
H. Summary and public health significance
Heart Failure is a common condition in economically developed countries
and at the root of a large and growing burden of disability, early death, and health care expenditures. Despite large allocations of resources to its medical care, its prognosis remains grim. Identification of novel risk factors and pathways for HF
may prevent or delay decompensated, hospitalized HF and also motivate the development of new therapeutic targets. While the rate of mortality attributable to
heart disease is declining, COPD remains a primary public health concern as well as the only condition with an increasing of mortality in the U.S. This study tests association between reduced lung function and incident HF after
adjustment for potential confounders in a large community based cohort. It also explores whether markers of inflammation may be partially explain or be
HF is mostly managed in primary care settings. It is a clinical syndrome, diagnosed with the aid of a combination of signs, symptoms and laboratory and
imaging studies. Owing to the low specificity of individual signs and symptoms it is challenging to diagnose HF early and accurately in community settings.
Importantly, early diagnosis and management are beneficial in delaying the occurrence of decompensated HF and of poor outcomes in patients with HF. An accurate risk prediction function may provide important information about an
individual’s risk of future events. This is particularly important for HF patients as mild, asymptomatic left ventricular dysfunction (systolic as well as diastolic) is
common in the community, and a large proportion of individuals with HF suffer sudden cardiac death, even with mildly symptomatic HF. This study evaluates the external validity of the two existing HF risk scores in a large bi-racial cohort of
middle-aged men and women in four US communities. Further, this study examines the potential value of few biomarkers in enhancing HF risk prediction
Chapter III
METHODS
A.
Study population
The source population that comprises the ARIC study was a community
based sample of males and females, ages 45-64 at enrollment, from 4 US communities. The race/ethnic composition reflects that of two communities (seven suburbs of Minneapolis, MN and Washington County, MD) whereas
African Americans were over sampled in Forsyth County, NC and Jackson MS participants were restricted to age-eligible African Americans. The over-sampling of African American participants (approximately 27% of the participants at
baseline exam) was a deliberate effort to investigate minority health related issues. At baseline, approximately 50% of the participants were female. As the
ARIC study was designed to assess sub-clinical cardiovascular disease in a middle aged –population, it was not felt that inclusion of persons under age 45 would contribute to study objectives, thus enrollment was restricted to persons 45
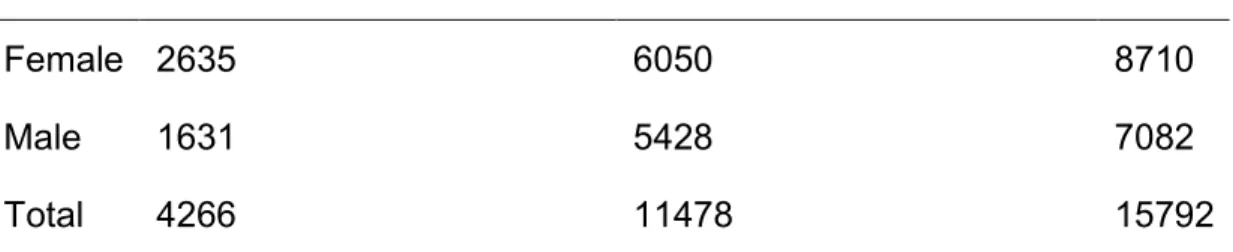
Table 4. ARIC study population by race at study enrollment
Black, not of Hispanic origin White, not of Hispanic origin Total
Female 2635 6050 8710
Male 1631 5428 7082
Total 4266 11478 15792
B. Protection of Human Subjects
This project used extant ARIC data, and measures covered by the informed consent provided by each study participant. Neither the measures used in these analyses nor the resulting estimates of HF risk are reportable to the
cohort members or their providers of medical care. The ARIC study adheres to a well established and standardized data collection protocol, which is reviewed and
annually approved by institutional review boards at each participating institution. IRB approval to support this proposed analysis was obtained in September 2008. The ARIC study investigators have approved the release a de-identified data file
containing requested variables to the investigator. The investigator has signed a data use agreement indicating that the clinical data, biological materials, modified
or unmodified derivatives thereof, will not be used contrary to specifications stated in the study subjects’ informed consent. Further, both the studies of this project were approved by the Institutional Review Board of the University of
C. Ascertainment of heart failure events
The ARIC Study enrolled 15,792 subjects aged 45-64 years in four U.S.
communities: Forsyth County, NC; Jackson, MS; seven northwestern suburbs of Minneapolis, MN; and Washington County, MD. Enrollment at the Jackson, MS site was restricted to black residents, while black residents were over-sampled in
Forsyth County. Baseline examinations of the cohort were conducted from 1987 to 1989 to collect information about socioeconomic indicators, medical history,
family history, cardiovascular risk factors, serum chemistries, ECGs, medication use, and lung volumes. The cohort participated in four examinations including baseline visit, annual telephone interviews and active surveillance of their
hospitalizations and death.
D. Incident heart failure event criteria
Incident HF was defined as the first HF hospitalization with an HF
discharge code or HF as the underlying cause of death on a death certificate (n=84). Hospital discharge diagnoses were coded using the International
E. Measurement of primary exposures:
Lung functions
At the baseline visit, pulmonary function was assessed using a water-sealed Collin Survey II volume displacement spirometer. Spirometry was conducted using American Thoracic Society guidelines(1987). From at least
three acceptable readings, of which at least two were reproducible (volumes within ± 5%), a best reading was selected by computer and confirmed by
technician. Methodology was standardized across four field centers including training and certification of pulmonary technicians.
COPD
History of respiratory illness was obtained from standardized
questionnaire(Ferris 1978) by trained personnel.
F. Baseline covariate definitions
At baseline, prevalent coronary heart disease (CHD) was ascertained by self-report and a 12-lead ECG. Hypertension was defined by diastolic pressure≥
90 mm Hg or systolic pressure≥140 mm Hg on the average of the last 2 of 3 measurements, or the use of anti-hypertensive medications. Diabetes was defined by the presence of serum glucose level >= 200 mg/dl, an 8-hour fasting
glucose level >=126 mg/dl, a self-reported history of physician-diagnosed diabetes, or the current use of hypo/antihyper-glycemic medications. Other
medicines brought by participants during exam. Cigarette smoking status was defined as currently smoking or a history of ever smoking four hundred cigarettes or more. The average number of cigarettes/day and number of years of smoking
reported were multiplied to derive cigarette-years of smoking. Body mass index was defined as the ratio of measured weight (kilograms) and measured height2
(in meters2). Participants identified themselves as belonging to American/Alaskan Indian, Asian, black, or white race.
G. Statistical power analysis
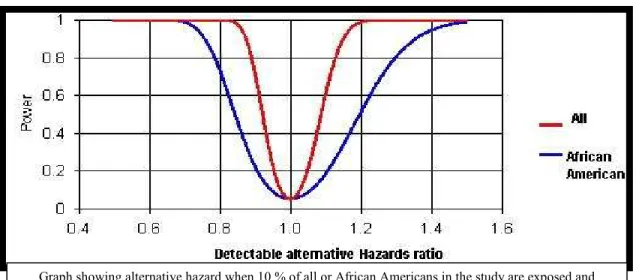
G1. Cox Regression Power analysis was done using a total sample at risk visit 4 = 10781, follow up period = 5 years and 10 years, alpha = 0.05 (two-sided), exposure proportion at baseline = 10% and 40% and median time to event among unexposed = 4.5 and 9 years (conservative).
There is 80% power to detect a hazard of 1.13 when using 5 years follow up and 10% prevalence (conservative for some risk factors like hypertension). Similar, analysis was done by restricting the sample size at baseline to that of
African American (n=2425), other parameters being same. For 5 years follow up and a variable with 10% prevalence there is 80% power to detect an alternative
Figure 3. Minimum hazard ratio detectable with study size under range of power.
Hence, there seems to be enough power to identify important predictors using Cox regression. The above power analysis was done using PS software
(Schoenfeld and Richter 1982).
G2. Minimum detectable differences in area under curve on a two sided null
hypothesis at alpha = 0.05 and beta = 0.2 and 0.1 is shown in table 5. The two study samples shown are for the overall cohort and for African American
sub-sample. The estimates make the assumption of a correlation of 0.6 for both false positive and false negative on two risk functions, which is conservative as we expect high correlation. Further, we wish to test one sided hypothesis of whether
inclusion of variable improves the AUC, hence these estimates are even more conservative. Also, the two issues of partial AUC, and risk-cut off for decision
making dictate power. Novel methods of reclassification outlined above will provide more power. We will use cut-offs similar to those for coronary artery disease.
Statistical Analysis
SAS, version-9.1 and STATA-IC, version-10 software were used for analysis. A p<0.05 for a two-sided test was considered statistically significant.
Means (standard deviations) and proportions of characteristics at baseline and follow up HF event rates were calculated for quartiles of FEV1. A higher
proportion of blacks and women were in the lower quartiles of FEV1 and FVC;
thus all analysis (except for table 7) used race and gender specific quartiles of FEV1.
General consideration of time to event analysis:
A participant susceptible to event of interest is said to be at-risk for the event. In this study, those with prevalent HF were not susceptible to an incident
Table 5. Area under receptor operating curve: minimum difference in AUC detectable at two values of power
HF No HF AUC under null Min Diff at
power = 0.8
1000 9781 0.5 0.023
1000 9781 0.6 0.024
1000 9781 0.7 0.024
1000 9781 0.8 0.025
270 2165 0.5 0.042
270 2165 0.6 0.043
270 2165 0.7 0.044
not susceptible for the event such as person-time before origin, after a non-repeating event of interest such as incident heart failure, and after a competing event such as death and still contributes to person time is said to be contributing
to immortal time. The origin in this study was enrollment in the study and then participants were followed every year with an annual follow up interview and
surveillance of community hospitals. If a participant enters study prior to becoming risk, then the time from study entry to onset of risk is not time at-risk, but is called immortal person-time. Hence, there is no evident immortal
person time in the study. Most of the individuals censored in the study were due to administrative censoring or due to death. We can assume with some
confidence that most of censoring (due to administrative censoring) is non-informative censoring, or independent censoring.
Poisson regression
A Poisson regression model allows us to quantify the incidence density (#
of events/person time at risk) as a function of many exposures and covariates.
The Poisson regression model can be represented as
(
)
k exp X
λ = α + β + γZ
or logλ = α + βk X+ γZ
where index k = 1, 2, …, K levels of the joint exposure X and covariate vector Z..
The intercept coefficient α (with log y accounted for) is the incidence density for
the group defined by a value of zero on the exposure and covariate vector. The
respective components of covariate vector Z, holding exposure (and other components of Z) constant at any level. Incidence density (rate) of HF in various strata was estimated assuming a Poisson distribution.
Hazards and Cox regression model
Hazard is defined as instantaneous risk at a given time. It can be
represented as probability of event in a small interval. Usually it is estimated at
each event.
( )
(
)
t 0
h t lim Pr t T t t | W t T t ∆ →
= < ≤ + ∆ < ≤ ∆ .
The Cox proportional hazards model can be represented as
( )
0( )
(
)
h t =h t ×exp βX+ γZ ,
where h0(t) is the reference hazard function for those with X = Z = 0 and is
sometimes called the baseline hazard function. Cox proportional hazards model
is semi-parametric and doesn’t has an intercept coefficient. In this model β
coefficient is the log of hazard ratio per unit change in exposure X while holding
other variables constant at any level and γ is the vectors of log hazard ratios for
unit changes in the components of Z holding the exposure and other components of Z constant at any level. The baseline function can take any shape the shape of
the hazard function over time). Another assumption is that the hazard ratio remains constant during the study follow up i.e. hazards are proportional.
The variables included in the above two studies are shown in Table 7. We will examine the incidence density of HF over the course of follow up assuming both a Poisson or a negative binomial distribution of events for each race and
sex groups.
Cox regression models were used to assess the relationship between race and gender specific quartiles of FEV1 (and FVC), and airflow obstruction with incident HF for each race and gender group.
All Cox models were adjusted for age, height, and squared height
(height2) since use of percent predicted lung function(s) can violate the assumptions of homogeneity of variance required to interpret the estimates correctly and has been discouraged, in favor of adjustment using height and
height2 (22). The potentially strong confounding due to cigarette smoking was addressed by stratified analysis by smoking for each race and gender group.
Further, models were adjusted for prevalent CHD and its traditional risk factors. As chronic inflammation may be an intermediary for this association, a change in the magnitude of the estimates after additional adjustment for pro-inflammatory,
pro-coagulability markers and obesity was evaluated. Lastly, adjustment for maximum inspiratory pressure was done to adjust for overall decreased muscle
Multivariable adjusted cumulative failure estimates were plotted by quartiles of FEV1, as the inverse of the survival function (1-S (t+0)) to yield the estimated cumulative proportion of those who developed heart failure at any time
point t.
Compliance with the proportional hazards assumption was examined for the main exposure using log – log curves and no obvious violation was seen for FEV1 or FVC quartiles.
Analysis for Paper II
Risk scores
A risk score Z=XBETA could be obtained for each individual in a sample by summing the products of regression beta coefficient from a Cox Proportional
Hazards model regression and individual’s value for that particular variable. The beta coefficient can be derived from either an external sample or derived from
the study sample itself.
i.e. Zi = Sum (Xai’ βa), Zi = risk score for ith individual, Xai is the value of
Xa risk factor for ith individual and β is regression coefficient for the Xa variable
from the multivariable model.
property is the proportion of HF cases in the highest decile of predicted risk, or the ratio of cases in the highest decile to lowest decile or lowest quintile of predicted risk. Other commonly used approaches are based on the change in
area under the curve (AUC) of a ROC curve, or its proxy the c-index for classification(Harrell, Lee et al. 1996) as an estimate of the probability that a
model assigns a higher risk to those who develop HF within the follow-up period compared to those who do not. Since closely related, the c-index has limitations similar to those of the ROC curves (Graf, Schmoor et al. 1999; Pencina, D'
Agostino RB et al. 2008). Among these statistics, AUC is more commonly used and understood statistics to examine and compare the discrimination of the
models.
By taking censoring into consideration, AUC in the context of long term
risk prediction can be defined as the probability that a person with disease onset by time T0 has a higher risk score than a person with no event by time
T0,P(Zi >Zj |Di(t)=1&Dj(t)=0) where D(t) is an indicator variable for event or no event by time t, and Z denotes risk score.3 It is important to restrict to only those events occurring at time ≤T0 as estimations below are based on a fitted
survival function. Chambless, Diao et al provided an estimator of AUC which was
a function of time, thus accounted for censoring. Current work based on Gang, Chambless et al further modifies extended AUC as probability of one person with
earlier disease onset by time T0 having higher score than another person with
AUC is the full area estimated giving equal weights to all false positive rates. This does not take into account the shape of the ROC curve and thus
neglects the clinical need of knowing the partial AUC under low false positive rates (such as 0-0.2)(McClish 1989). Other measures of separation like PSEP
(prognostic separation) i.e. predicted probability of HF for the group with worst risk score – predicted probability of HF for the group with best risk score(Altman and Royston 2000), and SEP (separation) i.e., weighted geometric mean of
absolute relative risk between a strata and baseline have been described (Sauerbrei, Hubner et al. 1997).
In this study we will focus on AUC and novel method as described below. Other recent developments consider the net reclassification improvement for
meaningful cut-offs and integrated discrimination improvement if no risk cut-off for decision making exists (Pencina, D' Agostino RB et al. 2008; Pepe, Feng et
al. 2008). These methods seem more meaningful for clinical decision making than c-statistics and also provide much greater power to test incremental values(Pencina, D' Agostino RB et al. 2008).
The NRI statistics cross tabulate number of individuals classified into
actual outcome, the full model may be reclassified him/her appropriately (upward movement of someone with event and downward of someone who didn’t had event) of inappropriately.
i.e., 0) D | P(Z 1) D | P(Z Improves
Model = up = + down =
1) D | P(Z 0) D | P(Z Worsens
Model = up = + down =
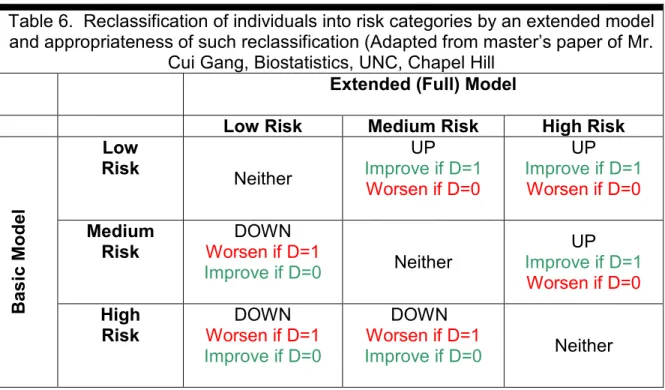
Table 6. Reclassification of individuals into risk categories by an extended model and appropriateness of such reclassification (Adapted from master’s paper of Mr.
Cui Gang, Biostatistics, UNC, Chapel Hill Extended (Full) Model
Low Risk Medium Risk High Risk
Low Risk
Neither
UP Improve if D=1
Worsen if D=0
UP Improve if D=1
Worsen if D=0
Medium Risk
DOWN Worsen if D=1
Improve if D=0 Neither
UP
Improve if D=1 Worsen if D=0
B a s ic M o d e l High Risk DOWN Worsen if D=1 Improve if D=0
DOWN Worsen if D=1
Improve if D=0 Neither
The NRI can thus be defined as the probability the full model improves the overall risk prediction minus the probability the full model worsens the overall risk
prediction.
[P(Z |D 1) P(Z |D 0)]-[P(Z |D 0) P(Z |D 1)]
Calibration To check for goodness of fit to the data comparisons will be made at two levels. First, for combinations of predictor variables we will use Hosmer and Lemeshow’s delta-chi square influence statistic (the decrease in the Pearson
goodness of fit statistic that results from deleting the set of observations that share a specific covariate pattern) and the Pregibon delta-beta statistic, which
results from the Pearson residual and the “hat matrix” (Hosmer and Lemeshow 1999). Second, the overall function’s predicted risks will be used to divide the observations into deciles of predicted, compared to observed risk. Plots will be
constructed showing predicted and actual event rates for each decile (Arjas plots) (Gronnesby and Borgan 1996).
The Gronnesby and Borgan statistic (GB-stat) as proposed by Gronnesby and Borgan (1996) is a goodness of fit test for the Cox proportional hazard
model. By computing the martingale residuals for each decile, the GB-stat tests the hypothesis that the expected value of the sum of these residuals is equal to
zero.
Correction for Optimism in estimate
It is expected that AUC statistics calculated using risk score with beta
will do 1000 bootstraps using the study sample size. Bootstrapping provides stable estimates with lower bias as compared to the other similar methods for validation including split-sample, cross-validation (Steyerberg, Harrell et al. 2001)
and permits using the entire dataset as well as allowing for estimation of the error rates or for the reduction of bias of effect estimates. The bias-corrected
coefficients will be used for comparisons of the estimates. The average optimism i.e., (measure bootstrap samples – measure original dataset) will be subtracted from the
original performance measure to provide a more realistic estimate.
J. Methodological strengths and limitations
4.6.1 Strengths The ability to use extant data from a large, population-based biracial closed cohort with an average of 10 years of follow up provides excellent
opportunity to address a novel study question with a clear translation potential. The availability in this cohort of modern biomarkers related to HF and of application in clinical practice and epidemiologic research represents a particular
strength. The disciplined plan of analyses and methodological rigor contributed by the newer analytic and validation tools built into this proposal provide a
better-than-usual assurance against particularistic associations or over-fitting due to sparse outcomes (Harrell, Lee et al. 1985). This study will provide a much useful external validation to Health ABC study using similar criteria to ascertain
outcome. For the incremental value of biomarkers, while the study results would be internally valid and corrected for optimism replication in other settings and