Genome-wide associations for birth weight and correlations with
adult disease
A full list of authors and affiliations appears at the end of the article. # These authors contributed equally to this work.
Abstract
Birth weight (BW) is influenced by both foetal and maternal factors and in observational studies is reproducibly associated with future risk of adult metabolic diseases including type 2 diabetes (T2D) and cardiovascular disease1. These lifecourse associations have often been attributed to the impact of an adverse early life environment. We performed a multi-ancestry genome-wide association study (GWAS) meta-analysis of BW in 153,781 individuals, identifying 60 loci where foetal genotype was associated with BW (P <5x10⁻⁸). Overall, ˜15% of variance in BW could be captured by assays of foetal genetic variation. Using genetic association alone, we found strong inverse genetic correlations between BW and systolic blood pressure (rg=-0.22, P =5.5x10⁻¹³),
T2D (rg=-0.27, P =1.1x10⁻⁶) and coronary artery disease (rg=-0.30, P =6.5x10⁻⁹) and, in large
cohort data sets, demonstrated that genetic factors were the major contributor to the negative covariance between BW and future cardiometabolic risk. Pathway analyses indicated that the protein products of genes within BW-associated regions were enriched for diverse processes including insulin signalling, glucose homeostasis, glycogen biosynthesis and chromatin
remodelling. There was also enrichment of associations with BW in known imprinted regions (P
Correspondence and requests for materials should be addressed to [email protected] and [email protected]. §These authors jointly directed this work.
ǂDeceased.
Author Contributions
Core analyses and writing: M.H., R.N.B., F.R.D., N.M.W., M.N.K., J.F-T., N.R.v.Z., K.J.G., A.P.M., K.K.O., J.F.F., N.J.T., J.R.P., D.M.E., M.I.M., R.M.F. Statistical analysis in individual studies (lead analysts in italics): M.H., R.N.B., F.R.D., N.M.W., M.N.K., B.F., N.G., J.P.B., D.P.S., R.L-G., T.S.A., E.K., R.R., L-P.L., D.L.C., Y.W., E.T., C.A.W., C.T.H., J-J.H., N.V-T., P.K.J., E.T.H.B., I.N., N.P., A.M., E.M.v.L., R.J., V. Lagou, M.N., J.M.M., S.E.J., P-R.L., K.S.R., M.A.T., J.T., A.R.W., H.Y., D.M.S., I.P., K.
Panoutsopoulou, X.W., L.C., F.G., K.E.S., M. Murcia, E.V.R.A., Z.K., S.B.-G., F.S., D.T., J.W., C.M-G., N.R.R., E.Z., G.V.D., Y-Y.T., H.N.K., A.P.M., J.F.F., N.J.T., J.R.P., D.M.E., R.M.F. GWAS look-up in unpublished datasets: K.T.Z., N.R., D.R.N., R.C.W.M., C.H.T.T., W.H.T., S.K.G., F.J.v.R. Sample collection and data generation in individual studies: F.R.D., M.N.K., B.F., N.G., J.P.B., D.P.S., R.L-G., R.R., L-P.L., J-J.H., I.N., E.M.v.L., M.B., P.M-V., A.J.B., L.P., P.K., M.A., S.M.W., F.G., C.E.v.B., G.W., E.V.R.A., C.E.F., C.T., C.M.T., M. Standl, Z.K., M.V.H., H.G.d.H., F.R.R., C.M-G., S.M.R., G.H., G.M., N.R.R., C.J.G., C.L., J.L., R.A.S., J.H.Z., F.D.M., W.L.L.Jr, A.T., M. Stumvoll, V. Lindi, T.A.L., C.M.v.D., A.K., T.I.S., H.N., K. Pahkala, O.T.R., E.Z., G.V.D., S-M.S., M. Melbye, H.C., J.F.W., M.V., J-C.H., T.H., L.J.B., J.P.N., C.E.P., L.S.A., J.B.B., K.L.M., J.G.E., E.E.W., M.K., J.S.V., T.L., P.V., K.B., H.B., D.O.M-K., F.R., A.G.U., C. Pisinger, O.P., N.J.W., H.H., V.W.J., S.F.G., A.A.V., D.A.L., G.D.S., K.K.O., J.F.F., N.J.T., J.R.P., M.I.M. Functional follow-up experiment: L.A.D., S.M.M., R.M.R., E.D., B.R.W. Individual study design and principal investigators: J.P.B., I.N., M.A., F.D.M., W.L.L.Jr, A.T., M. Stumvoll, V. Lindi, T.A.L., C.M.v.D., W.K., A.K., T.I.S., H.N., K. Pahkala, O.T.R., G.V.D., Y-Y.T., S-M.S., M. Melbye, H.C., J.F.W., M.V., E.J.d.G., D.I.B., H.N.K., J-C.H., T.H., A.T.H., L.J.B., J.P.N., C.E.P., J.H., L.S.A., J.B.B., K.L.M., J.G.E., E.E.W., M.K., J.S.V., T.L., P.V., K.B., H.B., D.O.M-K., A.H., F.R., A.G.U., C. Pisinger, O.P., C. Power, E.H., N.J.W., H.H., V.W.J., M-R.J., S.F.G., A.A.V., T.M.F., A.P.M., K.K.O., N.J.T., J.R.P., M.I.M., R.M.F.
Author Information Author Manuscript
Nature. Author manuscript; available in PMC 2017 April 13.
Published in final edited form as:
Nature. 2016 October 13; 538(7624): 248–252. doi:10.1038/nature19806.
Europe PMC Funders Author Manuscripts
=1.9x10⁻⁴). We have demonstrated that lifecourse associations between early growth phenotypes and adult cardiometabolic disease are in part the result of shared genetic effects and have highlighted some of the pathways through which these causal genetic effects are mediated.
We combined GWAS data for BW in 153,781 individuals representing multiple ancestries from 37 studies across three components (Extended Data Fig. 1 and Supplementary Table 1): (i) 75,891 individuals of European ancestry from 30 studies; (ii) 67,786 individuals of European ancestry from the UK Biobank; and (iii) 10,104 individuals of diverse ancestries (African American, Chinese, Filipino, Surinamese, Turkish and Moroccan) from six studies. Within each study, BW was z-score transformed separately in males and females after excluding non-singletons and premature births and adjusting for gestational age where available. Genotypes were imputed using reference panels from the 1000 Genomes (1000G)2 or combined 1000G and UK10K Project3 (Supplementary Table 2). We
performed quality control assessments to confirm that the distribution of BW was consistent across studies, irrespective of the data collection protocol, and confirmed that self-reported BW in UK Biobank showed genetic and phenotypic associations consistent with those seen for measured BW in other studies4 (Methods).
We identified 60 loci (59 autosomal) associated with BW at genome-wide significance (P<5x10⁻⁸) in either the European ancestry or trans-ancestry meta-analyses (Extended Data Fig. 2a, Extended Data Table 1a and Supplementary Data; Methods). At lead SNPs, we observed no heterogeneity in allelic effects between the three study components (Cochran’s Q statistic P>0.00083) (Supplementary Table 3). Fifty-three of these loci were novel in that the lead SNP mapped >2Mb away from, and was statistically independent (EUR r2<0.05) of, the seven previously-reported BW signals5, all of which were confirmed in this larger analysis (Supplementary Table 4). Approximate conditional analysis in the European ancestry data indicated that three of these novel loci (near ZBTB7B, HMGA1 and PTCH1) harboured multiple distinct association signals attaining genome-wide significance (Methods; Supplementary Table 5 and Extended Data Fig. 3).
The lead variants for most signals mapped to non-coding sequence, and at only two loci, ADRB1 (rs7076938; r2=0.99 with ADRB1 G389R) and NRIP1 (rs2229742, R448G) did the association data point to likely causal non-synonymous coding variants (Supplementary Table 6; Methods). Lead SNPs for all but two loci (those mapping near YKT6-GCK and SUZ12P1-CRLF3) were common (minor allele frequency (MAF) ≥5%) with individually modest effects on BW (β=0.020-0.053 standard deviations (SD) per allele, equivalent to 10-26g). This was despite much improved coverage of low-frequency variants in this study (compared to previous HapMap 2 imputed meta-analyses5) reflecting imputation from larger, and more complete, reference panels (Extended Data Table 1b). Indeed, all but five of the common variant association signals were tagged by variants (EUR r2>0.6) in the
HapMap 2 reference panel (Supplementary Tables 4, 5), indicating that most of the novel discovery in the present study was driven by increased sample size5. Fine-mapping analysis yielded 14 regions within which fewer than ten variants contributed to the locus-specific credible set that accounted for >99% of the posterior probability of association (Methods; Supplementary Table 7). The greatest refinement was at YKT6-GCK, where the credible set
Europe PMC Funders Author Manuscripts
included only the low frequency variant rs138715366, which maps intronic to YKT6. These credible set variants collectively showed enrichment for overlap with DNaseI
hypersensitivity sites, particularly those generated, by ENCODE, from foetal (4.2-fold, 95% CI [1.8-10.7]) and neonatal tissues (4.9 [1.8-11.0]) (Supplementary Fig. 1 and
Supplementary Table 8; Methods).
In combination, the 62 distinct genome-wide significant signals at the 59 autosomal loci explained 2.0% (standard error (SE) 1.1%) of variance in BW (Supplementary Table 9; Methods), similar in magnitude to that attributable to sex or maternal body mass index (BMI)5. However, the variance in BW captured collectively by all autosomal genotyped variants on the array was considerably larger, estimated at 15.1% (SE=0.9) in UK Biobank (Methods). These figures are consistent with a long tail of genetic variants of smaller effects contributing to variation in BW.
Associations between foetal genotype and BW could result from indirect effects of the maternal genotype influencing BW via the intrauterine environment given the correlation (r
≈ 0.5) between maternal and foetal genotype. However, two lines of evidence indicated that variation in the foetal genome was the predominant driver of the BW associations. First, an analysis of the global contribution of maternal vs. foetal genetic variation, using a maternal-GCTA model6 (Methods) applied to 4,382 mother-child pairs, estimated that the child’s genotype (σC2=0.24, SE=0.11) makes a larger contribution to BW variance than either the mother’s genotype (σM2=0.04, SE=0.10), or the covariance between the two (σCM=0.04, SE=0.08). Second, when we compared the point estimates of the BW effect size dependent on maternal genotype at each of the 60 loci (as measured in up to 68,254 women7) with those dependent on foetal genotype (using European ancestry data from 143,677 individuals in the present study), foetal variation had greater impact than maternal at 93% of loci (55/60; binomial P=1x10-11) (Supplementary Table 10, Extended Data Figs 4, 5; Methods). Power to further disentangle maternal and foetal contributions using analyses of foetal genotype conditional on maternal genotype was constrained by the limited sample size available (n=12,909 mother-child pairs) (Supplementary Table 11).
Collectively, these analyses provide compelling evidence that foetal genotype has a substantial impact on early growth, as measured by BW. We sought to use these genetic associations to understand the causal relationships underlying observed associations between BW and disease, and to characterise the processes responsible.
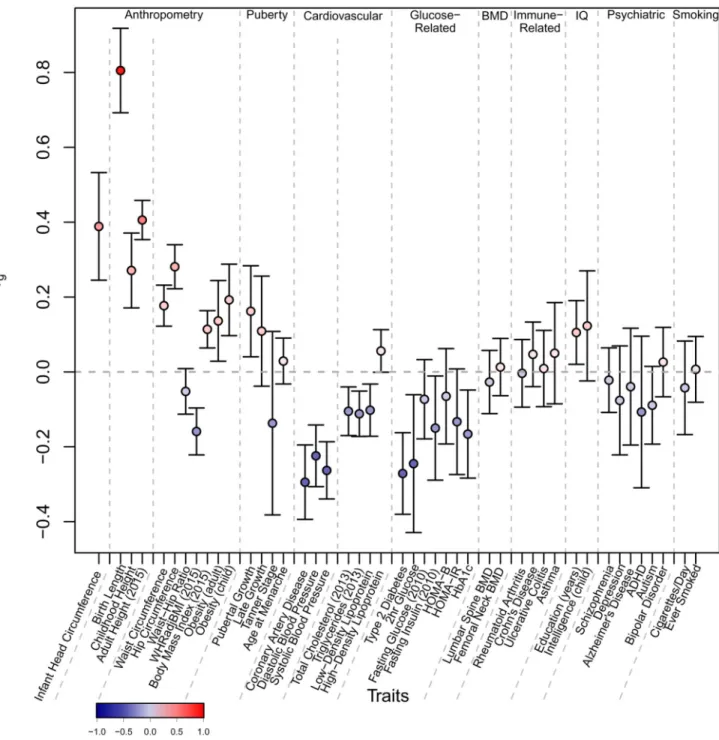
To quantify the shared genetic contribution to BW and other health-related traits, we estimated their genetic correlations using LD Score regression8 (Methods). BW (in
European ancestry samples) showed strong positive genetic correlations with anthropometric and obesity-related traits including birth length (rg=0.81, P=2.0x10-44), and in adults, height
(rg=0.41, P=4.8x10-52), waist circumference (rg=0.18, P=3.9x10⁻¹⁰) and BMI (rg=0.11,
P=7.3x10⁻⁶). In contrast, BW showed inverse genetic correlations with indicators of adverse metabolic and cardiovascular health including coronary artery disease (CAD, rg=-0.30,
P=6.5x10⁻⁹), systolic blood pressure (SBP, rg=-0.22, P=5.5x10⁻¹³) and T2D (rg=-0.27,
P=1.1x10⁻⁶) (Fig. 1, Supplementary Table 12 and Supplementary Fig. 2). These correlations between BW and adult cardiometabolic phenotypes are of similar magnitude, although
Europe PMC Funders Author Manuscripts
directionally-opposite, to the reported genetic correlations between adult BMI and those same cardiometabolic outcomes8. These findings support observational associations between a history of paternal T2D and lower BW4, and establish more generally that the observed lifecourse associations between early growth and adult disease, at least in part, reflect the impact of shared genetic variants that influence both sets of phenotypes. In an effort to estimate the extent of genetic contribution to these lifecourse associations, we first focused on data from UK Biobank (n=57,715). For many of the traits for which data were available, genetic variation contributed substantially to the lifecourse relationship between BW and adult phenotypes, and in some cases appeared to be the major source of covariance between the traits. For example, we estimated that 85% (95% CI=70%-99%) of the negative covariance between BW and SBP was explained by shared genetic associations captured by directly genotyped SNPs (Supplementary Table 13; Methods). For continuous
cardiometabolic measures, including lipids and fasting glycaemia, for which measures are not currently available in UK Biobank, we turned to the Northern Finland Birth Cohort (n=5,009), and obtained similar results (Supplementary Table 13). However, these estimates are limited, not only by wide confidence intervals, but also by the assumption of a linear relationship between BW and each of the phenotypes and by the inability to explicitly model maternal genotypic effects. In other words, the inverse genetic correlations between BW and cardiometabolic traits may not exclusively reflect genetic effects mediated directly through the offspring, but also effects mediated by maternal genotype acting indirectly via
perturbation of the in utero environment. Nevertheless, these estimates indicate that a substantial proportion of the variance in cardiometabolic risk that covaries with BW can be attributed to the effects of common genetic variation.
To elucidate the biological pathways and processes underlying regulation of foetal growth, we first performed gene set enrichment analysis of our BW GWAS analysis using
MAGENTA9 (Methods). Twelve pathways reached study-wide significance (FDR<0.05), including pathways involved in metabolism (insulin signalling, glycogen biosynthesis, cholesterol biosynthesis), growth (IGF-signalling, growth hormone pathway) and development (chromatin remodelling) (Extended Data Table 2a). Similar pathways were detected in a complementary analysis where we interrogated empirical protein-protein interaction (PPI) data identifying 13 PPI network modules with marked (z-score >5) enrichment for BW-association scores (Extended Data Table 2b and Extended Data Figs 6a, b; Methods). The proteins within these modules were themselves enriched for diverse processes related to metabolism, growth and development (Extended Data Figs 6a, b).
We also observed enrichment of BW association signals across the set of 77 imprinted genes defined by the Genotype-Tissue Expression (GTEx) project10 (P=1.9x10⁻⁴; Extended Data Table 2a and Supplementary Table 14). Such enrichment is consistent with the “parental conflict” hypothesis regarding the allocation of maternal resources to the foetus11. Although the role of imprinted genes in foetal growth is described in animal models and rare human disorders12, our result is the first large-scale, systematic demonstration of their contribution to normal variation in BW. Of the 60 genome-wide significant loci, two (INS-IGF2, RB1) fall within (or near) imprinted regions (Extended Data Fig. 2b), with a noteworthy third signal at DLK1 (previously foetal antigen-1; P=5.6x10⁻⁸). Parent-of-origin specific analyses to further investigate these individual loci (comparing heterozygote vs. homozygote BW
Europe PMC Funders Author Manuscripts
variance in 57,715 unrelated individuals, and testing BW associations with paternal vs. maternal alleles in 4,908 mother-child pairs; see Methods) proved, despite these sample sizes, to be underpowered (Extended Data Fig. 7 and Supplementary Tables 15, 16).
Many of the genome-wide signals for BW detected here are also established genome-wide association signals for a wide variety of cardiometabolic traits (Fig. 2). These include the BW signals near CDKAL1, ADCY5, HHEX/IDE and ANK1 (also genome-wide significant for T2D), NT5C2 (for blood pressure (BP), CAD and BMI) and ADRB1 (for BP). We used two approaches to understand whether this pattern of adult trait association represented a generic property of BW-associated loci, or reflected heterogeneous mechanisms linking BW to adult disease.
First, we applied unsupervised hierarchical clustering (Methods) to the non-BW trait association statistics for the 60 significant BW loci.The resultant heatmap indicates the heterogeneity of locus-specific effect sizes across the range of adult traits (Fig. 2 and Supplementary Table 17). For example, it shows that the associations between BW-raising alleles and increased adult height are concentrated amongst a subset of loci including HHIP and GNA12, and highlights particularly strong associations with lipid traits for variants at the TRIB1 and MAFB loci.
Second, we constructed trait-specific “point-of-contact” (PoC) PPI networks from proteins represented in both the global BW PPI network and equivalent PPI networks generated for each of the adult traits (Methods; Extended Data Figs 6c-e). We reasoned that these PoC PPI networks would be enriched for the specific proteins mediating the observed links between BW and adult traits, generating hypotheses that are amenable to subsequent empirical validation. To highlight processes implicated in specific BW-trait associations, we overlaid these PoC PPI with the 50 pathways over-represented in the global BW PPI network. These analyses revealed, for example, that proteins in the Wnt canonical signalling pathway were only detected in the PoC PPI network for BP traits. We can use these PPI overlaps to highlight the specific transcripts within BW GWAS loci that are likely to mediate the mechanistic links. For example, the overlap between the Wnt signalling pathway and the PoC PPI network for the intersection of BW and BP-related traits implicates FZD9 as the likely effector gene at the MLXIPL BW locus (Extended Data Fig. 6d and Supplementary Table 6).
We focused our more detailed investigation of the mechanistic links between early growth and adult traits on two phenotypic areas: arterial BP and T2D/glycaemia. Across both the overall GWAS and specifically among the 60 significant BW loci, most BW-raising alleles were associated with reduced BP (Figs 1, 2): the strongest inverse associations were seen for the loci near NT5C2, FES, NRIP1, EBF1 and PTH1R. However, we also observed locus-specific heterogeneity in the genetic relationships between BP and BW: the SBP-raising allele at ADRB113 is associated with higher, rather than lower, BW (Extended Data Fig. 8a). When we considered the reciprocal relationship, i.e. the effects on BW of BP-raising alleles at 30 reported loci for SBP13,14, there was an excess of associations (5/30 with lower BW at P<0.05; P=0.0026; Extended Data Fig. 8a). To dissect maternal and foetal genotype effects at these loci, we tested the impact on BW of a risk score generated from the 30 SBP
Europe PMC Funders Author Manuscripts
SNPs, restricted to the untransmitted maternal haplotype score15 in a set of 5,201 mother-child pairs. Analysis of these loci indicated that maternal genotype effects on the intrauterine environment are likely to contribute to the inverse genetic correlation between SBP and BW (Methods; Supplementary Table 18), and was consistent with the results of a wider study of >30,000 women which demonstrated associations between a maternal genetic score for SBP (conditional on foetal genotype) and lower offspring BW16.
The BP-raising allele with the largest BW-lowering effect maps to the NT5C2 locus (index variant for BW, rs74233809, r2=0.98 with index variant for BP, rs1119154814) and is also associated with lower adult BMI (r2=0.99 with rs1119156017). The BW-lowering allele at rs74233809 is a proxy for a recently-described functional variant in the nearby CYP17A1 gene (r2=0.92 with rs138009835)18. The CYP17A1 gene encodes the cytochrome P450c17α enzyme, CYP1719, which catalyses key steps in steroidogenesis that determine the balance between mineralocorticoid, glucocorticoid and androgen synthesis. This variant is known to alter transcriptional efficiency in vitro and is associated with higher urinary tetrahydroaldosterone excretion18. CYP17A1 is expressed in foetal adrenal glands and testes from early gestation20 as well as in the placenta21. These data implicate variation in CYP17A1 expression as a contributor to the observational association between low BW and adult hypertension22.
When we examined 45 loci associated with CAD23, the inverse genetic correlation between CAD and BW was concentrated amongst the five CAD loci with primary BP associations. This suggests that genetic determinants of BP play a leading role in mediating the lifecourse associations between BW and CAD (Extended Data Figs 8b, e).
LD score regression analyses demonstrated overall inverse genetic correlation between lower BW and elevated risk of T2D (Fig. 1). However, the locus specific heatmap indicates a heterogeneous pattern across individual loci (Fig. 2). To explore this further, we tested the 84 reported T2D loci24 for association with BW. Some T2D risk alleles (such as at ADCY5, CDKAL1 and HHEX-IDE) were strongly associated with lower BW, whilst others (e.g. ANK1 and MTNR1B) were associated with higher BW (Extended Data Fig. 8c). This was in contrast with the BW effects of 422 known height loci25 (Extended Data Fig. 8d), which showed a strong positive correlation consistent with the overall genetic correlation between height and BW, indicating that the growth effects of many height loci start prenatally and persist into adulthood.
The contrasting associations of T2D risk-alleles with both higher and lower BW are likely to reflect the differential impacts across loci of variation in the maternal and foetal genomes. Observational data link paternal diabetes with lower offspring BW4 indicating that the inheritance of T2D risk alleles by the foetus tends, in line with the LD score regression analysis, to reduce growth. These relationships are consistent with the precepts of the “foetal insulin hypothesis”26 and reflect the potential for reduced insulin secretion and/or signalling to lead to both reduced foetal growth and, many decades later, enhanced predisposition to T2D. In line with this, the inferred paternal transmitted haplotype score generated from the 84 T2D risk variants was associated with lower BW (P=0.045) in 5,201 mother-child pairs (Methods; Supplementary Table 18). In contrast, maternal diabetes is observationally
Europe PMC Funders Author Manuscripts
associated with higher offspring BW4, reflecting the impact of maternal hyperglycaemia to stimulate foetal insulin secretion. The contribution of genotype-dependent maternal hyperglycaemia to BW is in line with the evidence, from a recent study, that maternal genotype scores for fasting glucose and T2D (conditional on foetal genotype) were causally associated with higher offspring BW16. It is also consistent with the observation that a subset of glucose-raising alleles is associated with higher BW7. For example, the T2D-risk variant at MTNR1B (which also has a particularly marked effect on fasting glucose levels in non-diabetic indivudals27,28) was amongst the subset of BW loci (5/60) for which the BW effect attributable to maternal genotype exceeded that associated with the foetal genotype (maternal: β=0.048, P=5.1x10⁻¹⁵; foetal: β=0.023, P=2.9x10⁻⁸) (Supplementary Table 10, Extended Data Figs 4, 5). Thus, both maternal and foetal genetic effects connect BW to later T2D risk, albeit acting in opposing directions. When we categorised T2D loci using a classification of physiological function derived from their effects on related glycaemic and anthropometric traits27, we found that T2D-risk alleles associated with lower BW were those typically characterised by reduced insulin processing and secretion without detectable changes in fasting glucose (the “Beta Cell” cluster in Extended Data Fig. 8f).
The YTK6 signal at rs138715366 is notable, not only because the genetic data indicates that a single low-frequency non-coding variant is driving the association signal (see above) but because of the proximity of this signal to GCK. Rare coding variants in glucokinase are causal for a form of monogenic hyperglycaemia and lead to large reductions in BW when parental alleles are passed to their offspring29. In addition, common non-coding variants nearby are implicated in T2D-risk and fasting hyperglycaemia28. However, the latter variants are conditionally independent of rs138715366 (Supplementary Table 19) and show no comparable association with lower BW. Either rs138715366 acts through effector transcripts other than GCK, or the impact of the low-frequency SNP near YKT6 on GCK expression involves tissue- and/or temporal-specific variation in regulatory impact.
In conclusion, we have identified 60 genetic loci associated with BW and used these to gain insights into the aetiology of foetal growth and into well-established, but until now poorly understood, lifecourse disease associations. The evidence that the relationship between early growth and later metabolic disease has an appreciable genetic component contrasts with, but is not necessarily incompatible with, the emphasis on adverse early environmental events highlighted by the Foetal Origins Hypothesis1. As we have shown, these genetic effects reflect variation in both the foetal and the maternal genome: the impact of the latter on the offspring’s predisposition to adult disease could be mediated, at least in part, through perturbation of the antenatal and early life environment. Future mechanistic and genetic studies should support reconciliation between these alternative, but complementary, explanations for the far-reaching lifecourse associations that exist between events in early life and predisposition to cardiometabolic disease several decades later.
Methods
Ethics statement
All human research was approved by the relevant institutional review boards and conducted
Europe PMC Funders Author Manuscripts
Ethical approval for the study was obtained from the ALSPAC Ethics and Law Committee and the Local Research Ethics Committees.
Study-level analyses
Within each study, BW was collected from a variety of sources, including measurements at birth by medical practitioners, obstetric records, medical registers, interviews with the mother and self-report as adults (Supplementary Table 1). BW was z-score transformed, separately in males and females. Individuals with extreme BW (>5 SD from the sex-specific study mean), monozygotic or polyzygotic siblings, or preterm births (gestational age <37 weeks, where this information was available) were excluded from downstream association analyses (Supplementary Table 1).
Within each study, stringent quality control of the GWAS genotype scaffold was undertaken, prior to imputation (Supplementary Table 2). Each scaffold was then pre-phased and imputed30,31 up to reference panels from the 1000G2 or 1000G and UK10K Project3 (Supplementary Table 2). Association of BW with each variant passing established GWAS quality control filters32 was tested in a linear regression framework, under an additive model for the allelic effect, after adjustment for study-specific covariates, including gestational age, where available (Supplementary Table 2). Where necessary, population structure was accounted for by adjustment for axes of genetic variation from principal components analysis33 and subsequent genomic control correction34, or inclusion of a genetic relationship matrix in a mixed model35 (Supplementary Table 2). We calculated the genomic control inflation factor (λ) in each study to confirm that study-level population structure was accounted for prior to meta-analysis.
Preparation, quality control and genetic analysis in UK Biobank samples
UK Biobank phenotype data were available for 502,655 participants36. All participants in the UK Biobank were asked to recall their BW, of which 279,971 did so at either the baseline or follow-up assessment visit. Of these, 7,686 participants reported being part of multiple births and were excluded from downstream analyses. Ancestry checks, based on self-reported ancestry, resulted in the exclusion of 8,998 additional participants reported not to be white European. Of those individuals reporting BW at baseline and follow-up
assessments, 393 were excluded because the two reported values differed by more than 0.5 kg. For those reporting different values (≤0.5 kg) between baseline and follow-up, we took the baseline measure forward for downstream analyses. We then excluded 36,716 individuals reporting values <2.5 kg or >4.5 kg as implausible for live term births before 1970. In total 226,178 participants had data relating to BW that matched these inclusion criteria.
Genotype data from the May 2015 release were available for a subset of 152,249 participants from UK Biobank. In addition to the quality control metrics performed centrally by UK Biobank, we defined a subset of “white European” ancestry samples using a K-means (K=4) clustering approach based on the first four genetically determined principal components. A maximum of 67,786 individuals (40,425 females and 27,361 males) with genotype and valid BW measures were available for downstream analyses. We tested for association with BW, assuming an additive allelic effect, in a linear mixed model implemented in BOLT-LMM37
Europe PMC Funders Author Manuscripts
to account for cryptic population structure and relatedness. Genotyping array was included as a binary covariate in all models. Total chip heritability (i.e. the variance explained by all autosomal polymorphic genotyped SNPs passing quality control) was calculated using Restricted Maximum Likelihood (REML) implemented in BOLT-LMM37. We additionally analysed the association between BW and directly genotyped SNPs on the X chromosome: for this analysis, we used 57,715 unrelated individuals with BW available and identified by UK Biobank as white British. We excluded SNPs with evidence of deviation from Hardy-Weinberg Equilibrium (P<1x10⁻⁶), MAF<0.01 or overall missing rate >0.015, resulting in 19,423 SNPs for analysis in Plink v1.07 (http://pngu.mgh.harvard.edu/purcell/plink/)38, with the first five ancestry principal components as covariates.
In both the full UK Biobank sample and our refined sample, we observed that BW was associated with sex, year of birth and maternal smoking (P<0.0015, all in the expected directions), confirming more comprehensive previous validation of self-reported BW4. We additionally verified that BW associations with lead SNPs at seven established loci5 based on self-report in UK Biobank were consistent with those previously published.
European ancestry meta-analysis
The European ancestry meta-analysis consisted of two components: (i) 75,891 individuals from 30 GWAS from Europe, USA and Australia; and (ii) 67,786 individuals of white European origin from UK Biobank. In the first component, we combined sex-specific BW association summary statistics across studies in a fixed-effects meta-analysis, implemented in GWAMA39 and applied a second round of genomic control34 (λGC= 1.001).
Subsequently, we combined association summary statistics from this component with UK Biobank in a European ancestry fixed-effects meta-analysis, implemented in GWAMA39. Variants failing GWAS quality control filters in UK Biobank, reported in less than 50% of the total sample size in the first component, or with MAF<0.1%, were excluded from the European ancestry meta-analysis. We aggregated X-Chromosome association summary statistics from UK Biobank (19,423 SNPs) with corresponding statistics from the European GWAS component using fixed effects P-value based meta-analysis in METAL40 (max N=99,152).
We were concerned that self-reported BW as adults in UK Biobank would not be comparable with that obtained from more stringent collection methods used in other European ancestry GWAS. In addition, UK Biobank lacked information on gestational age for adjustment, which could have an impact on difference in strength of association compared to the results obtained from other European ancestry GWAS. However, we observed no evidence of heterogeneity in BW allelic effects at lead SNPs between the two components of European ancestry meta-analysis, using Cochran’s Q statistic41,
implemented in GWAMA39, after Bonferroni correction (P>0.00083) (Supplementary Table 3). We tested for heterogeneity in allelic effects between studies within the European component using Cochran’s Q. At loci demonstrating evidence of heterogeneity, we confirmed that association signals were not being driven by outlying studies by visual inspection of forest plots. We performed sensitivity analyses to assess the impact of covariate adjustment (gestational age and population structure) on heterogeneity.
Europe PMC Funders Author Manuscripts
We were also concerned that overlap of individuals (duplicated or related) between the two components of the European ancestry meta-analysis might lead to false positive association signals. We performed bivariate LD Score regression8 using the two components of the European ancestry meta-analysis and observed a genetic covariance intercept of 0.0156 (SE 0.0058), indicating a maximum of 1,119 duplicate individuals. Univariate LD Score regression8 of the European ancestry meta-analysis estimated the intercept as 1.0426, which may indicate population structure or relatedness that is not adequately accounted for in the analysis. To assess the impact of this inflation on the European ancestry meta-analysis, we expanded the standard errors of BW allelic effect size estimates and re-calculated
association P-values. On the basis of this adjusted analysis, the lead SNP only at MTNR1B dropped below genome-wide significance (rs10830963, P=5.5x10⁻⁸).
Trans-ancestry meta-analysis
The trans-ancestry meta-analysis combined the two European ancestry components with an additional 10,104 individuals from six GWAS from diverse ancestry groups: African American, Chinese, Filipino, Surinamese, Turkish and Moroccan. Within each GWAS, we first combined sex-specific BW association summary statistics in a fixed-effects meta-analysis, implemented in GWAMA39 and applied a second round of genomic control34. Subsequently, we combined association summary statistics from the six non-European GWAS and the two European ancestry components in a trans-ancestry fixed-effects meta-analysis, implemented in GWAMA39. Variants failing GWAS quality control filters in UK Biobank, reported in less than 50% of the total sample size in the first component, or with MAF<0.1%, were excluded from the trans-ancestry meta-analysis. We tested for
heterogeneity in allelic effects between ancestries using Cochran’s Q41.
Approximate conditional analysis
We searched for multiple distinct BW association signals in each of the established and novel loci, defined as 1Mb up- and down-stream of the lead SNP from the trans-ancestry meta-analysis, through approximate conditional analysis. We applied GCTA42 to identify “index SNPs” for distinct association signals attaining genome-wide significance (P<5x10⁻⁸) in the European ancestry meta-analysis using a reference sample of 5,000 individuals of white British origin, randomly selected from UK Biobank, to approximate patterns of linkage disequilibrium (LD) between variants in these regions. Note that we performed approximate conditioning on the basis of only the European ancestry meta-analysis because GCTA cannot accommodate LD variation between diverse populations.
Prioritising candidate genes in each BW locus
We combined a number of approaches to prioritise the most likely candidate gene(s) in each BW locus. Expression quantitative trait loci (eQTLs) were obtained from the Genotype Tissue Expression (GTEx) Project43, the GEUVADIS Project44 and eleven other studies45– 55 using HaploReg v456. We interrogated coding variants for each BW lead SNP and its proxies (EUR r2>0.8) using Ensembl57 and HaploReg. Their likely functional consequences were predicted by SIFT58 and PolyPhen259. Biological candidacy was assessed by presence in significantly enriched gene set pathways from MAGENTA analyses (see below for details). We extracted all genes within 300 kb of all lead BW SNPs and searched for
Europe PMC Funders Author Manuscripts
connectivity between any genes using STRING60. If two or more genes between two separate BW loci were connected, they were given an increased prior for both being plausible candidates. We also applied protein-protein interaction (PPI) analysis (see below for details) to all genes within 300 kb of each lead BW SNPs and ranked the genes based on the score for connectivity with the surrounding genes.
Evaluation of imputation quality of low-frequency variant at the YKT6-GCK locus
At the YKT6-GCK locus, the lead SNP (rs138715366) is of low-frequency in European ancestry populations (MAF=0.92%) and even rarer in other ancestry groups (MAF=0.23% in African Americans, otherwise monomorphic) and is not present in the HapMap reference panel61. To assess the accuracy of imputation for this low-frequent variant, we genotyped rs138715366 in the Northern Finland Birth Cohort (NFBC) 1966 (Supplementary Table 1). Of the 5,009 samples in the study, 4,704 were successfully imputed and genotyped (or sequenced) for rs138715366. The overall concordance rate between imputed and directly assayed genotypes was 99.8% and for directly assayed heterozygote calls was 75.0%.
Fine-mapping analyses
We sought to leverage LD differences between populations contributing to the trans-ancestry meta-analysis and to take advantage of the improved coverage of common and
low-frequency variation offered by 1000G or 1000G and UK10K combined imputation to localise variants driving each distinct association signal achieving locus-wide significance. For each distinct signal, we used MANTRA62 to construct 99% credible sets of variants63 that together account for 99% of the posterior probability of driving the association. MANTRA incorporates a prior model of relatedness between studies, based on mean pair-wise allele frequency differences across loci, to account for heterogeneity in allelic effects (Supplementary Table 3). MANTRA has been demonstrated, by simulation, to improve localisation of causal variants compared with either a fixed- or random-effects trans-ancestry meta-analysis62,64.
For loci with only one signal of association, we used MANTRA to combine summary statistics from the six non-European GWAS and the two European ancestry components. However, for loci with multiple distinct association signals, we used MANTRA to combine summary statistics from approximate conditioning for the two European components, separately for each signal.
For each distinct signal, we calculated the posterior probability that the jth variant, πCj, is driving the association, given by
where the summation is over all variants mapping within the (conditional) meta-analysis across the locus. In this expression, Λj is the Bayes’ factor (BF) in favour of association from the MANTRA analysis. A 99% credible set63 was then constructed by: (i) ranking all
Europe PMC Funders Author Manuscripts
variants according to their BF, Λj; and (ii) including ranked variants until their cumulative posterior probability exceeds 0.99.
Genomic annotation
We used genomic annotations of DNaseI hypersensitive sites (DHS) from the ENCODE65 project and protein coding genes from GENCODE66. We filtered cell types that are cancer cell lines (karyotype ‘cancer’ from https://genome.ucsc.edu/ENCODE/cellTypes.html), and merged data from multiple samples from the same cell type. This resulted in 128 DHS cell-type annotations, as well as 4 gene-based annotations (coding exon, 5UTR, 3UTR and 1kb upstream of TSS). First, we tested for the effect of each cell type DHS and gene annotation individually using the Bayes’ factors for all variants in the 62 credible sets using fgwas67. Second, we categorised the annotations into ‘genic’, ‘foetal DHS’, ‘embryonic DHS’, ‘stem cell DHS’, ‘neonatal DHS’ and ‘adult DHS’ based on the description fields from ENCODE, and tested for the effect of each category individually as described above using fgwas. Third, we then tested the effect of each category by including all categories in a joint model using fgwas. For each of the three analyses, we obtained the estimated effects and 95% confidence intervals (CI) for each annotation, and considered an annotation enriched if the 95% CI did not overlap zero.
Estimation of genetic variance explained
Variance explained was calculated using the REML method implemented in GCTA68. We considered the variance explained by two sets of SNPs: (i) lead SNPs of all 62 distinct association signals at the 59 established and novel autosomal BW loci identified in the European-specific or trans-ancestry meta-analyses; (ii) lead SNPs of 55 distinct association signals at the 52 novel autosomal BW loci (Extended Data Table 1a and Supplementary Table 7). Variance explained was calculated in samples of European ancestry in the Hyperglycemia and Adverse Pregnancy Outcome (HAPO) study69 (independent of the meta-analysis) and two studies that were part of the European ancestry meta-analysis: NFBC1966 and Generation R (Supplementary Table 1). In each study, the genetic
relationship matrix was estimated for each set of SNPs and was tested individually against BW (males and females combined) with study specific covariates. These analyses provided an estimate and standard error for the variance explained by each of the given sets of SNPs.
Examining the relative effects on BW of maternal and foetal genotype at the 60 identified loci
We performed four sets of analyses.
First, we used GWAS data from 4,382 mother-child pairs in the Avon Longitudinal Study of Parents and Children (ALSPAC) study to fit a “maternal-GCTA model”6 to estimate the extent to which the maternal genome might influence offspring BW independent of the foetal genome. The m-GCTA model uses genome-wide genetic similarity between mothers and offspring to partition the phenotypic variance in BW into components due to the maternal genotype, the child’s genotype, the covariance between the two and environmental sources of variation.
Europe PMC Funders Author Manuscripts
Second, we compared associations with BW of the foetal versus maternal genotype at each of the 60 BW loci. The maternal allelic effect on offspring BW was obtained from a maternal GWAS meta-analysis of 68,254 European mothers from the EGG Consortium (n=19,626)7 and the UK Biobank (n=48,628). In the UK Biobank, mothers were asked to report the BW of their first child. Women of European ancestry with genotype data available in the May 2015 data release were included, and those with reported BW equivalent to <2.5 kg or >4.5 kg were excluded. No information on gestational age or gender of child was available. BW of first child was associated with maternal factors such as smoking status, BMI and height in the expected directions. Of the 68,254 women included in the maternal GWAS, 13% were mothers of individuals included in the current foetal European ancestry GWAS, and a further approximately 45% were themselves (with their own BW) included in the foetal GWAS.
Third, we additionally conducted analyses in 12,909 mother-child pairs from nine
contributing studies: at each of the 60 loci, we compared the effect of the foetal genotype on BW adjusted for sex and gestational age, with and without adjustment for maternal
genotype. We reciprocally compared the association between the maternal genotype and BW with and without adjustment for foetal genotype.
Fourth, we used the method of Zhang et al15 to test associations between BW and the maternal untransmitted, maternal transmitted and inferred paternal transmitted haplotype score of 422 height SNPs25, 30 SBP SNPs13,14 and 84 T2D SNPs24 in 5,201 mother-child pairs from the ALSPAC study.
LD Score Regression
The use of LD Score regression to estimate the genetic correlation between two traits/ diseases has been described in detail elsewhere70. Briefly, “LD Score” is a measure of how much genetic variation each variant tags; if a variant has a high LD Score then it is in high LD with many nearby polymorphisms. Variants with high LD Scores are more likely to contain more true signals and hence provide more chance of overlap with genuine signals between GWAS. The LD score regression method uses summary statistics from the GWAS meta-analysis of BW and the other traits of interest, calculates the cross-product of test statistics at each SNP, and then regresses the cross-product on the LD Score. Bulik-Sullivan et al70 show that the slope of the regression is a function of the genetic covariance between traits:
where Ni is the sample size for study i, ρg is the genetic covariance, M is the number of SNPs in the reference panel with MAF between 5% and 50%, lj is the LD score for SNP j, Ns quantifies the number of individuals that overlap both studies, and ρ is the phenotypic correlation amongst the Ns overlapping samples. Thus, if there is sample overlap (or cryptic relatedness between samples), it will only affect the intercept from the regression (i.e. the
Europe PMC Funders Author Manuscripts
term ) and not the slope, and hence estimates of the genetic covariance will not be biased by sample overlap. Likewise, population stratification will affect the intercept but will have minimal impact on the slope (i.e. intuitively since population stratification does not correlate with linkage disequilibrium between nearby markers).
Summary statistics from the GWAS meta-analysis for traits and diseases of interest were downloaded from the relevant consortium website. The summary statistics files were reformatted for LD Score regression analysis using the munge_sumstats.py python script provided on the developer’s website (https://github.com/bulik/ldsc). For each trait, we filtered the summary statistics to the subset of HapMap 3 SNPs71, as advised by the developers, to ensure that no bias was introduced due to poor imputation quality. Summary statistics from the European-specific BW meta-analysis were used because of the variable LD structure between ancestry groups. Where the sample size for each SNP was included in the results file this was flagged using --N-col; if no sample size was available then the maximum sample size reported in the reference for the GWAS meta-analysis was used. SNPs were excluded for the following reasons: MAF<0.01; ambiguous strand; duplicate rsID; non-autosomal SNPs; reported sample size less than 60% of the total available. Once all files were reformatted, we used the ldsc.py python script, also on the developers’ website, to calculate the genetic correlation between BW and each of the traits and diseases. The European LD Score files that were calculated from the 1000G reference panel and provided by the developers were used for the analysis. Where multiple GWAS meta-analyses had been conducted on the same phenotype (i.e. over a period of years), the genetic correlation with BW was estimated using each set of summary statistics and presented in
Supplementary Table 12. The phenotypes with multiple GWAS included height, BMI, waist-hip ratio (adjusted for BMI), total cholesterol, triglycerides, high density lipoprotein (HDL) and low density lipoprotein (LDL). The estimate of the genetic correlation between the multiple GWAS meta-analyses on the same phenotype were comparable and the later GWAS had a smaller standard error due to the increased sample size, so only the genetic correlation between BW and the most recent meta-analyses were presented in Fig. 2.
In the published GWAS for BP14 the phenotype was adjusted for BMI. Caution is needed when interpreting the genetic correlation between BW and BMI-adjusted SBP due to the potential for collider bias72. Since BMI is associated with both BP and BW, it is possible that the use of a BP genetic score adjusted for BMI might bias the genetic correlation estimate towards a more negative value. To verify that the inverse genetic correlation with BW (rg=-0.26, SE=0.05, P=6.5x10⁻⁹) was not due to collider bias caused by the BMI
adjustment of the phenotype, we obtained an alternative estimate using UK Biobank GWAS data for SBP that was unadjusted for BMI and obtained a similar result (rg=-0.22, SE=0.03,
P=5.5x10⁻¹³). The SBP phenotype in UK Biobank was prepared as follows. Two BP
readings were taken at assessment, approximately 5 minutes apart. We included all individuals with an automated BP reading (taken using an automated Omron BP monitor). Two valid measurements were available for most participants (averaged to create a BP variable, or alternatively a single reading was used if only one was available). Individuals were excluded if the two readings differed by more than 4.56 SD. BP measurements more
Europe PMC Funders Author Manuscripts
than 4.56 SD away from the mean were excluded. We accounted for BP medication use by adding 15 mmHg to the SBP measure. BP was adjusted for age, sex and centre location and then inverse rank normalised. We performed the GWAS on 127,698 individuals of British descent using BOLT-LMM37, with genotyping array as covariate.
Estimating the proportion of the BW-adult traits covariance attributable to genotyped SNPs
We estimated the phenotypic, genetic and residual correlations as well as the genetic and residual covariance between BW and several quantitative traits/disease outcomes in UK Biobank using directly genotyped SNPs and the REML method implemented in BOLT-LMM37. The traits examined included T2D, SBP, diastolic BP, CAD, height, BMI, weight, waist-hip ratio, hip circumference, waist circumference, obesity, overweight, age at menarche, asthma, and smoking. Where phenotypes were not available (e.g. serum blood measures are not currently available in UK Biobank), we obtained estimates using the NFBC1966 study (for correlations/covariance between BW and triglycerides, total
cholesterol, HDL, LDL, fasting glucose and fasting insulin). In the UK Biobank analysis, we used 57,715 unrelated individuals with BW available and identified by UK Biobank as white British. SNPs with evidence of deviation from Hardy-Weinberg Equilibrium (P<1x10⁻⁶), MAF<0.05 or overall missing rate >0.015 were excluded, resulting in 328,928 SNPs for analysis. We included the first five ancestry principal components as covariates. In the NFBC1966 analysis, 5,009 individuals with BW were enrolled. Genotyped SNPs that passed quality control (Supplementary Table 2) were included, resulting in 324,895 SNPs for analysis. The first three ancestry principal components and sex were included as covariates.
Gene set enrichment analysis
Meta-Analysis Gene-set Enrichment of variaNT Associations (MAGENTA) was used to explore pathway-based associations using summary statistics from the trans-ancestry meta-analysis. MAGENTA implements a gene set enrichment analysis (GSEA) based approach, as previously described9. Briefly, each gene in the genome is mapped to a single index SNP with the lowest value within a 110 kb upstream and 40 kb downstream window. This P-value, representing a gene score, is then corrected for confounding factors such as gene size, SNP density and LD-related properties in a regression model. Genes within the HLA-region were excluded from analysis due to difficulties in accounting for gene density and LD patterns. Each mapped gene in the genome is then ranked by its adjusted gene score. At a given significance threshold (95th and 75th percentiles of all gene scores), the observed number of gene scores in a given pathway, with a ranked score above the specified threshold percentile, is calculated. This observed statistic is then compared to 1,000,000 randomly permuted pathways of identical size. This generates an empirical GSEA P-value for each pathway. Significance was attained when an individual pathway reached a false discovery rate (FDR) <0.05 in either analysis. In total, 3,216 pre-defined biological pathways from Gene Ontology, PANTHER, KEGG and Ingenuity were tested for enrichment of multiple modest associations with BW. The MAGENTA software was also used for enrichment testing of custom gene sets.
Europe PMC Funders Author Manuscripts
Protein-Protein interaction network analyses
We used the integrative Protein-Interaction-Network-Based Pathway Analysis (iPINBPA) method73. Briefly, we generated gene-wise P-values from the trans-ancestry meta-analysis using VEGAS274, which map the SNPs to genes and account for possible cofounders, such as LD between markers. The empirical gene-wise P-values are calculated using simulations from the multivariate normal distribution. Those that were nominally significant (P≤0.01) were selected as “seed genes”, and were collated within high confidence version of inweb375, to weight the nodes in the network following a guilt-by-association approach. In a second step, a network score was defined by the combination of the z-scores derived from the gene-wise P-values with node weights using the Liptak-Stouffer method76. A heuristic algorithm was then applied to extensively search for modules enriched in genes with low P-values. The modules were further normalised using a null distribution of 10,000 random networks. Only those modules with z-score >5 were selected. Finally, the union of all modules constructed a BW-overall PPI network. Both the proteins on the individual modules and on the overall BW-PPI were interrogated for enrichment in Gene Ontology Terms (Biological Processes) using a Hypergeometric test. Terms were considered as significant when adjusted P-value, following Benjamini-Hochberg procedure, was below 0.05.
Point of contact (PoC) analyses
The same methodology described above was applied to 16 different adult traits resulting in a number of enriched modules per trait. Different modules for each trait were combined in a single component and the intersection between these trait-specific components and the BW component was calculated. This intersection is defined as the PoC network. We used the resulting PoC networks in downstream analyses to interrogate which set of proteins connects BW variation and adult trait variation via pathways enriched in the overall BW analysis.
Parent-of-origin specific associations
We first searched for evidence of parent of origin effects in the UK Biobank samples by comparing variance between heterozygotes and homozygotes using Quicktest77. In this analysis, we used only unrelated individuals identified genetically as of white British origin (n=57,715). Principal components were generated using these individuals and the first five were used to adjust for population structure as covariates in the analysis, in addition to a binary indicator for genotyping array.
We also examined 4,908 mother-child pairs in ALSPAC and determined the parental origin of the alleles where possible78. Briefly, the method uses mother-child pairs to determine the parent of origin of each allele. For example, if the mother/child genotypes are AA/Aa, the child’s maternal/paternal allele combination is A/a. For the situation where both mother and child are heterozygous, the child’s maternal/paternal alleles cannot be directly specified. However, the parental origin of the alleles can be determined by phasing the genotype data and comparing maternal and child haplotypes. We then tested these alleles for association with BW adjusting for sex and gestational age.
Statistical power in these currently available sample sizes is insufficient to rule out widespread parent-of-origin effects across the regions tested. Using the mean beta (0.034
Europe PMC Funders Author Manuscripts
SD) and MAF (0.28) of the identified loci, we estimate that we would need at least 200,000 unrelated individuals or 70,000 mother-child pairs for 80% power to detect parent-of-origin effects at P<0.00085.
Hierarchical clustering of BW loci
To explore the different patterns of association between BW and other anthropometric/ metabolic/endocrine traits and diseases, we performed hierarchical clustering analysis. The lead SNP (or proxy, EUR r2>0.6) at the 60 BW loci was queried in publicly available GWAS meta-analysis datasets or in GWAS result obtained through collaboration79. Results were available for 53 of those loci and the extracted z-score (allelic effect/SE, Supplementary Table 17) was aligned to the BW-raising allele. We performed two dimensional clustering by trait and by locus. We computed the Euclidean distance amongst z-scores of the extracted traits/loci and performed complete hierarchical clustering implemented in the pvclust package (http://www.sigmath.es.osaka-u.ac.jp/shimo-lab/prog/pvclust/) in R v3.2.0 (http:// www.R-project.org/). Clustering uncertainty was measured by multiscale bootstrap
resampling estimated from 1,000 replicates. We used α=0.05 to define distinct clusters and, based on the bootstrap analysis, calculated the Calinski index to identify the number of well-supported clusters (cascadeKM function, Vegan package, http://CRAN.R-project.org/ package=vegan). Clustering was visualised by constructing dendrograms and a heatmap.
Separately from the hierarchical clustering analysis, we queried the lead SNP at EPAS1 in a GWAS of haematological traits80 because variation at that locus has previously been implicated in BW and adaptation to hypoxia at high altitudes in Tibetans81,82 (Supplementary Table 17).
Europe PMC Funders Author Manuscripts
Extended Data
Extended Data Figure 1. Flow chart of the study design.
Europe PMC Funders Author Manuscripts
Extended Data Figure 2. Manhattan and quantile-quantile (QQ) plots of the trans-ancestry meta-analysis for birth weight.
a, Manhattan (main panel) and QQ (top right) plots of genome-wide association results for
BW from trans-ancestry meta-analysis of up to 153,781 individuals. The association P-value (on -log10 scale) for each of up to 22,434,434 SNPs (y axis) is plotted against the genomic
position (NCBI Build 37; x axis). Association signals that reached genome-wide
significance (P<5x10⁻⁸) are shown in green if novel and pink if previously reported. In the QQ plot, the black dots represent observed values and the grey line represents expected
Europe PMC Funders Author Manuscripts
the previously identified signals5. b, Manhattan (main panel) and QQ (top right) plots of trans-ethnic GWAS meta-analysis for BW highlighting the reported imprinted regions described in Supplementary Table 14. Novel association signals that reached genome-wide significance (P<5x10⁻⁸) and mapped to imprinted regions are shown in green. Genomic
regions outside imprinted regions are shaded in grey. SNPs in the imprinted regions are shown in light blue or dark blue, depending on chromosome number (odd or even). In the QQ plot, the black dots represent observed P values and the grey lines represent expected P-values and their 95% confidence intervals under the null distribution for the SNPs within the imprinted regions.
Europe PMC Funders Author Manuscripts
Extended Data Figure 3. Regional plots for multiple distinct signals at three birth weight loci, ZBTB7B (a), HMGA1 (b) and PTCH1 (c).
Regional plots for each locus are displayed from: the unconditional European-specific meta-analysis of up to 143,677 individuals (left); the approximate conditional meta-meta-analysis for the primary signal after adjustment for the index variant for the secondary signal (middle); and the approximate conditional meta-analysis for the secondary signal after adjustment for the index variant for the primary signal (right). Directly genotyped or imputed SNPs are plotted with their association P-values (on a -log10 scale) as a function of genomic position
Europe PMC Funders Author Manuscripts
LD structure around the index SNPs and their correlated proxies. SNPs are coloured in reference to LD with the particular index SNP according to a blue to red scale from r2 = 0 to 1, based on pairwise r2 values estimated from a reference of 5,000 individuals of white British origin, randomly selected from the UK Biobank.
Extended Data Figure 4. Comparison of foetal effect sizes and maternal effect sizes at 60 known and novel birth weight loci (continues to Extended Data Figure 5).
For each BW locus, the following six effect sizes (with 95% CI) are shown, all aligned to the same BW-raising allele: foetal_GWAS = foetal allelic effect on BW (from European ancestry meta-analysis of up to n=143,677 individuals); foetal_unadjusted = foetal allelic effect on BW (unconditioned in n=12,909 mother-child pairs); foetal_adjusted = foetal
Europe PMC Funders Author Manuscripts
effect (conditioned on maternal genotype, n=12,909); maternal_GWAS = maternal allelic effect on offspring BW (from meta-analysis of up to n=68,254 European mothers)7;
maternal_unadjusted = maternal allelic effect on offspring BW (unconditioned, n=12,909); maternal_adjusted = maternal effect (conditioned on foetal genotype, n=12,909). The 60
BW loci are ordered by chromosome and position (Supplementary Tables 10, 11). These plots illustrate that in large GWAS of BW, foetal effect size estimates are larger than those of maternal at 55/60 identified loci (binomial P=1x10-11), suggesting that most of the
associations are driven by the foetal genotype. In conditional analyses that modelled the effects of both maternal and foetal genotypes (n=12,909 mother-child pairs), confidence intervals around the estimates were wide, precluding inference about the likely contribution of maternal vs. foetal genotype at individual loci.
Europe PMC Funders Author Manuscripts
Extended Data Figure 5. Comparison of foetal effect sizes and maternal effect sizes at 60 known and novel birth weight loci.
a, Continued from Extended Data Figure 4. b, The scatterplot illustrates the difference
between the foetal (x axis) and maternal (y axis) effect sizes in the overall maternal vs. foetal GWAS results.
Europe PMC Funders Author Manuscripts
Extended Data Figure 6. Protein-Protein Interaction (PPI) Network analysis.
a, Illustrates the largest global component of birth weight (BW) PPI network containing 13
modules. b, The histogram shows the null distribution of z-scores of BW PPI networks based on 10,000 random networks, and where the z-scores for the 13 BW modules (M1-13) lie. For each module, the two most significant GO terms are depicted. c, Illustrates a heatmap which takes the top 50 biological processes over-represented in the global BW PPI network (listed at the right of the plot), and displays extent of enrichment for the various trait-specific “point of contact“ (PoC) PPI networks. d-e, Trait-specific PoC PPI networks
Europe PMC Funders Author Manuscripts
composed of proteins that are shared in both the global BW PPI network and networks generated using the same pipeline for each of the adult traits: d, canonical Wnt signalling pathway enriched for PoC PPI between BW and blood pressure (BP)-related phenotypes; and e, regulation of insulin secretion pathway enriched for PoC between BW and type 2 diabetes (T2D)/fasting glucose (FG). Red nodes are those that are present in PoC for BW and traits of interest; blue nodes correspond to the pathway nodes; purple nodes are those present in both the pathway and PoC; orange nodes are genes in BW loci that overlap with both the pathway and PoC. Large nodes correspond to genes in BW loci (within 300kb from the lead SNP), and have black border if they, amongst all BW loci, have a stronger (top 5) association with at least one of the pairing adult traits.
Extended Data Figure 7. Quantile-Quantile (QQ) plots of (a) variance comparison between heterozygotes and homozygotes analysis in 57,715 UK Biobank samples and (b) parent-of-origin specific analysis in 4,908 ALSPAC mother-child pairs at 59 autosomal birth weight loci plus DLK1.
a, QQ plot from the Quicktest77 analysis comparing the BW variance of heterozygotes with
homozygotes in 57,715 UK Biobank samples. b, QQ plot from the parent-of-origin specific analysis testing the association between BW and maternally transmitted vs. paternally transmitted alleles in 4,908 mother-child pairs from the ALSPAC study (Methods, Supplementary Tables 15, 16). In both panels, the black dots represent lead SNPs at 59 identified autosomal BW loci and a further sub-genome-wide significant signal for BW near DLK1 (rs6575803; P=5.6x10⁻⁸). The grey lines represent expected P values and their 95%
confidence intervals under the null distribution for the 60 SNPs. Both results show trends in favour of imprinting effects at BW loci: however, despite the large sample size, these analyses were underpowered (see Methods) and much larger sample sizes are required for definitive analysis.
Europe PMC Funders Author Manuscripts
Extended Data Figure 8. Summary of previously reported loci for systolic blood pressure (SBP, a), coronary artery disease (CAD, b, e), type 2 diabetes (T2D, c, f) and adult height (d) and their effect on birth weight.
a-d, Effect sizes (left y axis) of previously reported 30 SBP loci13,14, 45 CAD loci23, 84 T2D loci24 and 422 adult height loci25 are plotted against effects on BW (x axis). Effect sizes are aligned to the adult trait-raising allele. The colour of each dot indicates BW association P value: red, P<5×10⁻⁸; orange, 5×10⁻⁸≤P<0.001; yellow, 0.001≤P<0.01; white,
P≥0.01. The superimposed grey frequency histogram shows the number of SNPs (right y
Europe PMC Funders Author Manuscripts
CAD loci are plotted arranged in the order of CAD effect size from highest to lowest, separating out the known SBP loci. CAD loci with a larger effect on BW concentrated amongst loci with primary BP association. f, Effect sizes (with 95% CI) on BW of 32 known T2D loci are plotted, subdivided by previously reported categories derived from detailed adult physiological data27. Heterogeneity in BW effect sizes between five T2D loci groups with different mechanistic categories was substantial (Phet=1.2x10⁻⁹). In pairwise
comparisons, the “beta cell” group of variants differed from the other four groups: fasting hyperglycaemia (Phet =3x10-11), insulin resistance (Phet =0.002), proinsulin (Phet =0.78) and unclassified (Phet =0.02) groups. All of the BW effect sizes plotted in the forest plots are aligned to the trait (or risk)-raising allele.
Europe PMC Funders Author Manuscripts
Extended Data T
ab
le 1
Sixty loci associated with birth weight (P<5x10
−8
) in Eur
opean ancestry meta-analysis of up to 143,677 indi
viduals and/or trans-ancestry
meta-analysis of up to 153,781 indi
viduals.
a,
Ef
fects (beta v
alues) are aligned to the BW
-raising allele. EAF w
as obtained from the trans-ancestry meta-analysis, e
xcept for
PLA
C1
, for which the
EAF w
as obtained from the European ancestry meta-analysis due to lack of X chromosome data from the non-European studies. Chr
., chromosome; bp,
base pair; EAF
, ef
fect allele frequenc
y; SE, standard error
.
b,
The ef
fect of the lead SNP (absolute v
alue of beta,
y
axis) is gi
v
en as a function of minor
allele frequenc
y (
x
axis) for 60 kno
wn (pink) and no
v
el (green) BW loci from the trans-ancestry meta-analysis. Error bars are proportional to the standard
error of the ef
fect size. The dashed line indicates 80% po
wer to detect association at genome-wide signif
icance le
v
el for the sample size in trans-ancestry
meta-analysis. a Locus
Lead SNP
Chr
.
P
osition (bp, b37)
Alleles EAF Eur opean ancestry T rans-ancestry Effect/Other β (SE) P -v alue β (SE) P -v alue Pr eviously r eported loci CCNL1-LEKR1 rs13322435 3 156,795,468 A/G 0.59 0.053 (0.004) 3.7x10 -41 0.052 (0.004) 1.3x10 -42 HMGA2 rs1351394 12 66,351,826 T/C 0.48 0.044 (0.004) 1.9x10 -32 0.043 (0.004) 2.0x10 -33 CDKAL1 rs35261542 6 20,675,792 C/A 0.73 0.044 (0.004) 4.4x10 -27 0.044 (0.004) 9.7x10 -29 ADCY5 rs11719201 3 123,068,744 T/C 0.23 0.046 (0.004) 2.4x10 -26 0.046 (0.004) 6.4x10 -27 ADRB1 rs7076938 10 115,789,375 T/C 0.73 0.036 (0.004) 4.7x10 -18 0.035 (0.004) 4.7x10 -18 LCORL rs925098 4 17,919,811 G/A 0.28 0.034 (0.004) 5.4x10 -16 0.032 (0.004) 1.3x10 -15 5q11.2 rs854037 5 57,091,783 A/G 0.80 0.027 (0.005) 2.2x10 -8 0.025 (0.005) 3.5x10 -8 No v el loci EP AS1 rs1374204 2 46,484,205 T/C 0.70 0.047 (0.004) 6.2x10 -29 0.046 (0.004) 1.5x10 -29 YKT6-GCK rs138715366 7 44,246,271 C/T 0.99 0.241 (0.023) 7.2x10 -26 0.244 (0.023) 1.4x10 -26 ESR1 rs1101081 6 152,032,917 C/T 0.73 0.038 (0.004) 1.6x10 -19 0.037 (0.004) 6.1 x10 -20 PTCH1 rs28510415 9 98,245,026 G/A 0.09 0.056 (0.007) 1.5x10 -17 0.053 (0.006) 4.0x10 -16 CLDN7 rs 113086489 17 7,171,356 T/C 0.55 0.031 (0.004) 9.1 x10 -16 0.030 (0.004) 1.3X10 -15 HHEX-IDE rs61862780 10 94,468,643 T/C 0.52 0.028 (0.004) 3.0x10 -14 0.028 (0.004) 9.5x10 -15 STRBP rs700059 9 125,824,055 G/A 0.16 0.033 (0.005) 4.7x10 -10 0.036 (0.005) 1.2x10 -12 HHIP rs6537307 4 145,601,863 G/A 0.48 0.025 (0.004) 9.5x10 -12 0.026 (0.004) 1.3x10 -12 ZBTB7B rs3753639 1 154,986,091 C/T 0.23 0.031 (0.004) 7.3x10 -12 0.031 (0.004) 1.3x10 -12
Europe PMC Funders Author Manuscripts
a Locus
Lead SNP
Chr
.
P
osition (bp, b37)
Alleles EAF Eur opean ancestry T rans-ancestry Effect/Other β (SE) P -v alue β (SE) P -v alue SREBF2 rs62240962 22 42,259,524 C/T 0.92 0.047 (0.007) 9.7x10 -12 0.047 (0.007) 3.7x10 -2 MLXIPL rs62466330 7 73,056,805 C/T 0.07 0.049 (0.008) 1.2x10 -12 0.051 (0.007) 5.9x10 -12 ANK1-NKX6-3 rs13266210 8 41,533,514 A/G 0.79 0.031 (0.005) 1.3x10 -11 0.030 (0.004) 1.6x10 -11 L3MBTL3 rs1415701 6 130,345,835 G/A 0.73 0.025 (0.004) 2.6x10 -9 0.027 (0.004) 4.0x10 -11 A T AD2B rs7575873 2 23,962,647 A/G 0.88 0.038 (0.006) 1.3x10 -11 0.036 (0.006) 6.2x10 -11 C20orf203 rs28530618 20 31,275,581 A/G 0.50 0.026 (0.004) 7.7x10 -12 0.024 (0.004) 8.4x10 -11 MAFB rs6016377 20 39,172,728 T/C 0.45 0.024 (0.004) 9.5x10 -10 0.024 (0.004) 3.7x10 -10 CP A3 rs10935733 3 148,622,968 T/C 0.42 0.022 (0.004) 9.2x10 -9 0.023 (0.004) 6.2x10 -10 INS-IGF2 rs72851023 11 2,130,620 T/C 0.07 0.048 (0.008) 2.9x10 -10 0.046 (0.007) 6.8x10 -10 IGF2BP3 rs11765649 7 23,479,013 T/C 0.76 0.027 (0.004) 5.8x10 -10 0.026 (0.004) 1.0x10 -9 WNT4-ZBTB40 rs2473248 1 22,536,643 C/T 0.87 0.033 (0.006) 1.1x10 -8 0.033 (0.005) 1.1x10 -9 IGF1R rs7402982 15 99,193,269 A/G 0.42 0.023 (0.004) 2.3x10 -9 0.023 (0.004) 1.1x10 -9 PLA C1 rs11096402 X 133,827,868 G/A 0.25 0.028 (0.005) 1.3x10 -9 N/A N/A EBF1 rs7729301 5 157,886,953 A/G 0.72 0.024 (0.004) 1.6x10 -8 0.025 (0.004) 1.3x10 -9 SUZ12P1-CRLF3 rs144843919 17 29,037,339 G/A 0.96 0.066 (0.012) 1.4x10 -8 0.068 (0.011) 1.5x10 -9 FCGR2B rs72480273 1 161,644,871 C/A 0.17 0.031 (0.005) 8.0x10 -10 0.030 (0.005) 1.5x10 -9 RNF219-AS1 rs1819436 13 78,580,283 C/T 0.87 0.033 (0.006) 6.3x10 -9 0.033 (0.005) 1.8x10 -9 NT5C2 rs74233809 10 104,913,940 C/T 0.08 0.037 (0.007) 5.2x10 -8 0.039 (0.006) 1.8x10 -9 SLC45A4 rs12543725 8 142,247,979 G/A 0.60 0.023 (0.004) 1.2x10 -9 0.022 (0.004) 1.9x10 -9 GPR139 rs1011939 16 19,992,996 G/A 0.31 0.022 (0.004) 1.3x10 -7 0.024 (0.004) 2.7x10 -9 SP6-SP2 rs12942207 17 45,968,294 C/T 0.30 0.022 (0.004) 5.1x10 -8 0.024 (0.004) 3.0x10 -9 GN A12 rs798489 7 2,801,803 C/T 0.74 0.023 (0.004) 2.0x10 -8 0.024 (0.004) 5.0x10 -9 PHF19 rs7847628 9 123,631,225 G/A 0.67 0.023 (0.004) 1.0x10 -8 0.023 (0.004) 5.4x10 -9 PLEKHA1 rs2421016 10 124,167,512 T/C 0.48 0.021 (0.004) 1.8x10 -8 0.021 (0.004) 6.1x10 -9 JA G1 rs6040076 20 10,658,882 C/G 0.51 0.023 (0.004) 2.0x10 -9 0.022 (0.004) 7.2x10 -9 LINC00332 rs2324499 13 40,662,001 G/C 0.67 0.022 (0.004) 7.3x10 -8 0.023 (0.004) 8.3x10 -9 IGF1 rs7964361 12 102,994,878 A/G 0.08 0.039 (0.007) 4.7x10 -9 0.038 (0.007) 9.7x10 -9 FES rs12906125 15 91,427,612 G/A 0.69 0.023 (0.004) 1.7x10 -8 0.023 (0.004) 1.0x10 -8